-
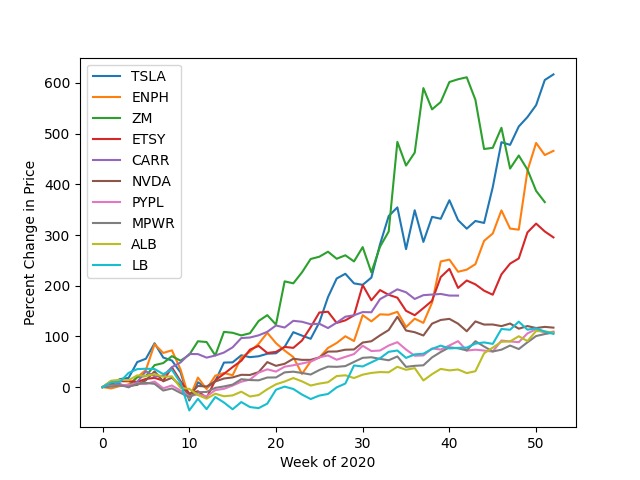
most volatile stocks
-

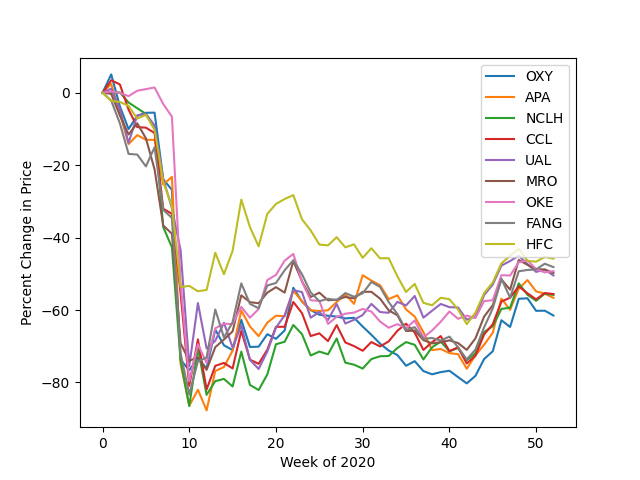
losers of the market
-
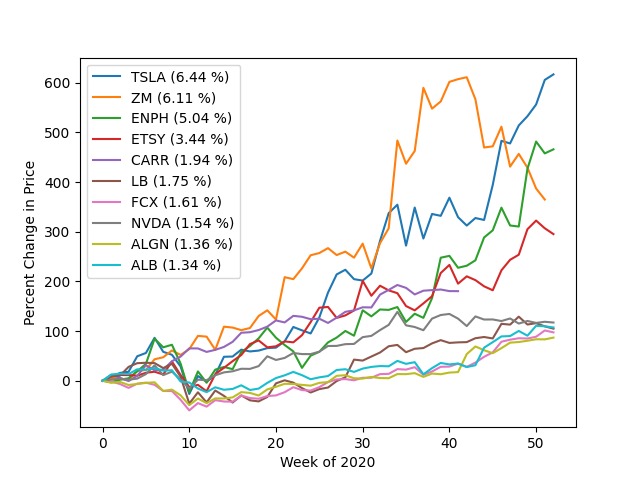
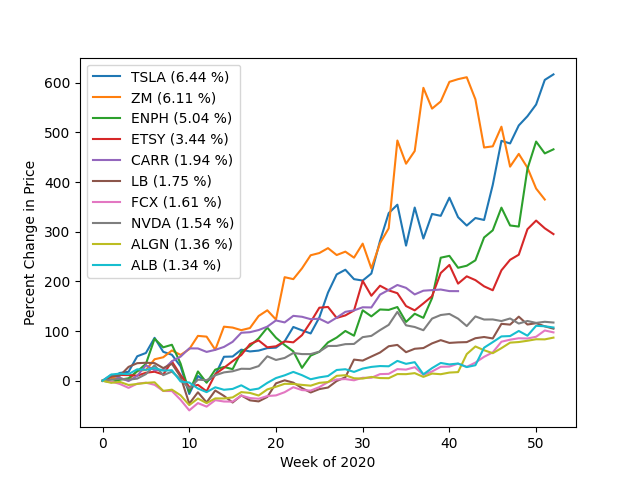
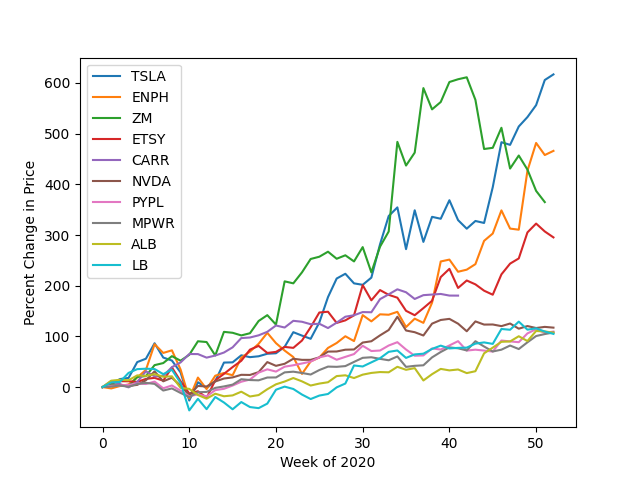
winners of the market
-
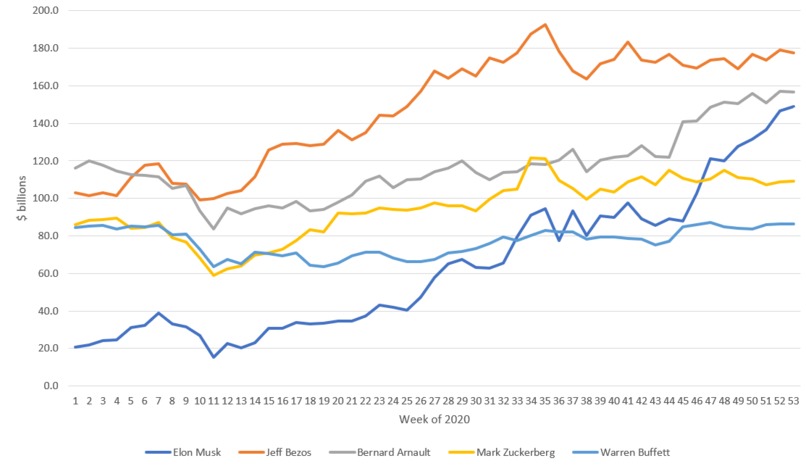
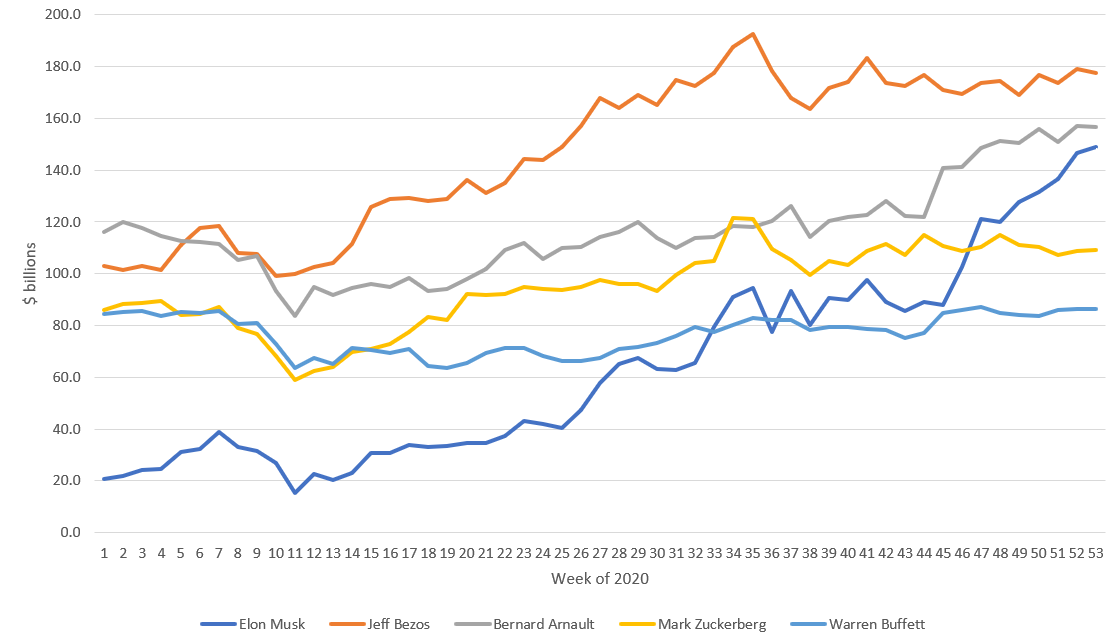
richest people
github link: https://github.com/nathanesau/ezhacks
Inspiration
We were inspired by the Covid 19 pandemic's impact on stock market. We wanted to see which companies benefited most from pandemic. Example: Ecommerce stocks like AMZN benefit a lot. Airlines stocked dropped a lot.
What it does
We built a website in 6-7 hours. The site allows shows the winners and losers (companies) from pandemic. Also, we analyzed the wealth increases of richest people (elon musk, jeff bezos, etc.). That was quite interesting as well. Also, we provide way of viewing our data using Flask.
How we built it
Flask + dataprep + Python + matplotlib
Challenges we ran into
Time. Just time.
Accomplishments that we're proud of
Getting the thing done. And the graphs are super cool.
What we learned
A lot about the stock market. And literally had to learn dataprep in like an hour.
What's next for winners-and-losers-of-covid
Not sure. If I had more time, I would have liked to show more graphs for each company. and figure out more trends with actual models. Cool to allow user to pick number of stocks or relative ranks. also showing percentage gain for rich people. and make graphs interactive. currently, they are just pngs. also, user could perform some selections on the site and we render graphs in realtime. just no time to implement all that.


Log in or sign up for Devpost to join the conversation.