-
-

Analyzing Traffic in and around Windsor-Detroit Region
Inspiration
The challenge to work on real-world problems and generating insights out of the data has inspired us to utilize our technical expertise for the development of the community.
What it does
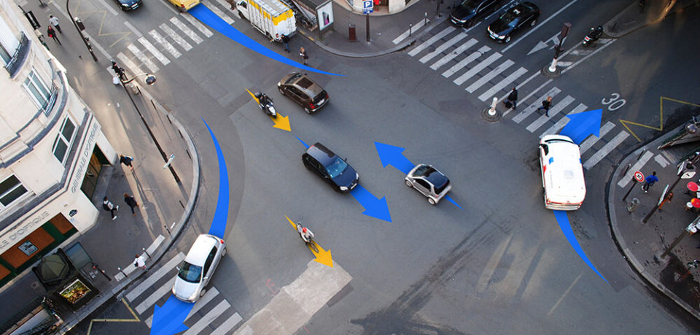
It tries to gain insights on which is the busiest intersections connecting the two cities (Windsor and Detroit), further we classified the various type of vehicles and their effects on the ongoing traffic.
How we built it
Used Jupyter Notebooks to combine all the data-sets of the different intersections and then visualize the intricacies the recorded data and predicting the travel time from one intersection to another
Challenges we ran into
Understand how the Travel Time Data and the Intersections data complement each other, combining the same to derive insights out of it.
Accomplishments that we're proud of
Gained Domain Knowledge on Traffic data, how it is recorded, how it can be interpreted, and used in the best possible way.
What we learned
Power Bi is a very useful visualization tool, combining the power of Python and Power Bi, we could create a great dashboard that can generate some useful information
What's next for Win Hacks Project 2020
Moving ahead with the project on a larger scale, to create an impact.

Log in or sign up for Devpost to join the conversation.