-
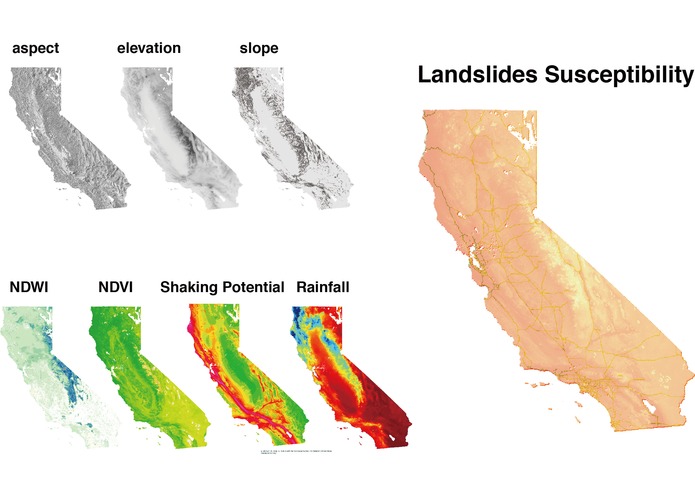
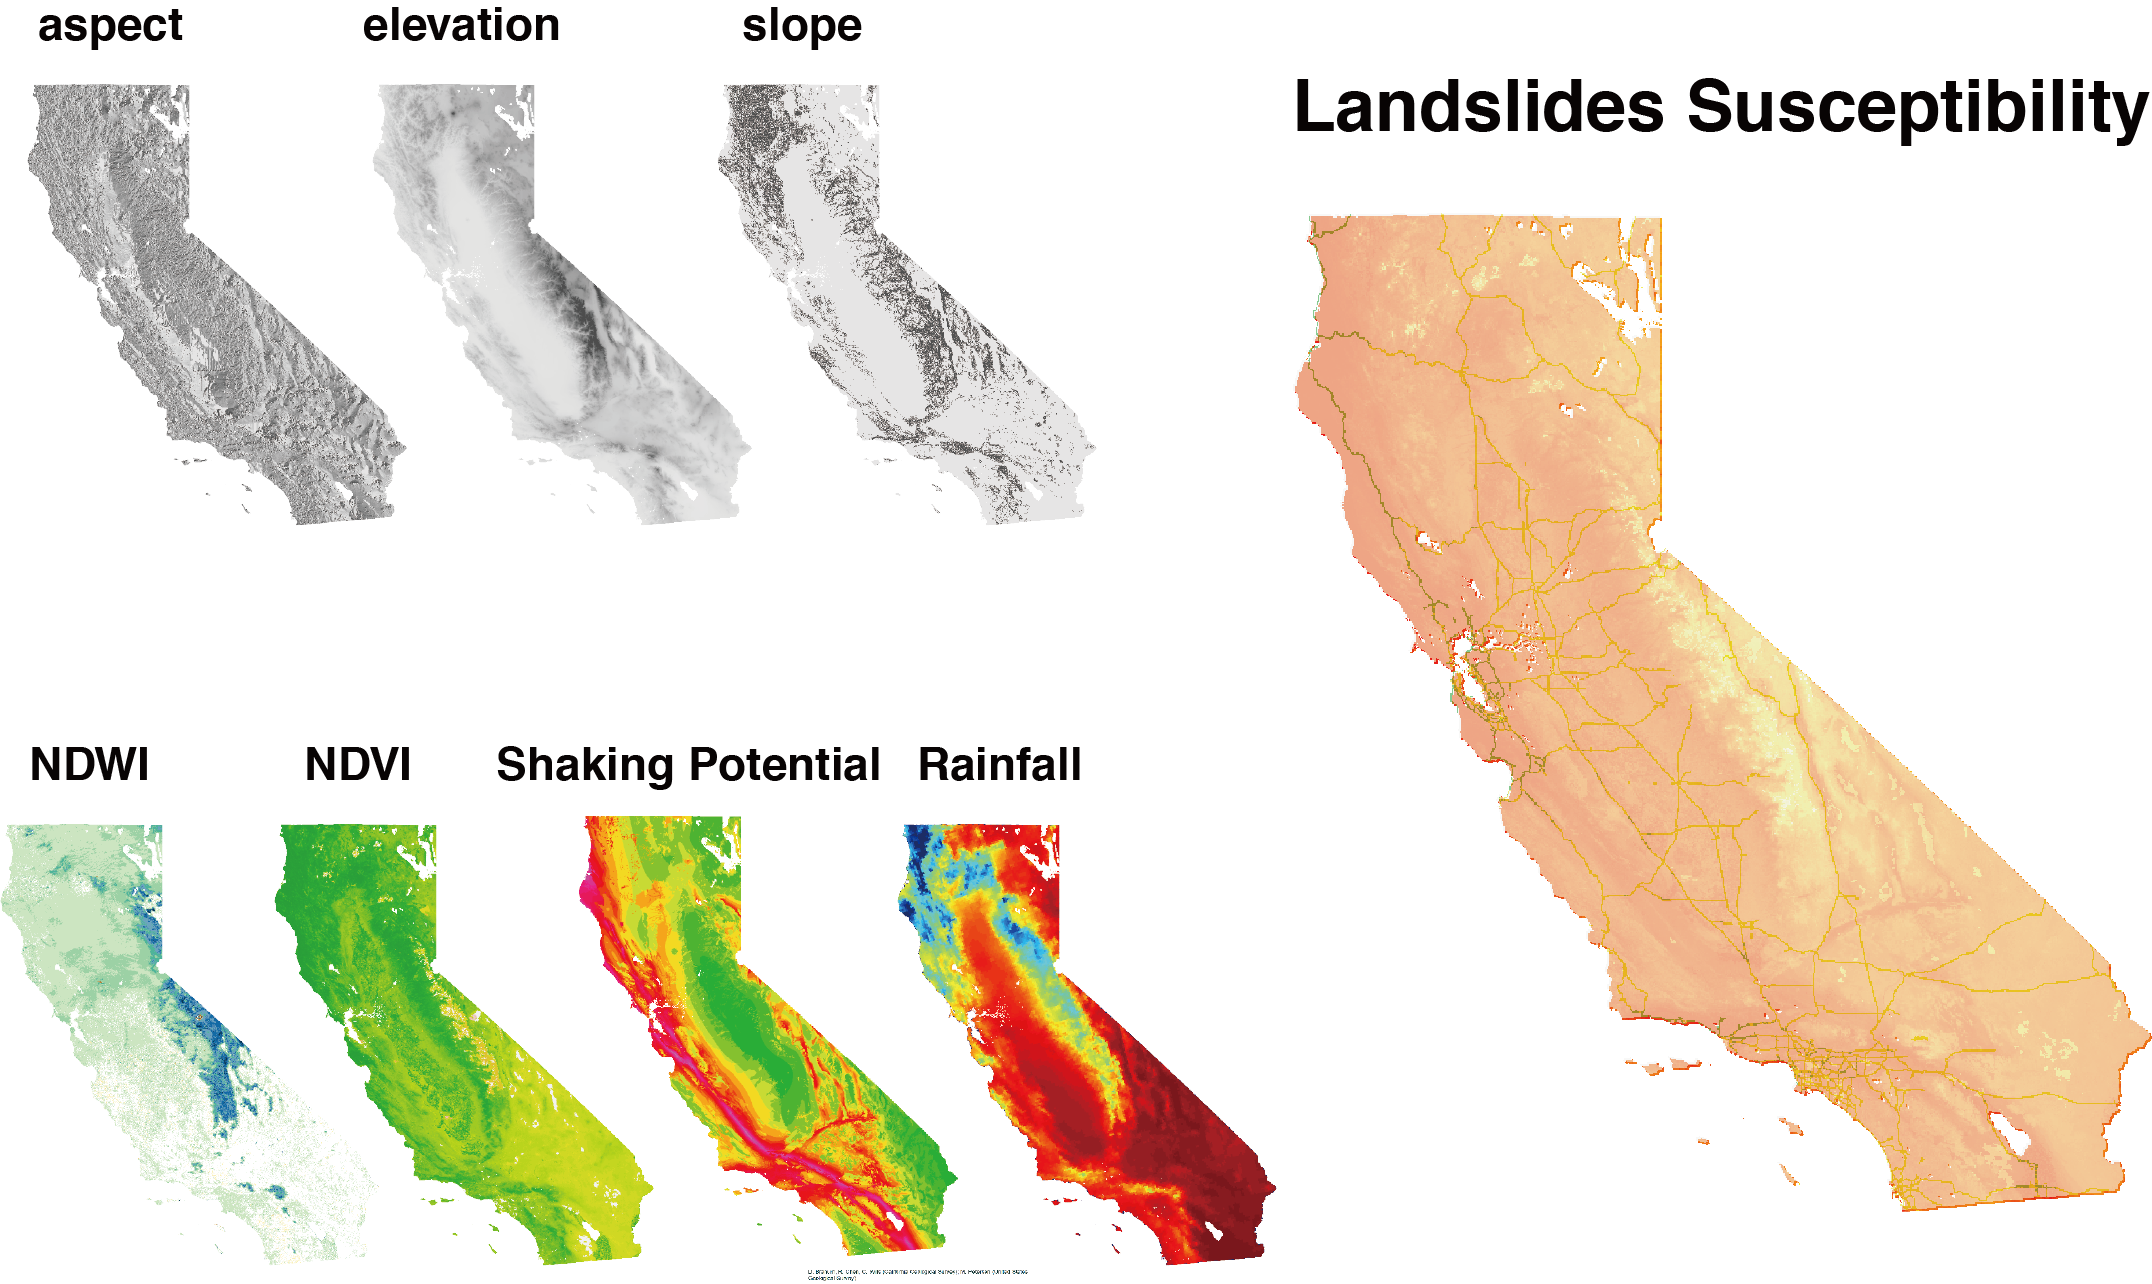
imported maps and generated susceptibility map
-
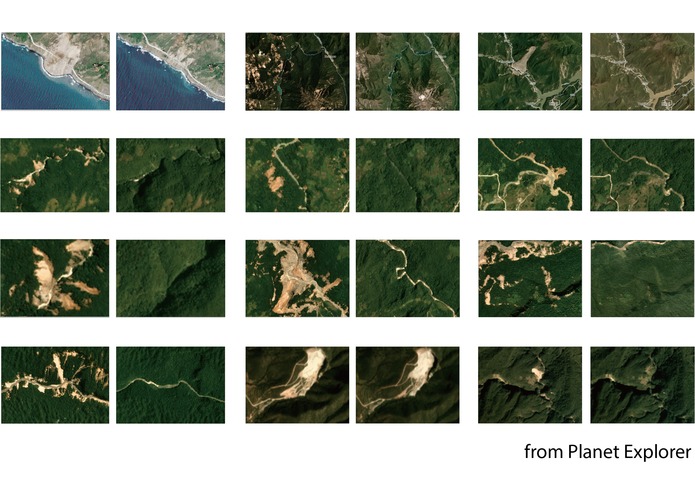
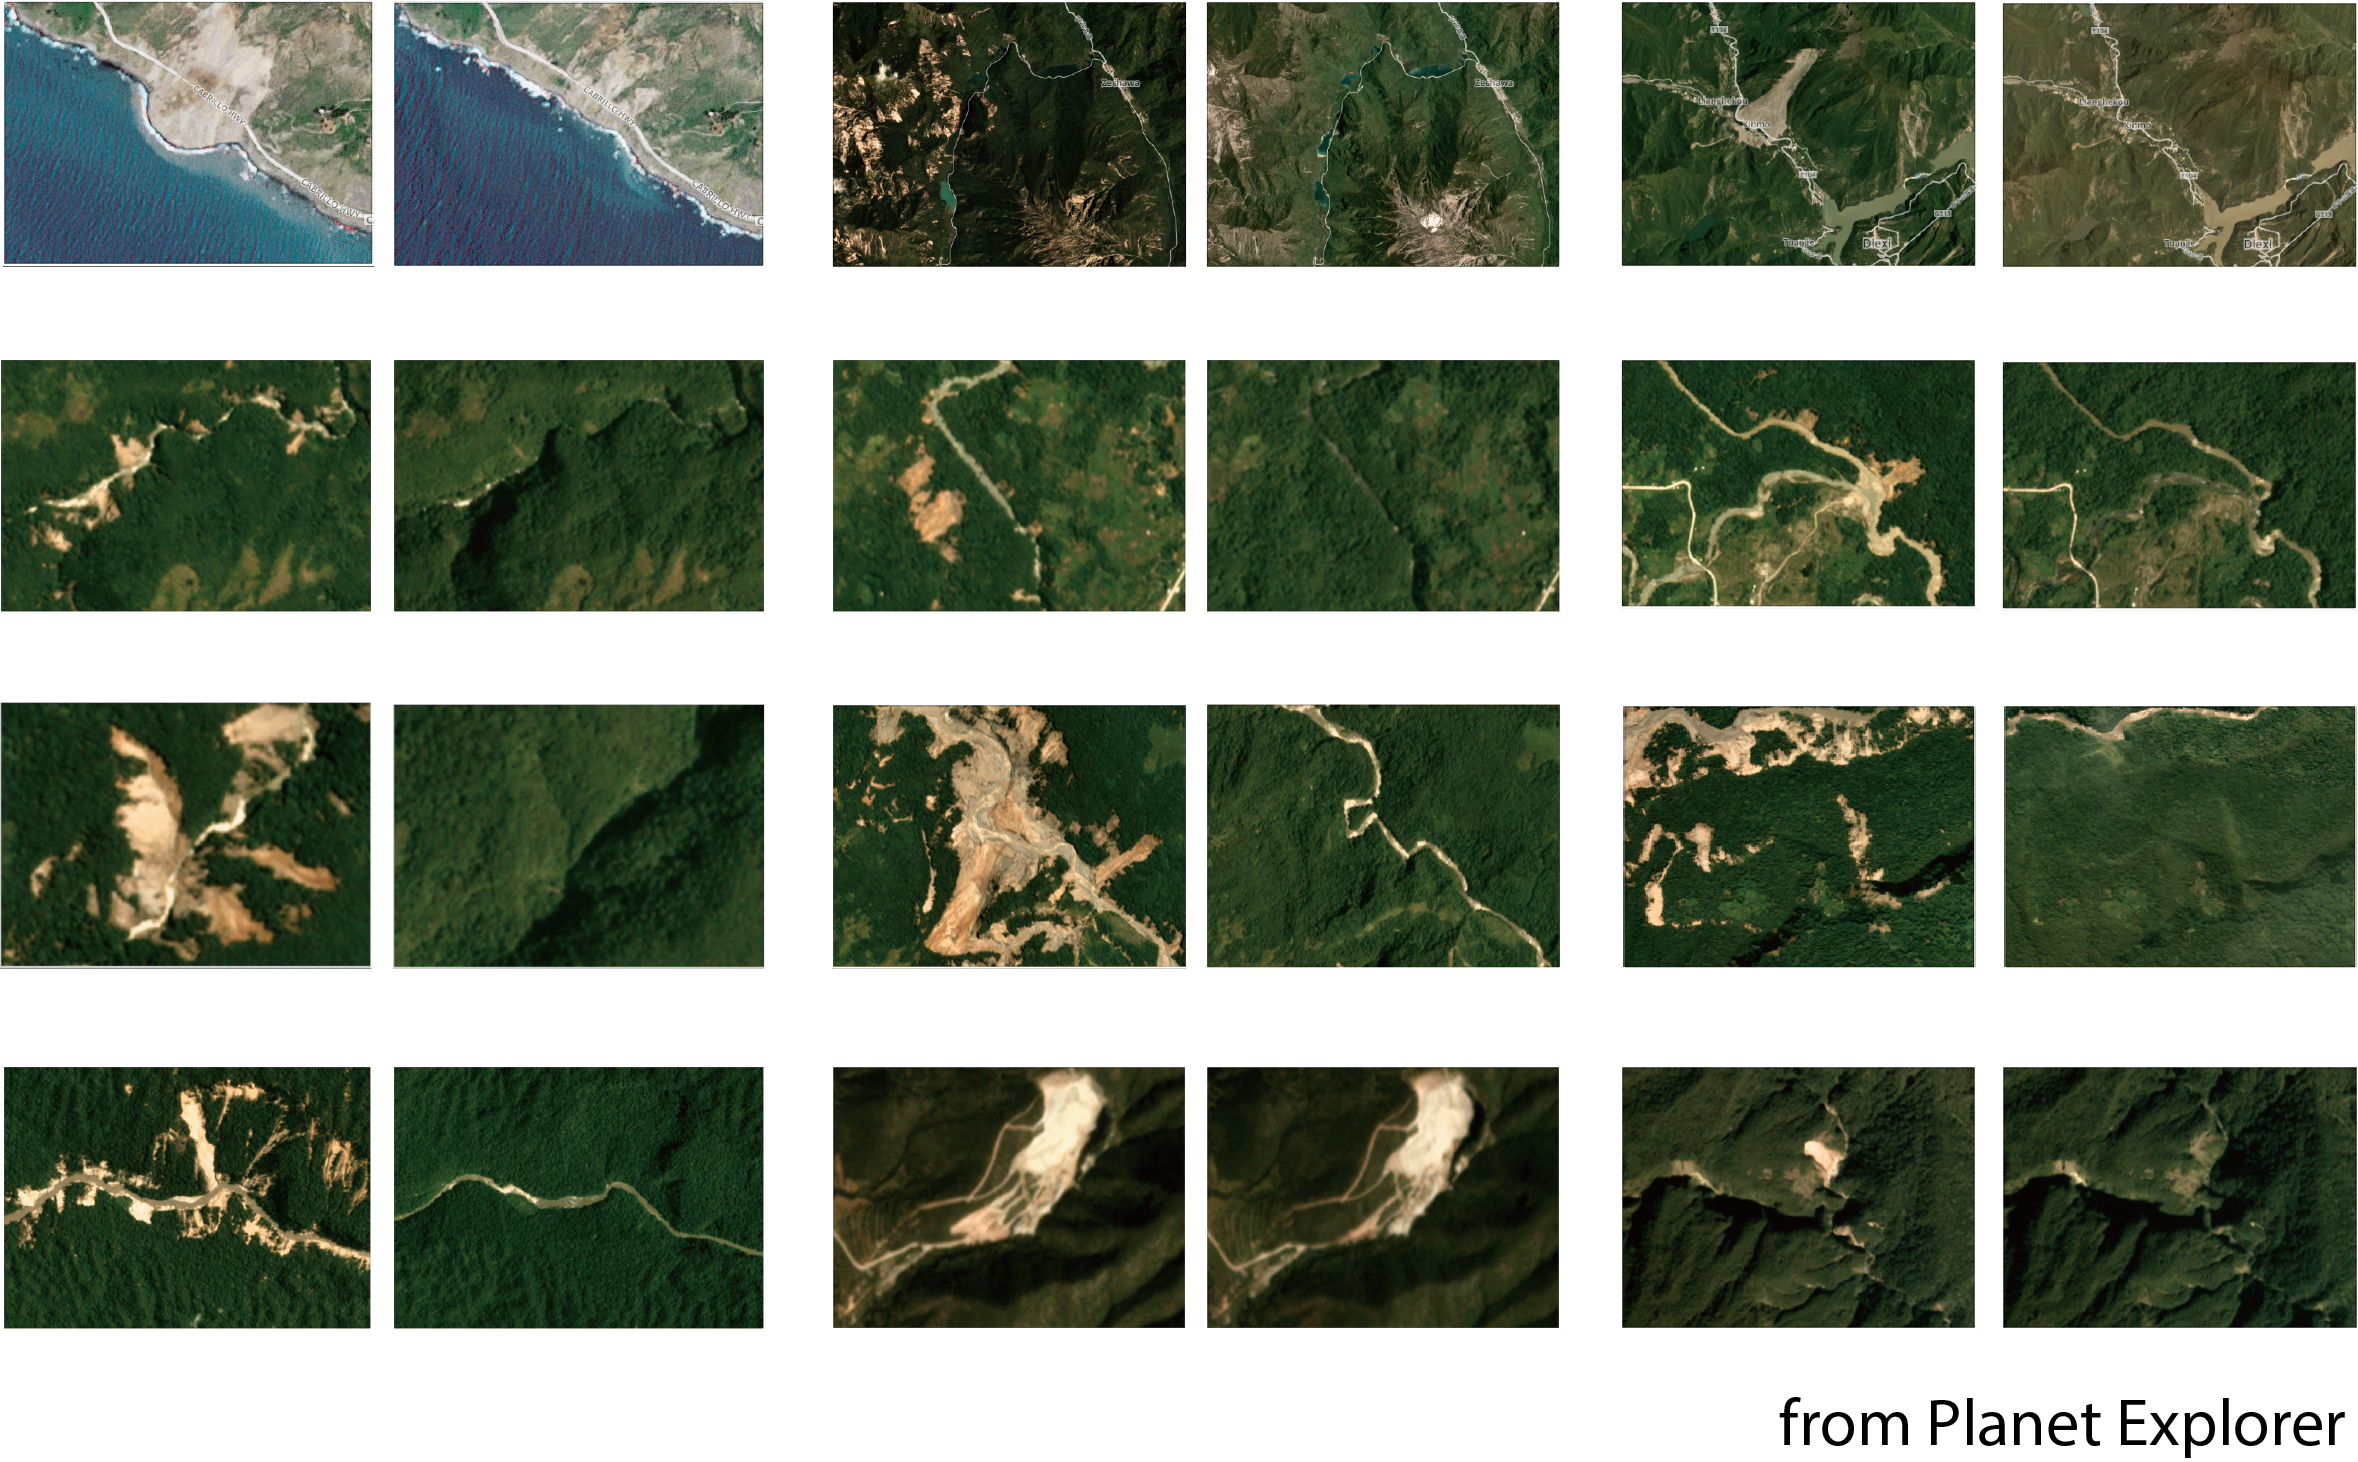
samples of training data for landslide detection
Inspiration
On 24 June 2017, a landslide struck Diexi Town, Mao County, Sichuan Province, China. It wiped out almost the entire Xinmo Village and killed 10 people, with almost 100 people missing; Aftershocks of the 2018 Papua New Guinea earthquake triggered numerous landslides that not only buried several remote villages, but hampered emergent deliveries to thousands displaced people. One can easily name several other tragedies caused by such fatal disasters, which occur globally and cause tremendous damages to both natural and social environment. Powered by the advanced satellite technologies and state-of-the-art machine learning algorithms, we want to do something about it.
What it does
Landslides can be triggered by many factors, including earthquake or volcano activities, erosion, rain fall and vegetation change. In many cases, they are inevitable. Instead of thinking about preventing a landslide to happen, we want to produce a hazard susceptibility map, which combines all the current available geographical information and describes the relative likelihood of future landsliding in California. At the meantime, identify landslide zone could be crucial for hazard assessment as well as disaster relief. Such information, on the other hand, could be iterated into the model and update the susceptibility map, which improves its reliability and also makes one step closer to achieve landslide monitoring. We therefore want to take the chance to explore the Planet imagery and try to tackle this issue with machine learning.
How we built it
Follow L. Ayalew and H. Yamagishi (2005), we use logistic regression to obtain the susceptibility map. The parameters or data we use here include aspect, elevation, slope angle, NDVI (normalized difference vegetation index), NDWI (Normalized difference water index), annual precipitation and earthquake shaking potential. Both NDVI and NDWI data are retrieved from google earth engine; slope information is generated in Arcmap using DEM, which is obtained from GTOPO30; annual precipitation is available on NOAA national weather service, advanced hydrologic prediction service and earthquake shaking potential map is obtained from USGS. Our sensitivity analysis reveals that, at least in California, landslide is most sensitive to earthquake shaking potential; all of the considered parameters are critical to provide the probability analysis. We also give one application of the generated susceptibility map by overlaying it with the state highway distributions. The resulted highway vulnerability map could be useful for urban design. Since labeled data is important to train a landslide detection model and apparently there’s no such data available (as far as we know). One of the team member has to manually find landslides using Planet Explorer and obtains 46 pairs of ‘before' and 'after’ images (96 images in total). Given the limited training data, the gradient boosting tree algorithm is used to classify whether a place is effected by landslide or not. 42 features are extracted based on the RGB index of each picture. Out of the 96 images, 80 are used for training and the rest 12 for testing. After carefully tuning the model, we finally obtain a 70% accuracy on the test set.
Challenges we ran into
Lack of experience in dealing with GIS data delays our progress. But after some self-teaching, we manage to overcome that. As mentioned above, we do not have enough data for detection and have to build the dataset by ourselves. It started slowly but the team member ended up training himself well, which makes the second part of the project possible.
Accomplishments that we're proud of
We overcame the challenges we ran into and came up with a preliminary but promising product in such limited time.
What we learned
First of all, we learned how to collect and integrate GIS data. We tested the knowledge learned in class (e.g. the logistic regression and the gradient boosting tree algorithm) and applied them to solve a challenge problem. In addition, we got the chance to explore the Planet products which could become handy in our future studies.
What's next for win by a landslide
The susceptibility map is made only for California in this project. It is because of the limited time as well as the fact that related data may not always be available in other places. If time (also data) allows, it is possible to spatially extend such probability analysis to other regions, especially places suffered heavily from landslides historically. Besides, the training data used in the landslide detection problem is extremely poor. Given more data, equipped with other machine learning techniques, like CNN, we will be able to achieve better performances. Just think out loud, one step further could be combining the susceptibility maps, the global satellite imagery and the detecting models to build a landslide early warning system.


Log in or sign up for Devpost to join the conversation.