-
-
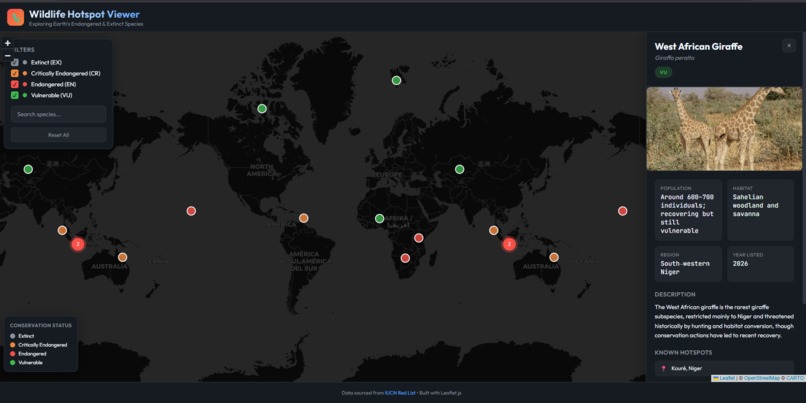
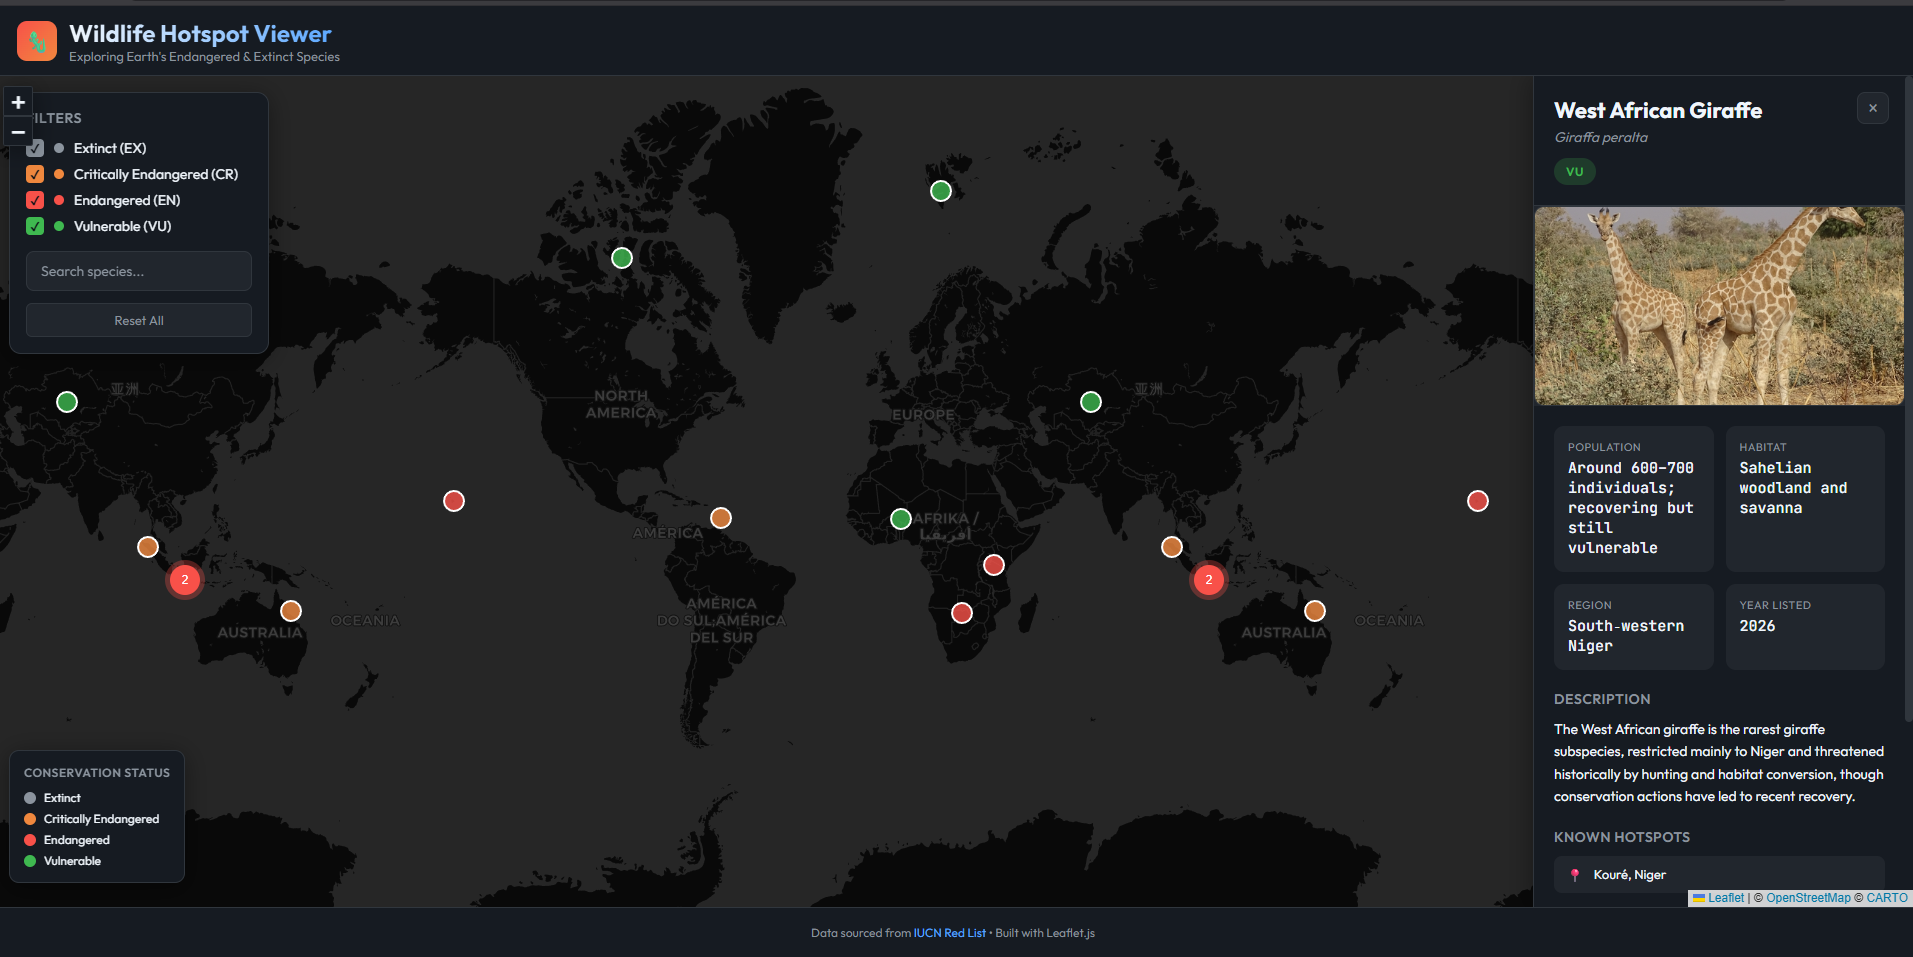
Interactive map with species details
-
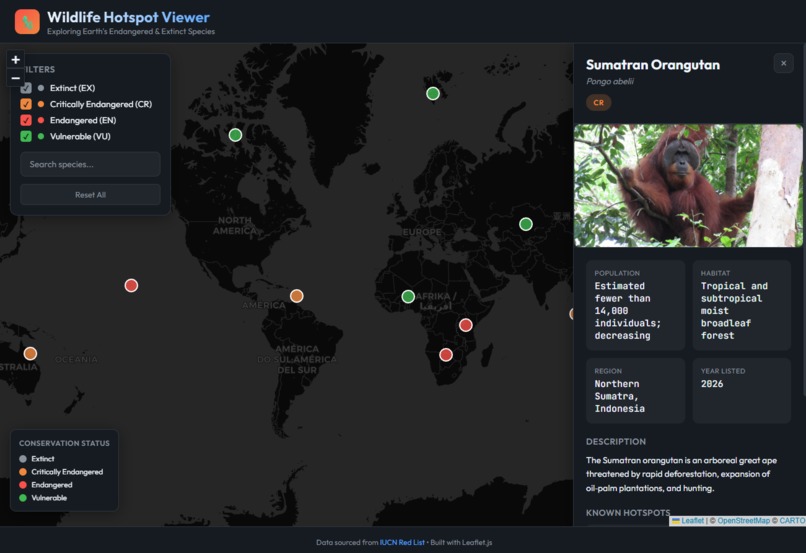
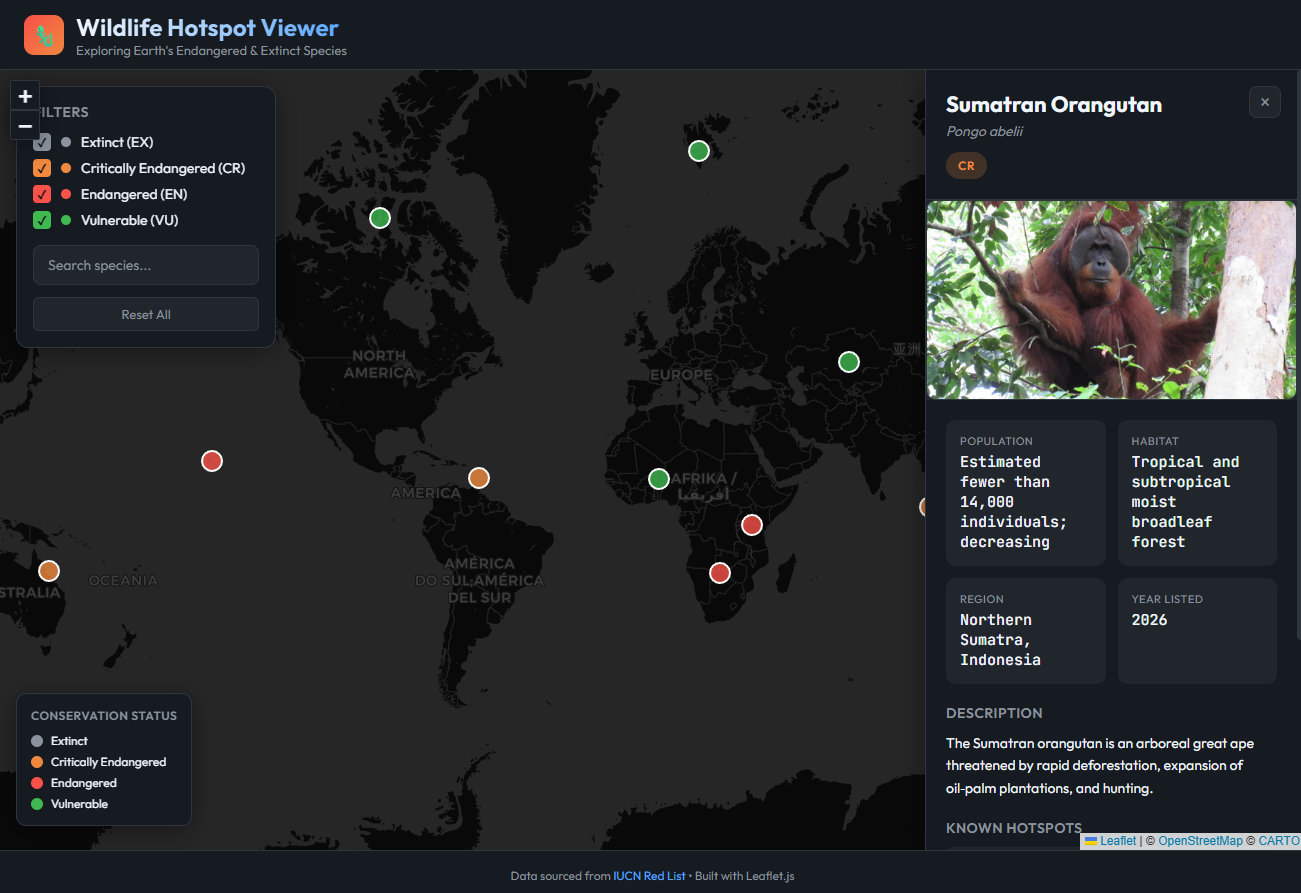
Interactive map with species details
Wildlife Hotspot Viewer
An interactive web application that visualizes endangered and extinct animal hotspots on a world map, serving as an educational and conservation awareness tool.
Inspiration
This project was inspired by the urgent need to raise awareness about endangered and extinct species worldwide. The team wanted to create an accessible, interactive tool that makes conservation data engaging and understandable to the general public, educators, and students. By visualizing the locations and stories of threatened species on an interactive map, the project aims to foster empathy and understanding about the biodiversity crisis.
What It Does
Wildlife Hotspot Viewer is an interactive web application that:
- Visualizes Conservation Data: Displays endangered and extinct species locations on a world map with color-coded markers based on their IUCN conservation status
- Educates Users: Provides detailed information about each species including population trends, habitat types, threats, and geographic distribution
- Enables Exploration: Allows users to filter species by conservation status, search by name, and explore specific locations where these animals are found
- Raises Awareness: Makes complex conservation data accessible and emotionally impactful through interactive visualization
Features
Interactive World Map
- Dark-themed Leaflet.js map with CartoDB Dark Matter tiles
- Color-coded markers representing different conservation statuses (EX, CR, EN, VU)
- Marker clustering for dense population areas
- Click markers to view detailed species information
Species Database
- Comprehensive dataset of endangered and extinct species including:
- African Elephant (Vulnerable)
- Polar Bear (Vulnerable)
- Green Sea Turtle (Endangered)
- Javan Rhinoceros (Critically Endangered)
- Sumatran Orangutan (Critically Endangered)
- West African Giraffe (Vulnerable)
- Hawksbill Turtle (Critically Endangered)
- Saiga Antelope (Critically Endangered)
Filtering and Search
- Filter by conservation status (Extinct, Critically Endangered, Endangered, Vulnerable)
- Search by species name or scientific name
- Real-time filtering with visual updates
- Reset functionality to clear all filters
Detailed Information Panel
- Comprehensive species profiles with:
- Population estimates and trends
- Habitat types and geographic regions
- Scientific names and conservation status
- Detailed descriptions and threats
- Multiple location coordinates with names
User Interface
- Dark theme with accessibility-focused design
- Responsive layout that adapts to desktop, tablet, and mobile devices
- Floating legend for conservation status color coding
- Clean, modern interface using Outfit font family
Technology Stack
Frontend
- Framework: Next.js 16.1.6 with TypeScript
- UI Library: React 18
- Mapping: Leaflet.js with marker clustering plugin
- Styling: CSS-in-JS with dark theme color palette
Data Management
- Static JSON dataset with TypeScript interfaces
- Color-coded status system following IUCN Red List categories
- Geographic coordinates for precise hotspot mapping
Performance Features
- Dynamic imports for map components to optimize loading
- Marker clustering for better performance with multiple species
- Real-time filtering with memoization for smooth user experience
- Responsive design with mobile-first approach
Installation
Clone the repository:
git clone <repository-url>
cd wildlife-hotspot-viewer
Install dependencies:
npm install
# or
pnpm install
Start the development server:
npm run dev
# or
pnpm dev
Open http://localhost:3000 in your browser
Usage
- Explore the Map: Pan and zoom to explore species locations worldwide
- Filter Species: Use the filter bar to show/hide species by conservation status
- Search: Type in the search box to find specific species by name
- View Details: Click on any marker to see detailed information about the species
- Reset: Use the reset button to clear all filters and search terms
Conservation Status Legend
- EX (Extinct): Gray markers - Species that no longer exist
- CR (Critically Endangered): Orange markers - Species facing extremely high risk of extinction
- EN (Endangered): Red markers - Species facing very high risk of extinction
- VU (Vulnerable): Green markers - Species facing high risk of extinction
Challenges We Ran Into
- SSR Compatibility: Leaflet.js requires browser APIs that aren't available during server-side rendering, requiring careful implementation of dynamic imports
- Performance Optimization: Managing multiple markers on a world map required implementing marker clustering and efficient filtering algorithms
- Data Accuracy: Ensuring conservation status information and population data was current and accurate from IUCN sources
- Mobile Responsiveness: Creating a seamless experience across desktop, tablet, and mobile devices with different interaction patterns
- Accessibility: Implementing proper color contrast, keyboard navigation, and screen reader support for the interactive map
Accomplishments We're Proud Of
- Complete IUCN Integration: Successfully implemented all four major conservation status categories (EX, CR, EN, VU) with accurate color coding
- Performance Optimization: Achieved smooth map interactions even with multiple species markers through effective clustering
- Educational Value: Created a tool that makes complex conservation data accessible and engaging for non-experts
- Code Quality: Maintained high TypeScript standards with comprehensive interfaces and type safety throughout
- Visual Design: Developed a cohesive dark theme that's both aesthetically pleasing and functional for data visualization
What We Learned
- Conservation Awareness: Deepened our understanding of the global biodiversity crisis and the specific challenges facing different species
- Modern Web Development: Mastered Next.js 16 features, TypeScript best practices, and performance optimization techniques
- Data Visualization: Learned effective ways to present complex scientific data in an accessible format
- User Experience: Gained insights into creating intuitive interfaces for data-heavy applications
- Accessibility: Understood the importance of making interactive applications accessible to all users
What's Next
Immediate Improvements
- Add more species to expand the dataset and geographic coverage
- Implement additional filtering options (habitat type, population range, region)
- Add timeline visualization for extinction trends over time
- Include conservation success stories and recovery programs
Future Enhancements
- Real-time Data Integration: Connect to live conservation databases for up-to-date information
- Educational Features: Add quizzes, interactive lessons, and teacher resources
- Community Features: Allow users to contribute observations and local conservation efforts
- Mobile App: Develop a native mobile application for field use by conservationists
- API Integration: Create an API for other organizations to integrate the data into their platforms
Long-term Vision
Transform this into a comprehensive conservation platform that not only educates but also connects users with conservation organizations, donation opportunities, and volunteer programs, creating a bridge between awareness and action in the fight against species extinction.
Contributing
We welcome contributions! Please feel free to submit a Pull Request.
License
This project is open source and available under the MIT License.
Contact
For questions, suggestions, or collaboration opportunities, please reach out through the project repository.
Acknowledgments
- IUCN Red List for conservation status data
- Leaflet.js for the mapping library
- Next.js team for the excellent framework
- All conservation organizations working tirelessly to protect endangered species
Built With
- inaturalist
- next.js
- react
- vercel

Log in or sign up for Devpost to join the conversation.