-
-
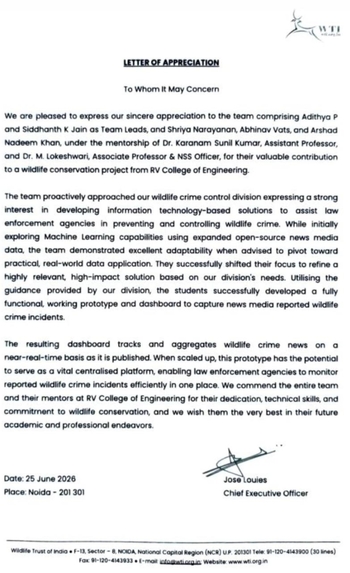
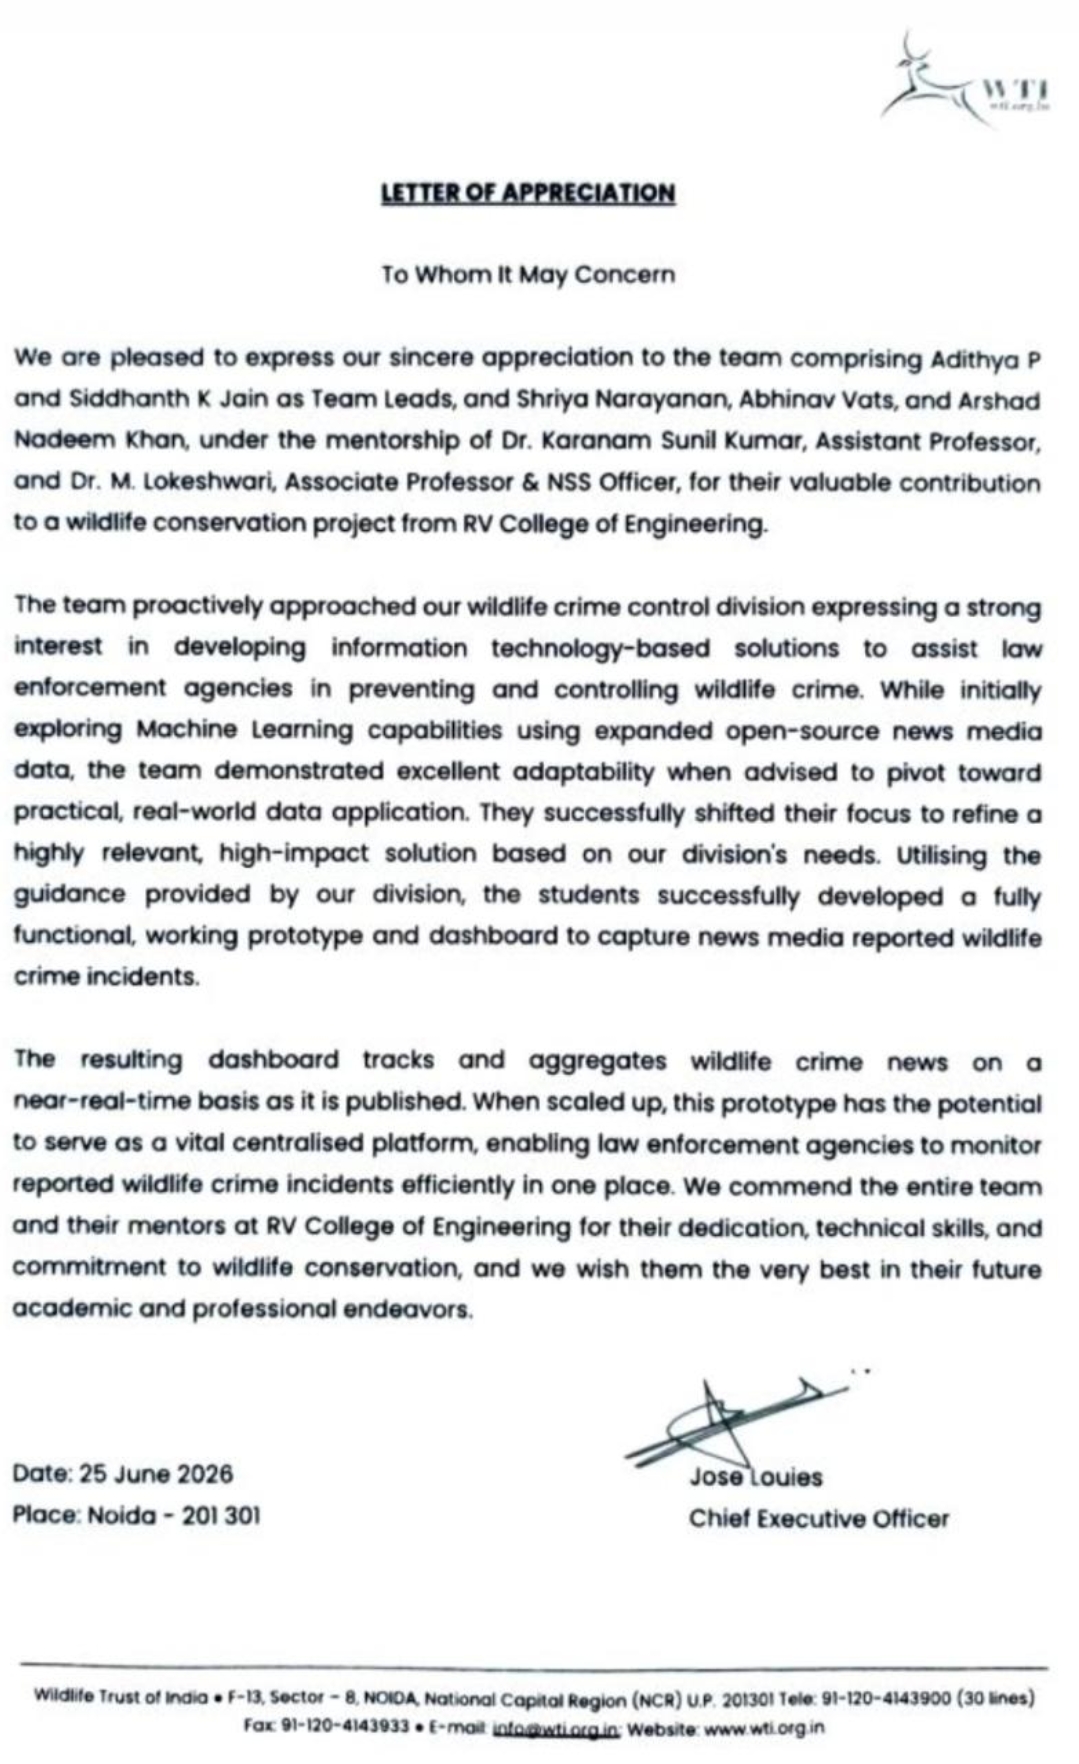
Appreciation Letter
-

-

Inspiration
Every wildlife crime report contains information that could help protect the next animal—but only if that information reaches the right people in time.
Reports of poaching, illegal wildlife trade, seizures, and trafficking are scattered across newspapers, regional publications, and multiple languages. An incident reported in one district may share a species, location, or person with another case hundreds of kilometres away. Finding those connections manually takes time that conservation teams cannot afford to lose.
We built WildGuard AI in collaboration with Wildlife Trust of India (WTI) to help turn scattered public information into a structured wildlife intelligence workspace.
Our central question was:
How can we help conservation teams move from reading isolated reports to understanding patterns and prioritising investigation?
Our collaboration with WTI grounds the project in a conservation purpose: supporting people working to protect wildlife with information they can search, inspect, and act on responsibly.
WildGuard AI brings together news monitoring, AI-assisted analysis, geographic visualisation, relationship exploration, and investigation support. Its purpose is to strengthen human decision-making and make useful information easier to find.
What it does
WildGuard AI collects publicly available wildlife-related reports and transforms them into searchable incident records, geographic insights, and reviewable intelligence.
1. Collects and organises wildlife crime reports
The collection pipeline supports configurable news providers and RSS feeds. It searches for relevant reports, extracts available article content, and processes information from multiple languages.
Each incident can include:
- Article title, publisher, source link, and publication date.
- Species mentioned.
- Suspected wildlife crime category.
- State and district.
- People mentioned in the source.
- Reported arrests, seizures, weapons, vehicles, quantities, and other operational details.
- AI-assisted summaries, confidence scores, and risk indicators.
Keeping the original source attached allows an analyst to verify the underlying report.
2. Reduces duplicate reporting
Several publishers may cover the same incident. Counting every article as a separate event can inflate statistics and create misleading hotspots.
WildGuard AI combines URL matching, title similarity, and semantic similarity to identify potential duplicates. Matched reports can be merged while preserving source information.
This helps answer two different questions:
How many incidents have we identified, and how many sources have reported them?
Multiple reports provide additional context, but they do not automatically establish that an allegation is true.
3. Provides a conservation control centre
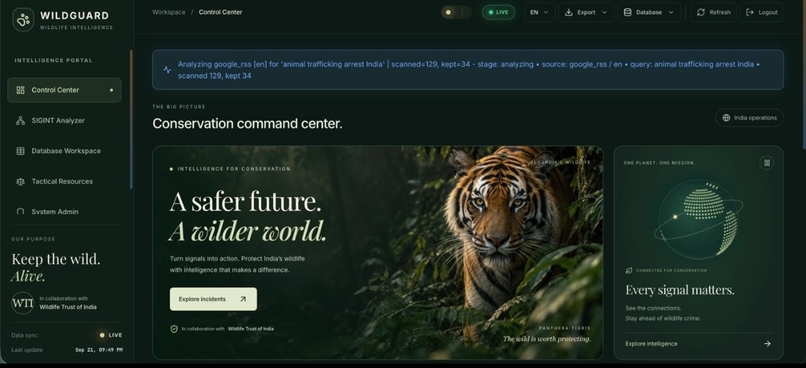
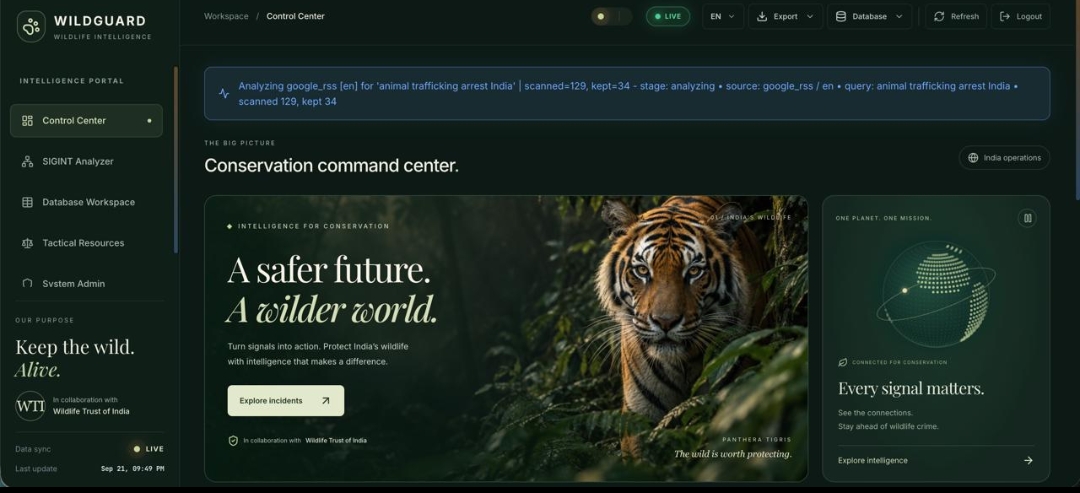
The dashboard brings together incident indicators, geographic views, and high-risk alerts.
Users can:
- Explore wildlife incident locations on a map.
- Review recent activity.
- Filter reports by relevant attributes.
- Open incident details and original sources.
- Follow updates without repeatedly reloading the page.
The interface uses wildlife imagery, forest-inspired colours, subtle animations, and a rotating 3D globe. Reduced-motion support helps keep the experience accessible.
4. Helps prioritise analyst attention
WildGuard AI assigns an explainable risk score using classification confidence, reported crime type, species, operational evidence, and potential network or repeat indicators.
A report involving a priority species, a seizure, and a possible cross-border connection can receive greater review priority than a vague report with little supporting detail.
The score is a triage aid—not a probability of guilt or proof that a crime occurred.
5. Supports relationship and network exploration
The investigation workspace connects incidents with people mentioned in reports.
Graph analysis helps analysts explore:
- Names appearing across multiple incident records.
- Groups of connected reports.
- People that connect otherwise separate parts of a graph.
- Patterns that may deserve closer examination.
These are reported associations requiring verification, not confirmed criminal networks. Similar names, incomplete articles, and extraction errors remain important review considerations.
6. Makes the database easier to search
WildGuard AI combines semantic relevance with exact keyword matching.
An analyst can search using a natural-language phrase such as:
“Reports involving pangolin trafficking and seizures”
They can also search for specific terms, species, or identifying phrases. This supports both broad exploration and focused retrieval.
7. Provides investigation support
The platform includes wildlife protection references, field procedures, AI-assisted complaint drafting, review notes, and export tools.
Available outputs include CSV, Excel, PDF dossiers, and briefing packs.
Legal references and generated drafts support preparation; they require verification against current law and the facts of the case before operational use.
8. Supports different conservation workflows
| User | Example use case | Intended benefit |
|---|---|---|
| Conservation analyst | Review reports across species and regions | Spend less time assembling scattered information |
| Forest department team | Examine reported activity in a district | Add context to locally verified intelligence |
| Wildlife investigator | Explore recurring names and connected reports | Identify leads for further investigation |
| WTI conservation team | Prepare source-linked incident summaries | Support internal review and coordination |
| Researcher | Examine patterns in collected reporting | Study trends while accounting for reporting bias |
| Administrator | Monitor collection, storage, and application health | Keep the workspace reliable |
These workflows can support conservation by improving information access, reducing duplicated research, and helping teams prioritise their limited attention. Demonstrating reductions in poaching will require field evaluation over time.
How we built it
System architecture
WildGuard AI follows a modular pipeline:
Public news sources and RSS feeds
                ↓
Collection and article extraction
                ↓
Normalisation and duplicate detection
                ↓
Classification, entity extraction, and scoring
                ↓
Structured incident database
                ↓
Search, graphs, maps, alerts, and reports
                ↓
Human review and conservation action
Frontend
We built the interface with React 18 and Vite.
The frontend uses:
- Leaflet for geographic visualisation.
- Chart.js for analytical charts.
- Lucide React for interface icons.
- Custom CSS and canvas animation for the conservation theme and rotating globe.
- WebSocket updates for live application events.
The workspace is organised into Control Center, SIGINT Analyzer, Database Workspace, Tactical Resources, and System Administration.
English, Hindi, and Kannada interface options complement the configurable multilingual collection pipeline.
Backend and storage
The backend uses Python, FastAPI, and Uvicorn.
Supporting technologies include:
- SQLAlchemy: database access and structured persistence.
- Alembic: database migrations.
- APScheduler: scheduled collection and background tasks.
- Pydantic settings: configuration management.
- BeautifulSoup and feedparser: article and feed processing.
- NetworkX: relationship graph analysis.
- Pandas and openpyxl: spreadsheet processing.
- ReportLab: PDF generation.
- JWT authentication: authenticated application access.
The Azure deployment uses SQLite with persistent application data stored outside the release directory. The architecture also includes PostgreSQL integration for future scaling.
The current single-process deployment keeps ownership of the scheduler and SQLite database straightforward.
AI-assisted analysis
The intelligence layer combines configurable NLP components, domain rules, and external model gateways.
The code supports:
- Multilingual classification.
- Optional SetFit classification.
- Optional GLiNER entity extraction.
- Sentence-transformer embeddings for semantic comparison.
- Structured analysis through an OpenAI-compatible model gateway.
- Rule-based signals for wildlife terminology and operational details.
The configured external gateway uses Groq with an openai/gpt-oss-20b model setting. Local transformer components are optional dependencies; their availability depends on deployment configuration and resources.
We designed the system to preserve useful source information and uncertainty instead of presenting every extracted field as a verified fact.
Classification confidence
The implemented confidence calculation starts with:
$$ C_0 = 0.55P + 0.30R + 0.15E $$
Where:
- (P) is the model’s poaching-related score.
- (R) is the rule-based relevance score.
- (E) is the evidence-strength score.
The system then applies contextual adjustments:
$$ C = \operatorname{clip}(C_0 + B - U,\;0,\;1) $$
Here, (B) represents supporting signals and (U) represents uncertainty or contradictory signals.
Examples from the implementation include:
- Keyword support: up to (0.06).
- Species mentions: (+0.03).
- Person mentions: (+0.03).
- Network indicator: (+0.03).
- Seizure signal: (+0.03).
- Cross-border signal: (+0.02).
- Penalties for non-wildlife content, false-positive patterns, unknown fields, and an unknown crime category.
Further analysis paths can apply source-credibility adjustments and additional relevance checks.
This is an engineered confidence score, not a statistically calibrated probability.
Incident risk scoring
The core risk calculation is:
$$ S = \operatorname{clip} \left( \operatorname{round} \left( 45C + 20P + B_c + B_s + B_n + B_o - U \right), 0,100 \right) $$
Where:
- (C): classification confidence.
- (P): poaching-related model score.
- (B_c): crime-category contribution.
- (B_s): species-priority contribution.
- (B_n): network and repeat contributions.
- (B_o): operational-detail contributions.
- (U): missing-information penalties.
Examples of implemented contributions include:
| Signal | Contribution |
|---|---|
| Rhino-horn trafficking category | +15 |
| Tiger-skin seizure category | +14 |
| Ivory-trade category | +13 |
| Priority species group, including tiger, rhino, elephant, and pangolin | +15 |
| Network indicator | +12 |
| Repeat indicator | +6 |
| Both arrest and seizure reported | +10 |
| Cross-border signal | +8 |
Additional contributions cover weapons, quantities, vehicles, case references, and other details. Missing information can reduce the score.
These weights make the prioritisation logic inspectable and adjustable. They will need evaluation against expert-reviewed cases before being treated as validated operational thresholds.
Duplicate detection
Duplicate detection combines:
- Canonical URL matching.
- Normalised title similarity.
- Semantic similarity.
- Supporting entity and incident context.
Default title and semantic thresholds are approximately (0.92) and (0.86), respectively. These are configurable matching thresholds, not accuracy measurements.
When embeddings are available, semantic comparison uses cosine similarity:
$$\text{sim}(\mathbf{a}, \mathbf{b}) = \frac{\mathbf{a} \cdot \mathbf{b}}{|\mathbf{a}| |\mathbf{b}|}$$
This helps identify reports that describe similar events using different wording. When embedding models are unavailable, the implementation provides a text-similarity fallback.
Hybrid search
Search combines semantic similarity with BM25 keyword relevance.
The implemented fusion is:
$$ H(q,d)= \frac{w_vV(q,d)+w_b\widehat{B}(q,d)} {w_v+w_b} $$
The default weights are:
$$ w_v=0.6,\qquad w_b=0.4 $$
Where:
- (V(q,d)) is semantic similarity.
- (\widehat{B}(q,d)) is the BM25 score normalised by the highest score in the candidate set.
BM25 is calculated using term frequency, document frequency, and document length:
$$ B(q,d)= \sum_{t\in q} \operatorname{IDF}(t) \frac{ f(t,d)(k_1+1) }{ f(t,d)+k_1\left(1-b+b\frac{|d|}{\operatorname{avgdl}}\right) } $$
The implementation uses (k_1=1.5) and (b=0.75).
Semantic matching helps with meaning; BM25 preserves the importance of exact terms. Batched embedding operations reduce repeated model work when ranking candidate records.
Relationship analysis
The graph engine represents reported relationships using nodes and edges, then examines connected components and betweenness centrality.
Conceptually, betweenness centrality measures how often a node lies on shortest paths between other nodes:
$$ C_B(v)= \begin{align*} (\sigma_{st}) \ (\sigma_{st}(v)) \end{align*} $$
Where:
- (\sigma_{st}) is the number of shortest paths between (s) and (t).
- (\sigma_{st}(v)) is the number passing through (v).
A high-centrality node may be useful for analyst review. It does not establish culpability or prove that the underlying reported relationships are correct.
Hotspot and trend indicators
The district-level hotspot heuristic combines average incident risk, recent reporting activity, network indicators, and report volume:
$$ H_d= \min\left( 100,\; \operatorname{round} \left( 0.4\bar{S} +0.3V +0.2N +0.3\min(30,T) \right) \right) $$
Where:
- (\bar{S}): average risk score.
- (V): percentage of records published within the previous 14 days.
- (N): percentage containing network indicators.
- (T): total records for the location.
The resulting categories are low, moderate, high, and critical.
Weekly forecasting uses exponential smoothing:
$$ E_t=0.3X_t+0.7E_{t-1} $$
A recent trend adjustment is added to estimate the next reported weekly count:
= $$\text{sim}(\mathbf{a}, \mathbf{b}) = \frac{\mathbf{a} \cdot \mathbf{b}}{\Vert{}\mathbf{a}\Vert{} \Vert{}\mathbf{b}\Vert{}}$$ $$
These outputs describe patterns in the collected reports. They are exploratory indicators, not validated forecasts of actual crime. News coverage, missing reports, and uneven geographic representation can affect the results.
Deployment and reliability
We deployed the application on Azure App Service in India South Central, with the React build served by FastAPI from the same application.
Engineering measures include:
- Persistent storage outside the deployment directory.
- Environment-based configuration.
- Authenticated access and rate limiting.
- Audit logging.
- Backup and restore tools.
- Component health checks.
- Backend regression tests and frontend build checks.
We also corrected a synchronization timeout bug: an active crawl should remain healthy while it reports progress. Timeout detection now measures inactivity rather than simply the time elapsed since the crawl began.
Challenges we ran into
Separating crime reports from general wildlife news
An article mentioning a tiger is not necessarily about poaching. Tourism, rescues, conservation announcements, and human–wildlife conflict can share vocabulary with crime reports.
We combined classification, domain rules, operational evidence, and uncertainty penalties to improve relevance screening.
Handling multilingual and incomplete reporting
Regional coverage can vary in spelling, terminology, detail, and structure. Some reports omit the species, precise location, or people involved.
We designed the pipeline to preserve unknown fields and reflect uncertainty in its scores.
Avoiding duplicate incident counts
Syndicated stories and rewritten headlines made simple title matching insufficient. Combining URLs, title similarity, semantic comparison, and contextual signals gave us a more flexible approach.
Balancing AI capability with cloud resources
Local models can consume substantial memory. We separated optional AI dependencies from the base application and supported external inference gateways so the core service could run within a modest hosting footprint.
Keeping long-running collection jobs reliable
Collection involves external websites, network delays, and model calls. A fixed timeout incorrectly classified a progressing crawl as stalled.
We traced the failure to its state-management logic and added regression tests covering active long-running crawls, genuine inactivity, and incident-driven progress.
Making intelligence understandable
Maps, scores, graphs, and extracted entities can overwhelm users when presented without context.
We organised the interface around practical workflows and retained source links, explanations, and review controls so users can inspect the information behind an output.
Accomplishments that we're proud of
- Built an integrated conservation workspace: collection, analysis, search, maps, graphs, reports, and administration work together.
- Centred the project on WTI collaboration: wildlife conservation remains the purpose behind the technical design.
- Made scoring inspectable: confidence and risk calculations use explicit signals and weights.
- Preserved human review: source links, review notes, and uncertainty remain part of the workflow.
- Combined semantic and keyword retrieval: users can explore concepts while retaining precise search terms.
- Created a distinctive wildlife interface: conservation imagery and thoughtful animation support the project’s identity.
- Delivered an Azure-hosted application: the project extends beyond a static demonstration.
- Added practical operational tools: diagnostics, backups, exports, and regression tests support continued development.
What we learned
Data quality matters as much as model choice
Incorrect locations, duplicated reports, and missing details can distort downstream analysis. Improving extraction and normalisation is essential to useful intelligence.
Different signals need different interpretations
Classification confidence, incident severity, search relevance, and graph centrality answer different questions. Presenting them as interchangeable “AI scores” would make the platform less useful.
Explainability helps people challenge the system
An analyst should be able to ask why a report received a high score, inspect the source, and disagree with the result. Transparent logic makes that possible.
Reliability is part of the product
A useful model cannot compensate for broken collection jobs or misleading health indicators. Deployment, monitoring, and state management are central engineering responsibilities.
Conservation impact requires field evaluation
A working dashboard demonstrates technical capability. Proving conservation value requires measuring how it changes real workflows and whether those changes help teams respond more effectively.
Our work with WTI gives that evaluation a clear conservation context.
What's next for WildGuard Ai
1. Evaluate the platform with conservation users
We want to work with WTI and other relevant users to test actual review workflows, refine terminology, and identify the information that is most useful in practice.
2. Build expert-reviewed evaluation datasets
We plan to evaluate:
- Wildlife-crime classification precision and recall.
- Species, location, and person extraction quality.
- Duplicate-detection performance.
- Search relevance.
- Analyst agreement with risk prioritisation.
- Time required to prepare an incident briefing.
These measurements will help distinguish promising features from proven improvements.
3. Improve regional-language coverage
We want stronger support for regional sources, spelling variation, transliteration, and language-specific terminology.
4. Strengthen evidence provenance
Future work includes clearer source histories, extraction timestamps, model-version tracking, and review trails so users can understand how each record developed.
5. Scale the infrastructure
As usage grows, we plan to evaluate PostgreSQL, durable background-job queues, shared caching, and independently scalable workers.
6. Improve graph identity resolution
We want better handling of similar names and ambiguous identities, with explicit analyst confirmation before merging people across cases.
7. Validate hotspot indicators
We plan to test geographic and temporal indicators against reviewed historical data and assess how reporting bias affects their usefulness.
8. Develop field-friendly workflows
Future iterations could include mobile-focused review, low-bandwidth access, and carefully controlled alert delivery for authorised teams.
9. Measure practical conservation value
Our long-term evaluation should go beyond the number of articles collected. We want to understand whether WildGuard AI helps users find relevant information sooner, reduce duplicated work, and prepare better-supported investigations.
WildGuard AI’s mission is to help conservation teams turn public information into timely, reviewable intelligence that supports wildlife protection.
Built by Siddhanth K Jain, Kamma Rohan, Adithya P, Dinesh Kulkarni, and Rajath V Shanbhogue, in collaboration with Wildlife Trust of India (WTI).
Built With
- ai
- analysis
- data
- docker
- face
- fastapi
- geospatial
- hugging
- javascript
- learning
- mdeberta-v3
- multilingual
- named
- natural
- natural-language-processing
- news
- processing
- python
- react
- recognition
- rest
- semantic
- sentence
- transformers


Log in or sign up for Devpost to join the conversation.