Introduction
When large wildfires occur in California, firefighters make front page news. But do city residents remember these fires when voting on local funding measures for fire departments? Do other factors, such as labor force or party affiliation, play a role in certain cities’ recalcitrance towards funding fire departments? For cities hoping to increase funding for these services, what factors predict a successful ballot measure?
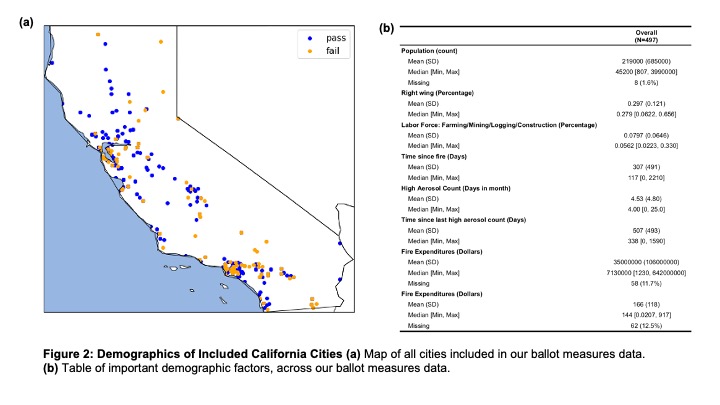
Two specific Californian cities illustrates the complexity of the issue. In Modesto, which is located in the Central Valley, all ballot measures for raising more money for general essential services such as fire have failed. Each citizen in Modesto pays below the average rate for fire services ($119 per capita in Modesto as compared to an average of $166 in our entire data set), and Modesto is also more right-leaning than the average city included in our data set. City managers in Modesto have spoken out in support of these ballot measures to no avail. They face opposition from a particularly vocal Stanislaus Taxpayers Association, whose goal is to “ensure a community’s taxes are necessary and are spent wisely.” Other cities have opted for a different path. The La Habra Heights suburb of Los Angeles provides its own fire and emergency medical services, instead of relying on the Los Angeles County Fire Department. The city has revisited relying on the county for fire protection, but usually the fire protection proposals from the county are too costly. Since 2005, the La Habra Heights fire tax has grown slightly; however, voters have continuously approved measures to extend it. La Habra Heights voters are just under 20% more right-leaning and pay more for fire services ($169 per capita) than Modesto residents.
Here, we sought to understand the importance and influence of several factors towards the outcome of city ballot measures related to funding fire protection services. Using a variety of regression models, we analyze these data and identify a couple of key factors that predict ballot outcomes with surprisingly high accuracy. We hope these findings will inform various stakeholders interested in funding fire and other related ballot measures.
Factors influencing ballot outcomes
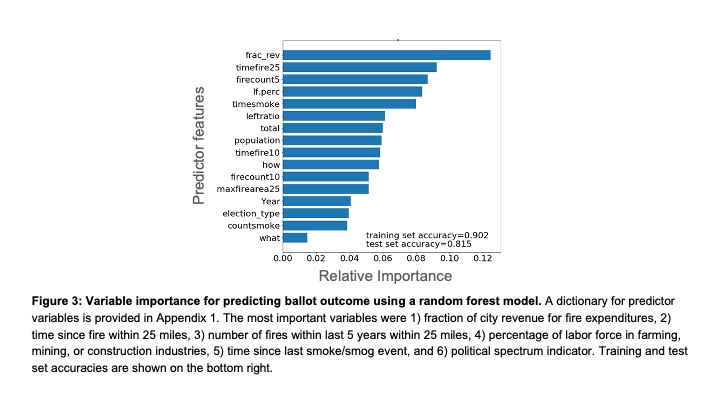
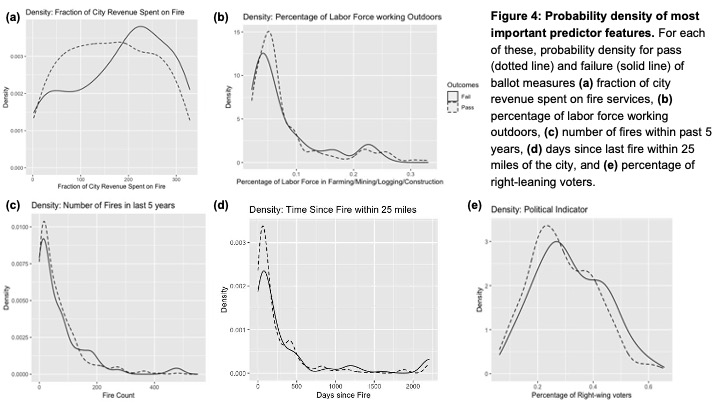
We analyzed which factors were most salient in predicting the outcome of local ballot measures related to funding fire departments using a random forest classifier. Of the 15 variables we studied across different subsets of our data, five variables were consistently ranked highest (see Fig. 3) by the model: a) number of fires within the past 5 years, b) percentage of the labor force in rural employment, c) number of days since the last fire within 25 miles of the city, d) political spectrum measures, and e) fraction of revenue spent on fire protection. An assessment of these factors is explained below, and distributions for each are shown in Fig. 4.
a) Number of fires within last 5 years
Areas with ballots that passed had experienced a median of 42 fires over the last 5 years, while areas with ballots that failed had a median of 35 fires. This corresponds to an increase of 20% more fires in areas with ballots that passed, suggesting that fire history, specifically frequency, affects ballot outcomes. The fact that the number of fires over the last 10 years was not as significant a predictor variable in our random forest model suggests that recent fire history, specifically the previous 5 years, is more important.
b) Percentage of labor force in working outdoors
Areas with ballots that passed had higher employment in outdoor sectors than in areas that failed. However, this may be correlated with areas that experience more fires, and needs further investigation.
c) Time since last fire
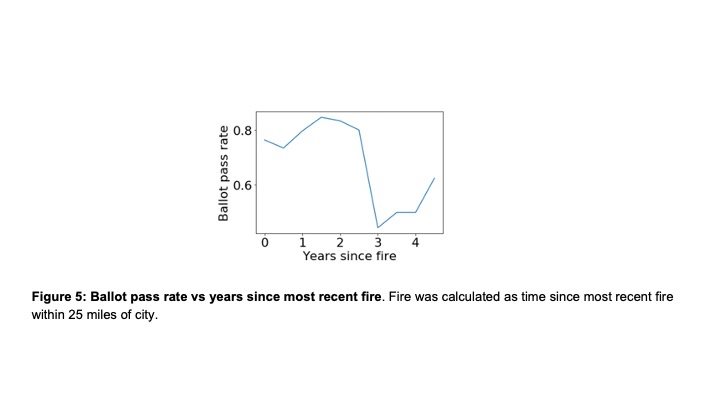
The time since last fire was found to be one of the statistically significant predictors for the ballot outcome predictive model. Cities where ballots were passed had a fire more recently by nearly 2 weeks compared to areas where ballots did not pass. We further explored this relationship by plotting the ballot pass rate as a function of time since last fire in Fig. 5. Here, we found that the ballot pass rate appears to drop significantly after approximately 3 years. This suggests that there may be a 2-year window of opportunity after a fire during which fire related ballots are more likely to pass.
d) Political ideology
Areas with ballots that passed were in more left-leaning cities, as quantified by the ratio of party registrations. On average, there was a 16% higher ratio of left to right party affiliation in areas where ballots passed compared to those which failed. This supports previous studies which have found that political ideology affects the impact of local wildfire on climate related political behaviors [1].
e) Fraction of revenue spent on fire
Locations where the amount spent on fire was a lower fraction of the budget were more likely to pass. This suggests that either less expensive ballot measures, areas with larger budgets, or some combination of the two.
Model Development
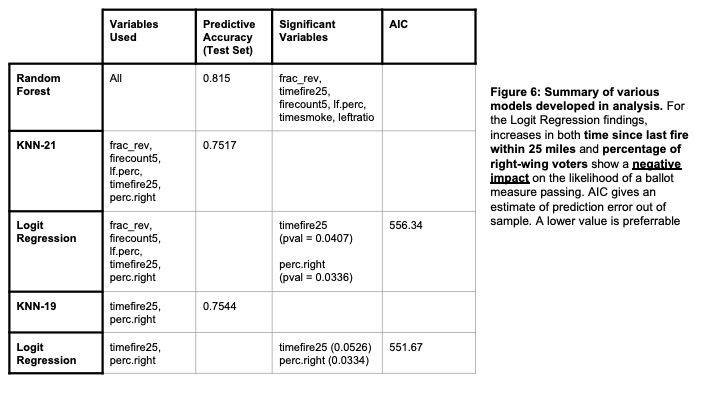
To assess the most important factors in a predictive model for ballot outcomes, we created a random forest model with the features listed in Appendix 1. Use of a random forest is appropriate in this context because it is flexible to account for the likely complex and non-linear effects of various factors on voting outcomes, yet provides easily interpretable variable importance rankings. Futhermore, these models are not sensitive to correlations between input features. The predictor features used here spanned fire history, demographic, and economic factors. Categorical data were transformed to numerical features and put into the classification model. The model was created using the scikit-learn python library and hyperparameters were tuned using a randomized grid search model, which optimized the test set accuracy using 3-fold cross validation. The purpose of this was not to build the best model for the training set, but rather to a) identify the features with the most pertinent information influencing ballot outcomes and b) to assess the potential predictive skill of a generalizable model. Accordingly, we assessed the accuracy of the classifier (as calculated by (true positives + true negatives) / total number of samples) on an out of sample test set. For this model, an 80-20 train-test split was used. Among various types of models as described further below, we achieved a relatively high accuracy on the test sets of 0.7-0.8.
We utilized the 5 most salient factors found from our random forest classifier in a K-Nearest Neighbors model to further check the predictive accuracy of this subset. We chose to use the variable representing the percentage of right-wing voters in lieu of the ratio of left-wing and right-wing voters due to the higher separation apparent in the probability density for this variable. The correlation between these two variables is very high (82%) and they communicate very similar information.
We first selected the value of K for our KNN model through 3-fold cross-validation. The cross-validated accuracy was highest at the value of K=21, so we chose to utilize this for our model. We ran 1000 iterations of randomly selecting observations for an 80-20 train-test split, building and testing a KNN-21 model on these partitions in each iteration. When taking the average of our predictive accuracy, we found that the KNN-21 model using the 5 variables chosen from our Random Forest model had predictive accuracy (on test set) of 75.17%.
We then looked at results from a multiple binomial regression model that used these 5 predictors (fraction of revenue spent on fire protection, number of fires within the past 5 years, percentage of the labor force in rural employment, number of days since the last fire within 25 miles of the city, and percentage of right-wing voters) as independent variables, and the outcome (pass/fail) as our dependent variable. Our results indicated that the number of days since the last fire within 25 miles of the city and the percentage of right-wing voters were significant variables, and both had a negative impact on the outcome of a ballot measure.
To further test the tradeoff between predictive skill and potential overfitting, we decided to run robustness checks utilizing only the two significant variables found from our binomial regression. We again utilized KNN, where a value of K=19 was selected from 3-fold cross validation. In the same fashion as our previous model, we found that our KNN-19 model that utilized the number of days since the last fire within 25 miles of the city, and percentage of right-wing voters as independent variables had an average predictive accuracy of 75.44%. We then created a multiple binomial model, as before, using only the significant variables from our previous regression. Our results were similar to that from our previous binomial regression, with both predictors found to be fairly significant, and both showing a negative impact on ballot measure outcome.
Data sources
Ballot Measures
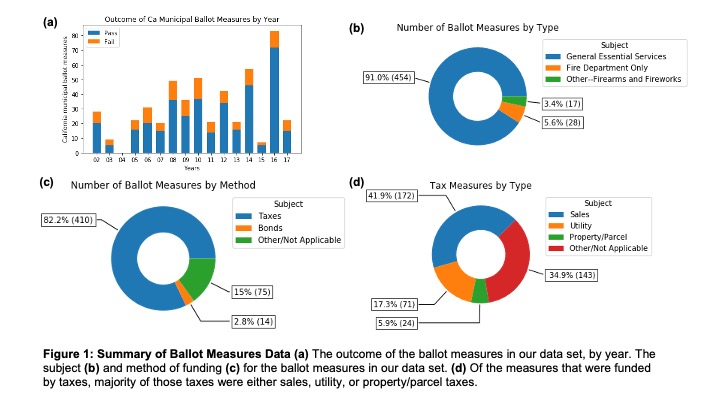
We analyzed 499 ballot measures from 239 Californian cities between the years of 2002 and 2017 that contained the word “fire” [2]. Of these 499 ballot measures, general essential services were the subject of 91.0% (454 measures) [3], fire departments alone were the subject of 5.6% (28 measures) [4], and firearms/fireworks were the subject of the remaining 3.4% (17 measures) [5]. On average, 72.3% of all ballot measures passed, although this does vary across years with the lowest percentage in 2003 (55.5% of 9 ballots) and the highest percentage in 2016 (86.7% of 83 ballots).
We further classified ballot measures by the method by which they financed the proposed action, if applicable [6]. Of the 499 measures, 82.2% (410 measures) used taxes and 2.8% (14 measures) used bonds to finance the proposed project. There were over 20 different types of taxes used across the 410 tax-specific ballot measures. Of these, the three most common tax types were sales (41.9% of the tax measures, 172 measures), utility (17.3% of the tax measures, 71 measures), and property/parcel taxes (5.9% of the tax measures, 24 measures). Together, these three taxes account for 53.5% of all ballot measures analyzed and 65.1% of the tax ballot measures.
Fire and Smoke Data
We used fire maps from CalFire’s (egis.CALFIRE) California Fire Perimeter 2019 dataset to extract various metrics to determine the city’s fire exposure and experience. These data were merged with ballot date and city boundaries from the State Board of Equalization's tax rate area maps. Specifically, we extracted the time since fires within 10 and 25 miles of the city limits, the largest fire areas for fires within 25 miles, and the number of fires within the last 5 and 10 years within 25 miles. To measure smoke exposure, we used the aerosol optical depth (AOD) measurements from the Moderate Resolution Imaging Spectrometer, specifically the MOD08_M3 monthly dataset. To define a smoke day, we set a threshold based on the 90th percentile of all 0.55 μm AOD data, which corresponded to a value of ~0.95. We then counted the number of days the city experienced an AOD value above this threshold within the last 3 years of the ballot measure, as well as the number of days since the last smoke event [7].
For each ballot measure, we included data on the city’s total and per capita fire expenditures for that year [8] and data on the composition of local fire departments in the city. On the composition of local fire departments, we included data about the type (ie volunteer versus paid) and, if paid, the average salary of a firefighter.
Demographic Data
In addition to population, we also determined the percentage of the labor force in rural employment [9]. We defined rural employment as the average number of people working in farming, mining, logging, and construction sectors for each year.
Using the data available from the California Secretary of State, we classified the election type for each ballot measure and used that year’s voter registration data for each city. Left-leaning voters are registered with the Democrat or Green parties, while right-leaning voters are registered as Republican, American Independent or Libertairan parties. While Libertarians are socially liberal, they tend to be fiscally conservative. Because we are analyzing fiscal ballot measures, we assumed they aligned more with other right-leaning parties.
Challenges we ran into
By and large, the biggest challenge of our project was cleaning the data. While many sources publish data on these measures, it is often stored in different locations and conventions for publishing the data have changed over time.
Accomplishments that we're proud of
No one on this team had worked with any of this data before. We worked hard to boil down many of these competing factors into simple metrics. To get the data, we learned new ArcGIS and Python skills, and employed natural language processing techniques for the first time.
What's next for Wildfires, economics, and cities ballot measures
We would like to thank Dr. Iris Hui for proposing this project. We look forward to continuing to work with her. Beyond academic audiences, we hope our data and analysis can be useful to Californian policy makers at the local and state level.
- [1] https://papers.ssrn.com/sol3/papers.cfm?abstract_id=3452958
- [2] We received no data for the 2004 year.
- [3] For example, “To maintain essential city services, including rapid 911 emergency response, fire/police protection, add paramedic services, keep fire stations open/staffed, address homelessness, repair local streets/potholes, improve rapid response to assault, burglaries/crimes, keep public areas safe/clean, maintain senior services, attract/retain jobs/business, increase water conservation; shall the City of Palm Springs establish a 1/2 cent sales tax; requiring annual independent audits/public oversight; all funds used locally?”
- [4] For example, “Shall the General Plan of the City of Poway be amended to allow fire stations on property having a natural slope in excess of ten percent?”
- [5] For example, “Shall Ordinance No. 570-01 Repealing the sale, use or possession of safe and sane fireworks be adopted?”
- [6] For example, the ballot measures in (7) and (8) do not require money or funds.
- [7] Other factors, such as smog or pollution could also contribute to high aerosol counts. We believe the 90th percentile is a good threshold for separating smoke aerosol caused by wildfires from these other factors.
- [8] For some years, data on city fire expenditure data could not be found. Those entries were left blank, which could decrease its priority in the random forest ranking. Because the per capita fire expenditure factor was still highly ranked, we are confident of its role in determining ballot measure outcomes.
- [9] For more information on community archetypes and their influence on wildfire preparedness, see https://www.fs.usda.gov/rmrs/science-spotlights/archetypes-wildland-urban-interface-communities-making-communities-fire-resilient
Appendix 1. Predictor variable name and descriptions
Ballot data
- Year - Year of ballot measure vote
- what - what is being funded
- how - type of funding source (e.g., sales tax, etc.)
- impact - if possible, describe whether this will increase or decrease funding
- election_type - general, primary, etc
Fire data
- timefire25 - days since last fire within 25 miles
- timefire10 - days since last fire within 10 miles
- maxfirearea25 - largest fire within last 5 years within 25 miles
- countsmoke - number of smoke (or smog) months in last 5 years
- timesmoke - days since last smoke event
- firecount5 - number of fires within 25 miles within last 5 years
- firecount10 - number of fires within 25 miles within last 10 years
Demographic data
- population
- leftratio - (python random forest implementation only) political spectrum indicator calculated as number of registered Democrats / number of registered Republicans, Libertarians, and American Independent Party members
- perc.right - (R model implementations only) political spectrum indicator calculated as number of registered Republicans, Libertarians, and American Independent Party members / total number of registered voters
- total - total number of registered voters
Economic data
- frac_rev - fraction of revenue that goes to fire expenses
- lf.perc - percentage of population working in farming, mining or construction


Log in or sign up for Devpost to join the conversation.