-
Final Presentation Poster
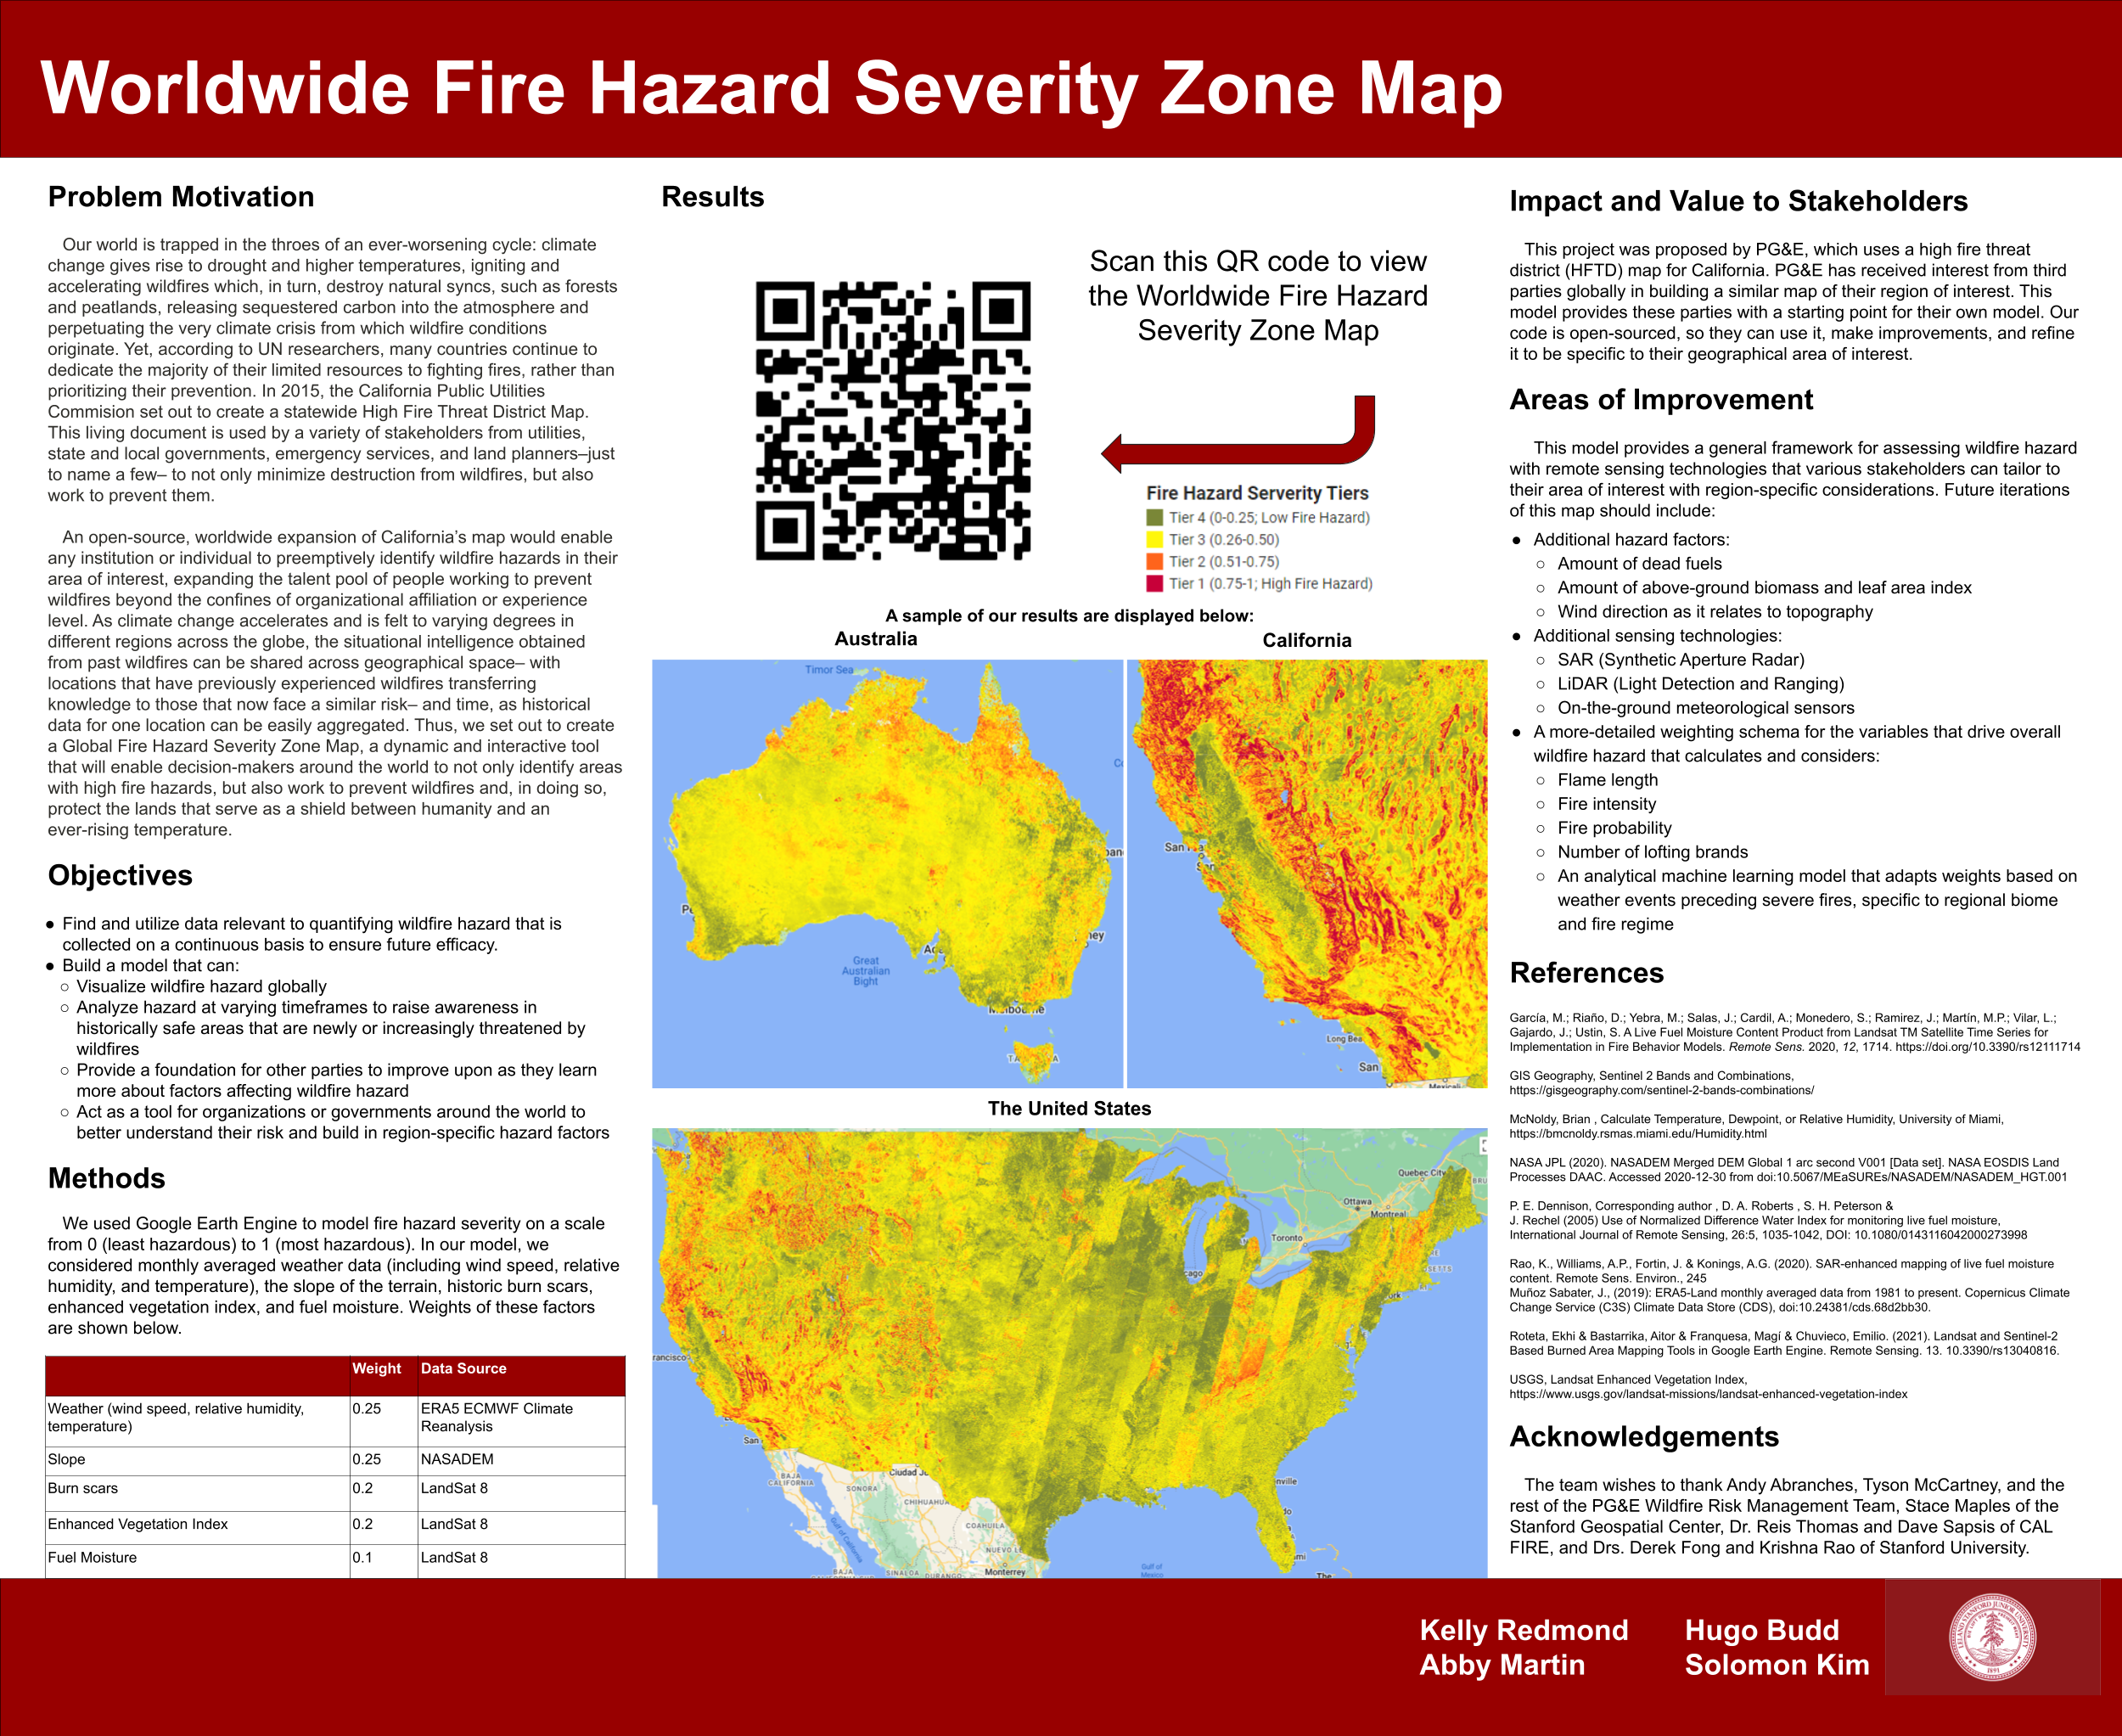
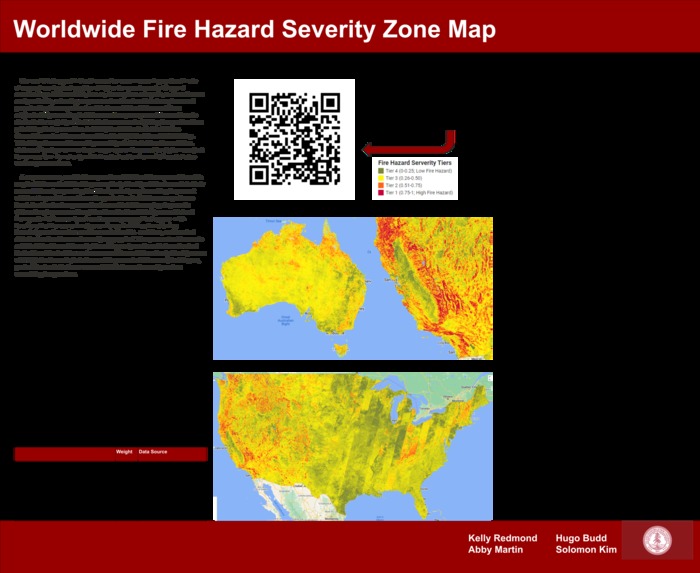
Inspiration
California has developed a statewide high fire threat district map. As the frequency and intensity of wildfires worsen with climate change, more U.S. states and countries around the world are interested in knowing their wildfire risk. Our project gives utilities, emergency service planners, and governments a starting model they can use to understand this risk. Our code is open-sourced, so ideally, local agencies would utilize our model and improve its accuracy by including local risk factors.
What it does
It uses satellite data to evaluate fire risk around the world. Data used to evaluate risk includes temperature, relative humidity, wind speed, fire burns, land slope, fuel or vegetation moisture, and vegetation quantity. These factors are weighted individually and used to calculate fire hazard on a scale from 0 (least hazardous) to 1 (most hazardous).
How we built it
We used Google Earth Engine Code to manipulate satellite data to find the fire hazard index and map this value globally.
Challenges we ran into
It is hard to accurately map fire risk on a global basis. We had to realize that a global map will not be as accurate as possible. Our map tries to provide a solid foundation that local agencies can use and build on by implementing local risk factors. Therefore, instead of trying to provide a perfect map, we refocused our efforts to make the code an easy pick-up point for local interested agencies.
What's next for Evaluating Wildfire Risk on a Global Basis
Ideally, the weighting of factors considered (weather, slope, vegetation, etc.) would be determined via machine learning or evaluating what conditions precede severe wildfires. Additionally, more factors could be considered such as wind direction, dead fuels, and above-ground biomass.
Built With
- google-earth-engine-code

Log in or sign up for Devpost to join the conversation.