-
-
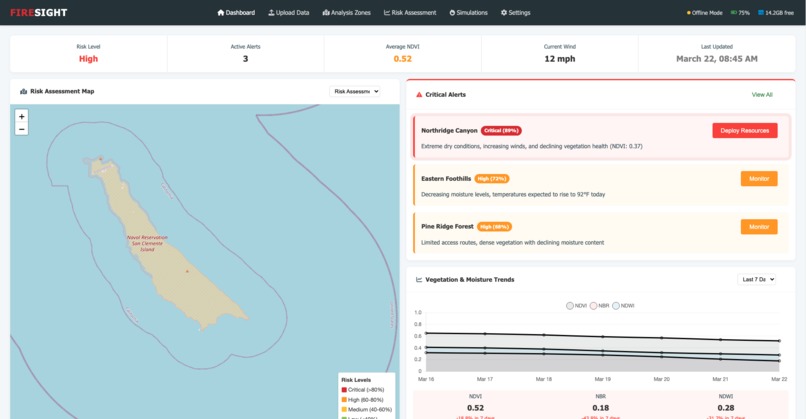
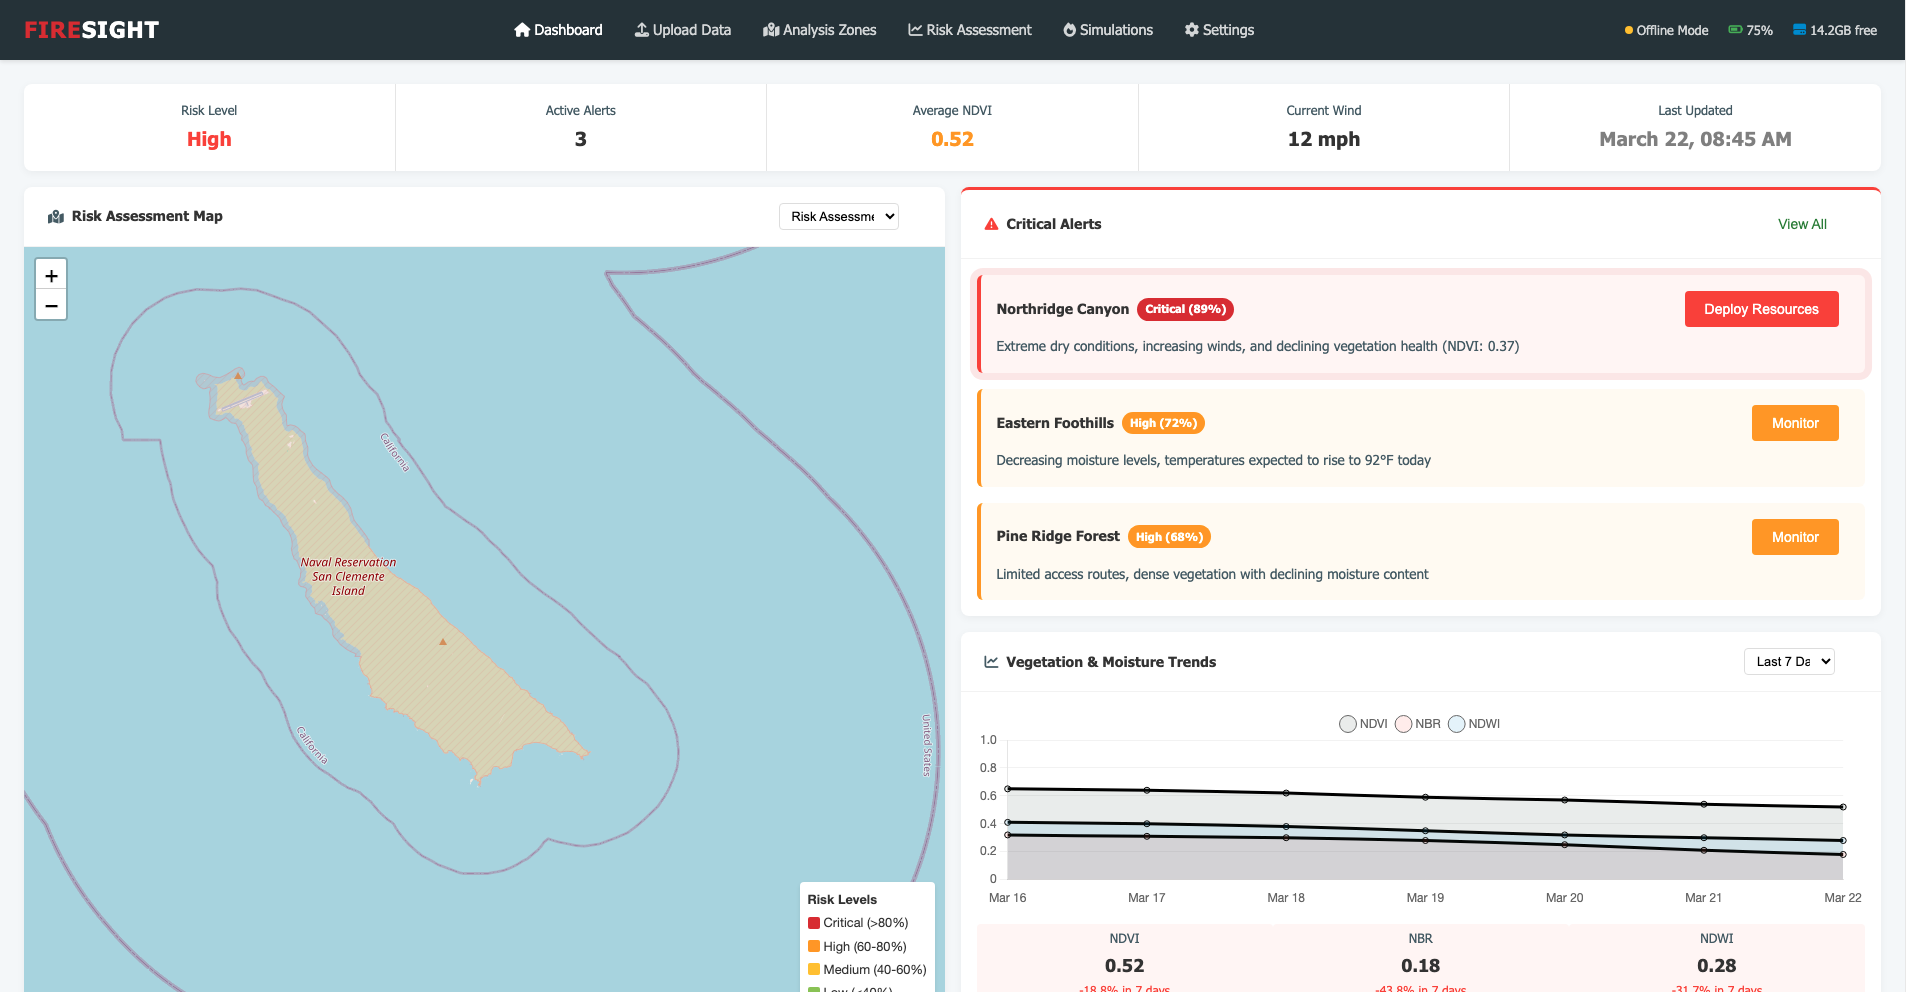
Home Screen
-
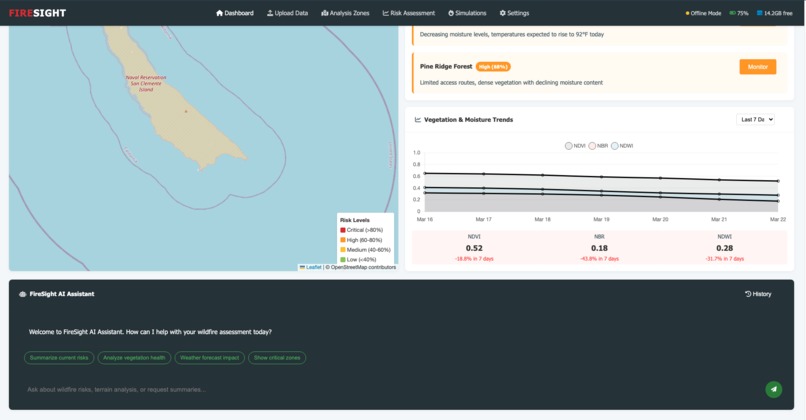
Chatbot
-
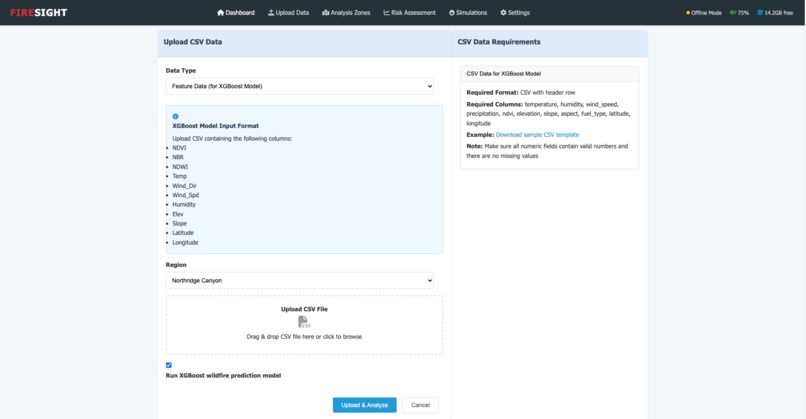
Upload

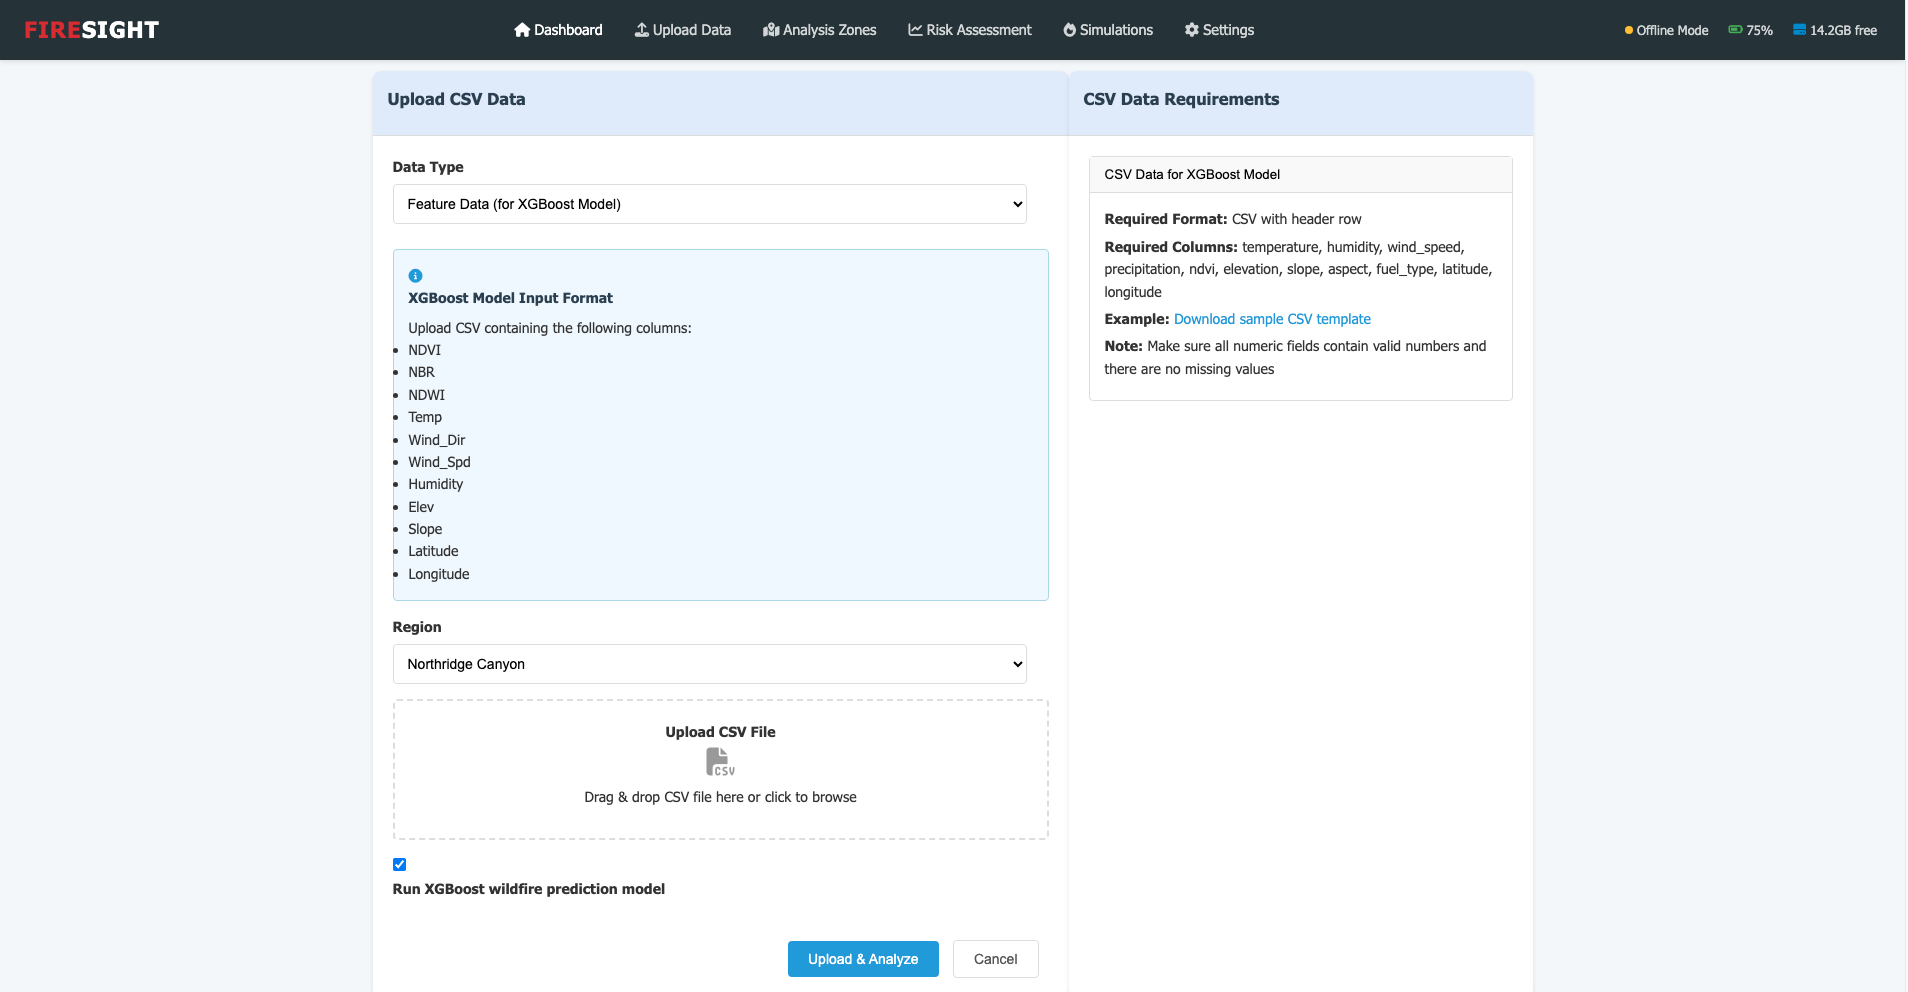
🔥 FireSight: Offline Wildfire Risk Analysis
🚀 Inspiration
Wildfires are growing in both frequency and severity, threatening lives, ecosystems, and infrastructure worldwide. Early detection and localized risk awareness are key to mitigating damage, but most predictive systems rely heavily on cloud-based processing—often inaccessible in remote or emergency scenarios.
We were inspired to build FireSight: a lightweight, intelligent wildfire risk assessment system that runs offline and can be deployed on devices like a Raspberry Pi. The goal is to empower responders, researchers, and field teams with actionable insights using only satellite data and a CSV file.
🔍 What It Does
- Ingests a CSV dataset containing environmental and spectral features from satellite imagery.
- Runs wildfire predictions using a trained XGBoost model, identifying zones with high fire risk.
- Generates statistical summaries of vegetation health and fire-prone areas.
- Includes an AI-powered chatbot, allowing users to ask questions like:
- “Which zones are at highest risk?”
- “What’s the average vegetation index in this area?”
- “What happens if wind shifts to the north?”
🛠️ How We Built It
- Data Collection: Extracted environmental and spectral features using Google Earth Engine and labeled real fire events using MODIS fire data from NASA FIRMS.
- Preprocessing: A Python script cleaned, engineered, and merged data into a unified dataset.
- Modeling: Trained an XGBoost classifier to identify fire-prone locations based on vegetation, weather, and terrain.
- Web App: Built a lightweight Flask dashboard for predictions and analysis.
- GenAI Integration: Connected an open-source LLM (GPT4All) for offline summarization and decision support.
📊 Data Sources & Pipeline
1. Feature Dataset (from GEE)
- Sources:
- Sentinel-2 (NDVI, NBR, NDWI)
- ERA5-Land (Temperature, Wind Speed/Direction, Humidity)
- SRTM DEM (Elevation & Slope)
- Sentinel-2 (NDVI, NBR, NDWI)
- Resolution: 30 meters
- Time Period: May–September (2023 & 2024)
- Samples: 10,000+ points per season
- Format: CSV with coordinates + features
2. MODIS Fire Labels (Ground Truth)
- Source: NASA FIRMS MODIS C6.1 archive
- Fields Used: Latitude, Longitude, Brightness, Confidence
- Labeling Logic:
Fire_Label = 1if within ~1 km of a fire point
3. Final Dataset
- Features:
Lat,Lon,NDVI,NBR,NDWI,Temp,Wind_Dir,Wind_Spd,Humidity,Elev,Slope - Label:
Fire_Label(1 = fire nearby, 0 = no fire)
🎯 Accomplishments We’re Proud Of
- Built an end-to-end ML pipeline using real satellite data
- Achieved 98% model accuracy using XGBoost
- Integrated a GenAI chatbot with spatial data understanding
- Developed a functional web app capable of local predictions and summarization
💡 What We Learned
- Using remote sensing data for real-world ML applications
- Merging geospatial sources (MODIS, Sentinel-2, ERA5) effectively
- Building deployable web apps with Flask and LLMs
- Importance of spatial labeling and preprocessing quality
🚀 What’s Next for FireSight
- Deploy on Raspberry Pi for offline, edge wildfire analysis
- Add real-time weather forecasts for dynamic predictions
- Integrate satellite pass schedules for timed scans
- Enable voice-based interface for field operatives
- Expand region support and release as open-source


Log in or sign up for Devpost to join the conversation.