-
-
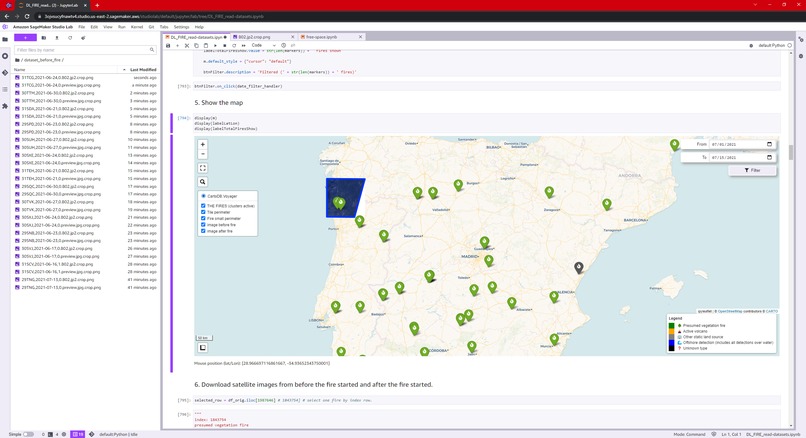
Interactive map
-

Creating dataset. Find and crop pre-fire images.
-

Interactive map, detail
-

Dataset to train Visual Transformer (images before fire and no pre-fire images
-

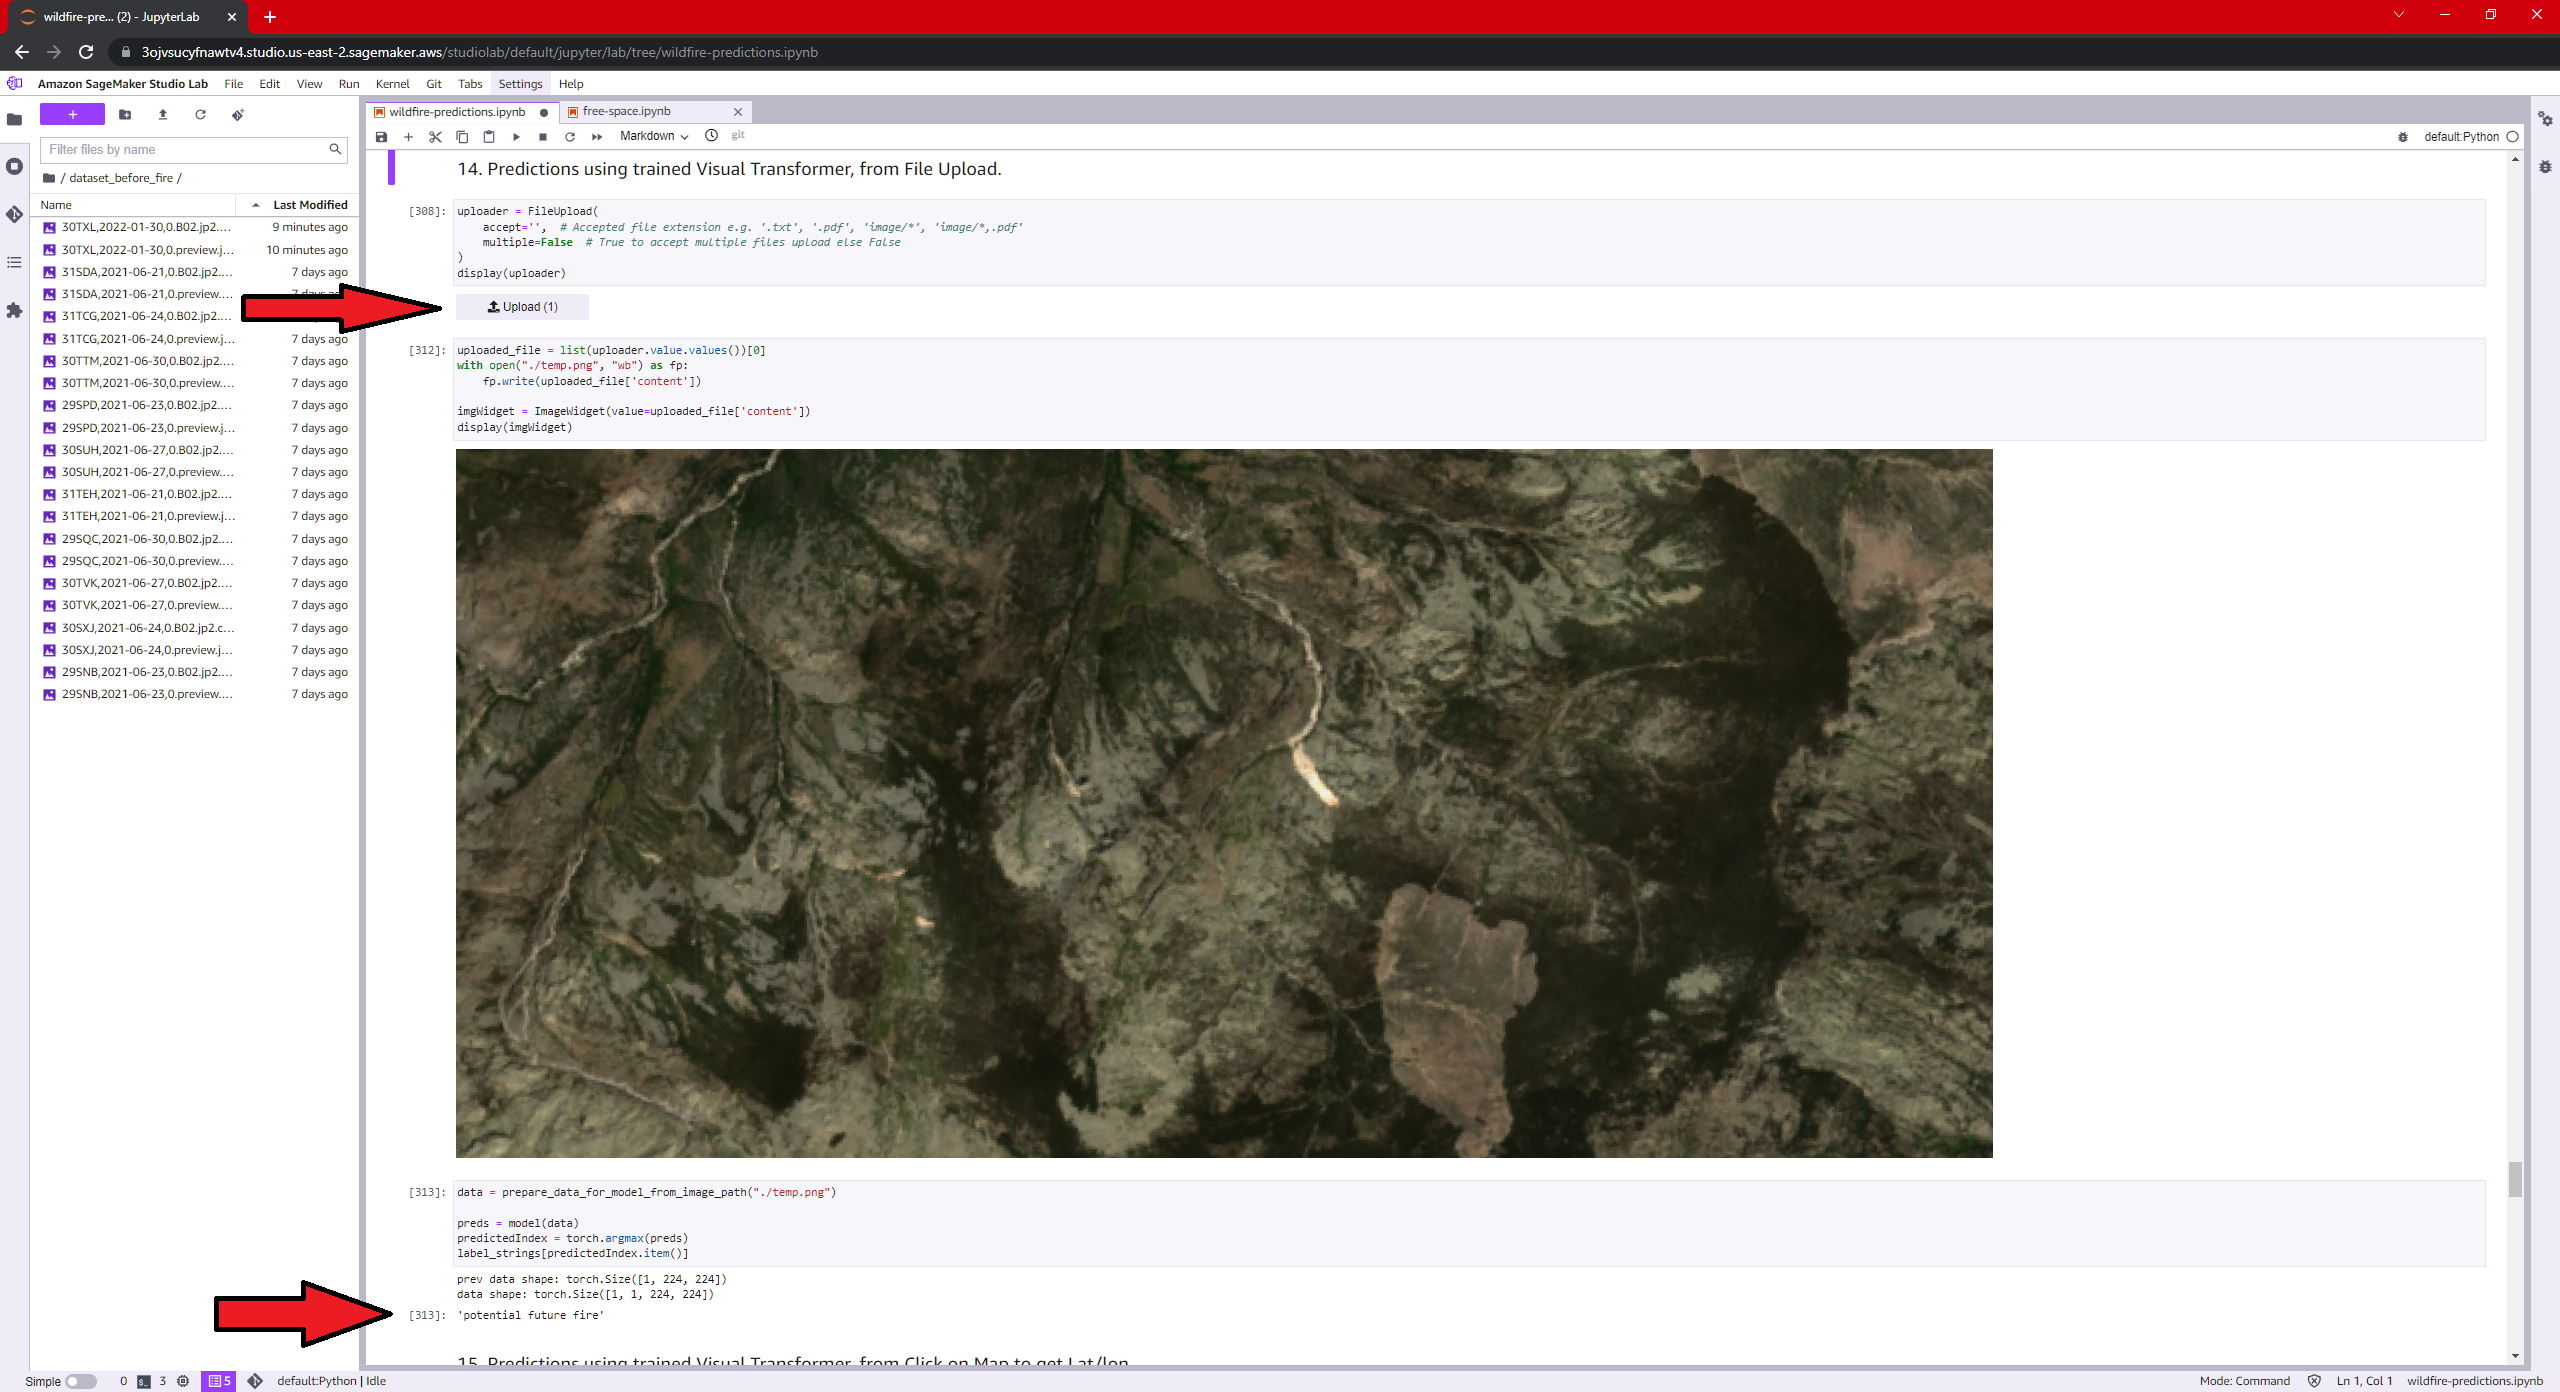
Prediction wit Visual Transformer and upload file widget.


Inspiration
Many forest fires happen around the world. There are many investigations to detect fires in satellite images (using colors, temperature changes, vegetation changes, etc...).
But since we have a history of satellite images, I have thought to use the images prior to the start of the fire, to try to predict in which places a fire is most likely to start.
What it does and How we built it
First I use the NASA fire database. Contains tens of millions of fire records (with date, latitude and longitude) and an accuracy of 300-500 meters.
I have ruled out Sentinel-3 as a source of fires because, although it has sensors to detect fires, its accuracy is very low (1km).
Then I use Sentinel-2 to get satellite images of the points where there was a fire. I download them from AWS Open Data. I have automated the system to download images dated just before the fire starts.
Then, since the downloaded image is large, I do an automatic crop to get the piece of the fire.
Next, in an interactive map inside Jupyter notebook, I represent:
- The points of the fires.
- I superimpose the image downloaded from the satellite, in the area of 1 fire.
- I superimpose the bound of the selected fire.
- In addition, I have implemented a date range selector, to only show on the map the fires between "start date" and "end date".
I have used Leaflet and HTML Widgets to implement the interactive map.
Finally, a Vision Transformers type neural network should be trained with the cropped images of areas that will be burned in the future. This network will then be able to detect which areas are most likely to experience fires, so that disaster response teams are prepared and do work to prevent large fires.
Challenges we ran into
It is one of the most complicated hackathons I have ever worked on. I did a lot of research until I found the Open Data that best served the problem I wanted to solve.
I had no experience manipulating satellite images or using maps in Jupyter. I had never cropped images either. These points are the ones that have taken me the most work.
Using StudioLab has been very easy. It is a great advantage that the data is not lost when you turn off.
Accomplishments that we're proud of
It's one of the most complicated hackathons I've ever participated in, because of all the things I didn't know how to do when I signed up: use of satellite data, cropping images and placing them on the map, interactive maps in Jupyter, etc...
Also, I am very proud of the idea, I think it is original and has potential. There is a lot of published work on detecting fire in a photo, but in this project I try to predict fire before it is "seen" in the image, which I find very valuable for the planet and for disaster response teams.
What we learned
I learned a lot about the Open Data that is published in AWS (Sentinel-1, 2, 3...) in addition to other Open Data such as the NASA fires. I learned how to use maps in jupyter. I learned to work with different Kernels in StudioLab. I learned to automate the entire process of generating a dataset. I learned to work with Vision Transformers. I learned about handling satellite images (RGB and 1-band images).
What's next for Wildfire prediction
The vision Transformer does not work well, but it is a first step to be able to build a multimodal system in the future. In addition to the images prior to the fire, this Transformer could receive more information such as images, text and numbers as input, such as: temperatures, if it has rained or not, if there are holidays nearby (barbecues, etc.)...
Built With
- amazon-web-services
- jupyter
- jupyterlab
- leaflet.js
- notebook
- pandas
- python
- rasterio
- sagemaker-studio-lab
- satellite
- sentinel
- sentinelhub
- studiolab
- vision-transformer
- widget
- wildfire-dataset


Log in or sign up for Devpost to join the conversation.