-
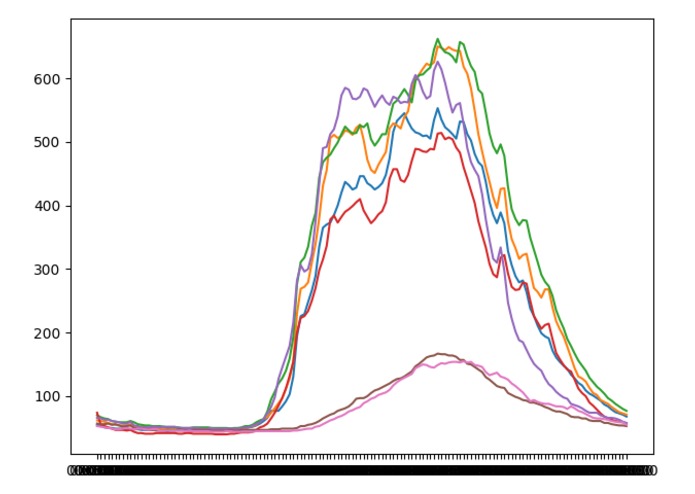
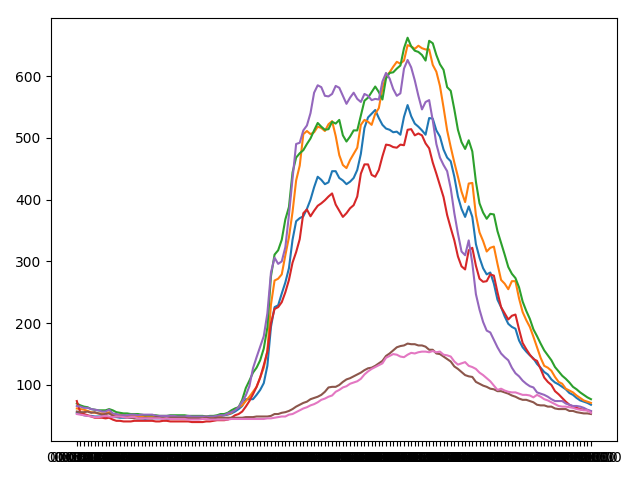
kemper wifi statistics
-
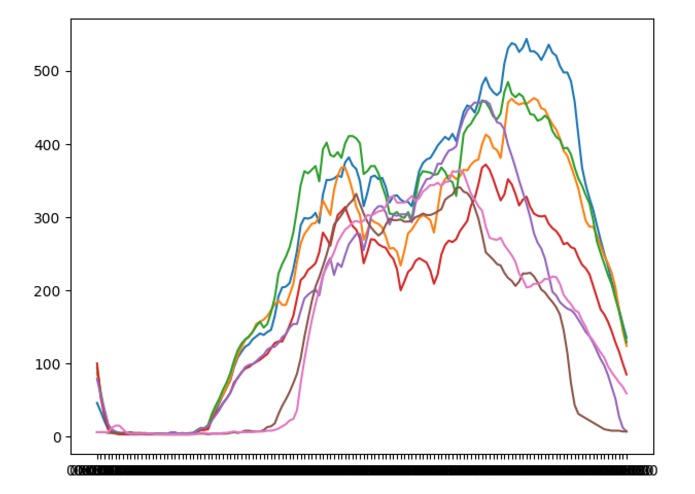
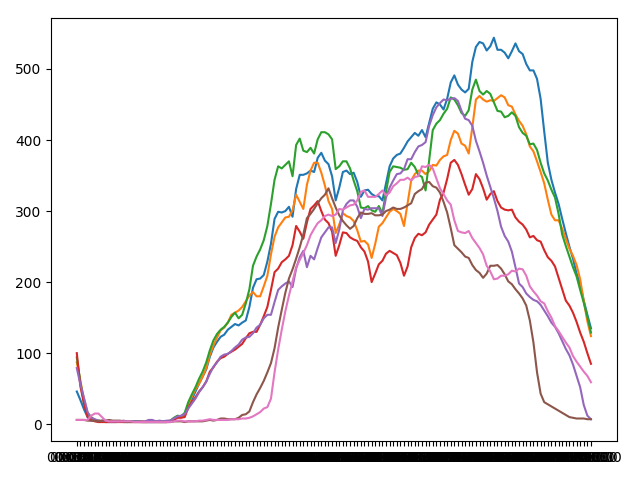
arc wifi statistics
-
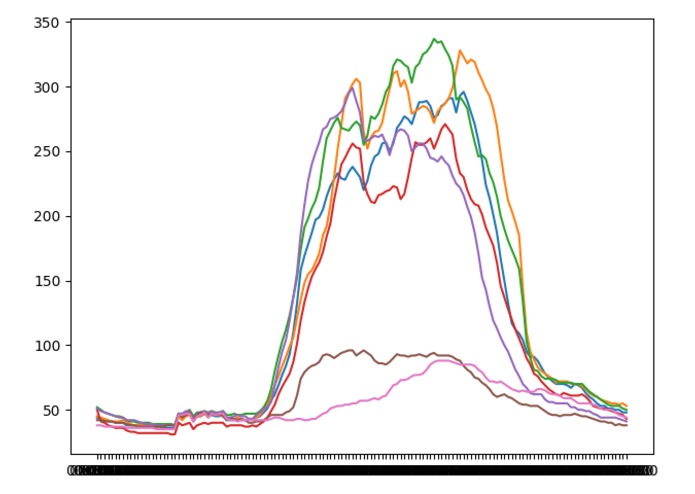
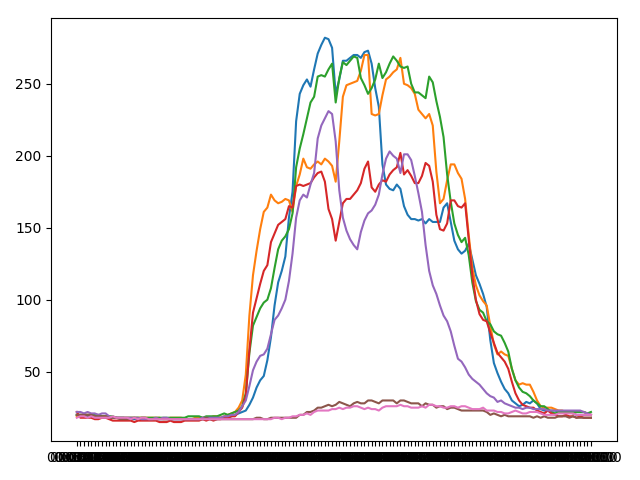
giedt-hall wifi statistics
-
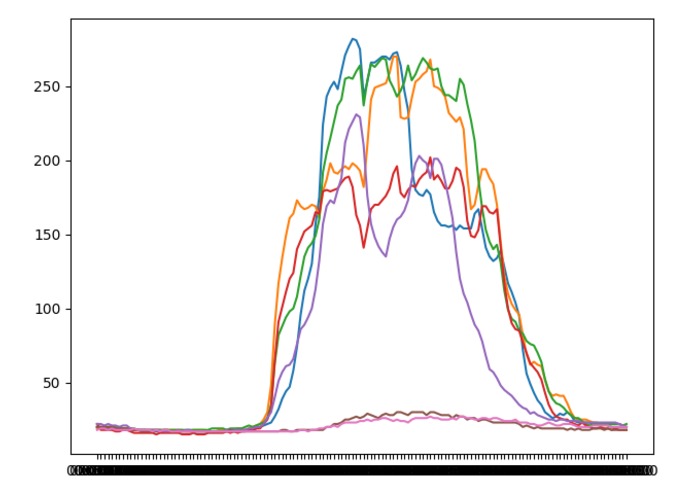
hutch wifi statistics

Inspiration
HackDavis wifi experienced slowdown in the beginning of the event. Using statistics of wifi occupancy from the past may help be better prepared for future event or daily energy conservation.
What it does
It reads data from past WiFi statistics provided by OSIsoft, then calculates and plots the average wifi occupancy against time in a day for each day in a week. Data points are as accurate as ten-minute interval.
How I built it
Multiple python libraries were used to read in and visualize data.
Challenges I ran into
Designing and constructing appropriate data structures for this problem was challenging.
Accomplishments that I'm proud of
Successfully learnt how to use multiple libraries to help me finish the task.
What I learned
How to use libraries like matplotlib. A good planning of design pattern is significant for any project.
What's next for WiFi-Occupancy
Developing into a online app for everyone to lookup
Built With
- matplotlib
- osisoftpi
- python

Log in or sign up for Devpost to join the conversation.