-
-
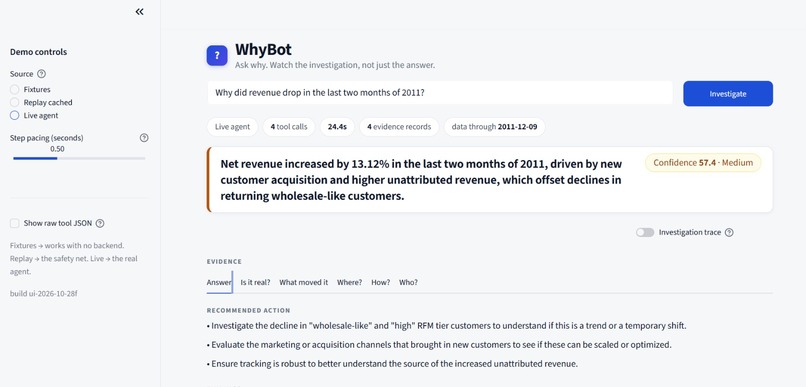
When the system is prompted with a business question
-
-
-
-
Inspiration
Dashboards show executives what happened, but never why. When revenue dips, an analyst spends days slicing by country, product, and customer segment to find the cause. We wanted to automate that investigation, so an executive can ask "Why did revenue drop?" and get an answer they can audit, not just another chart.
What it does
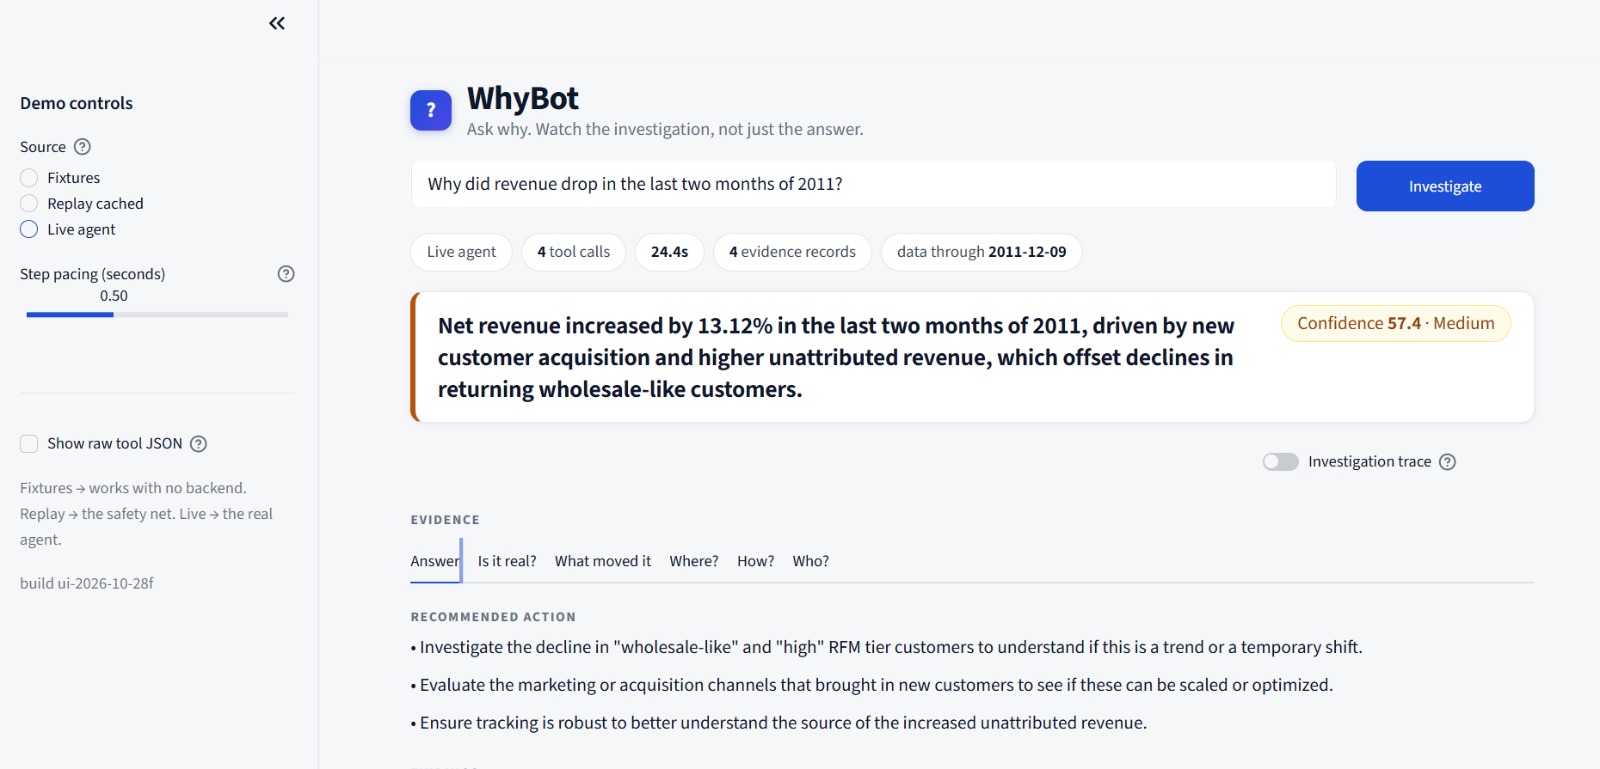
WhyBot is an AI analyst that investigates a business question on its own:
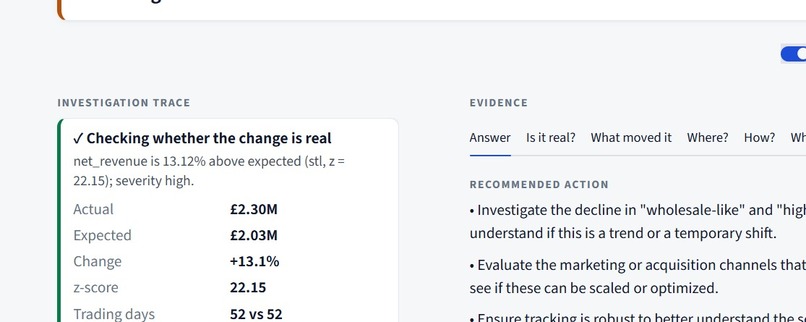
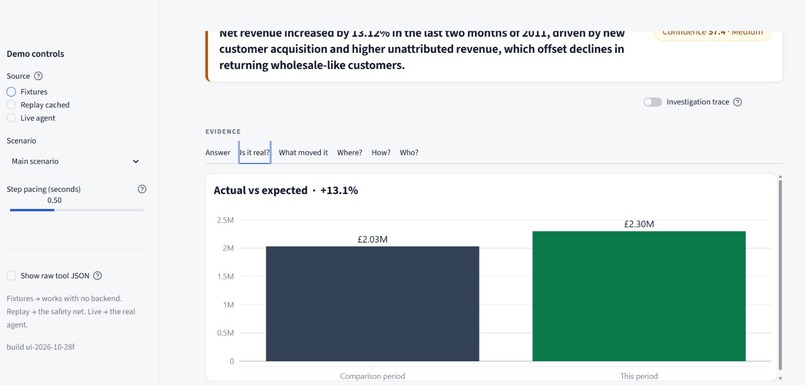
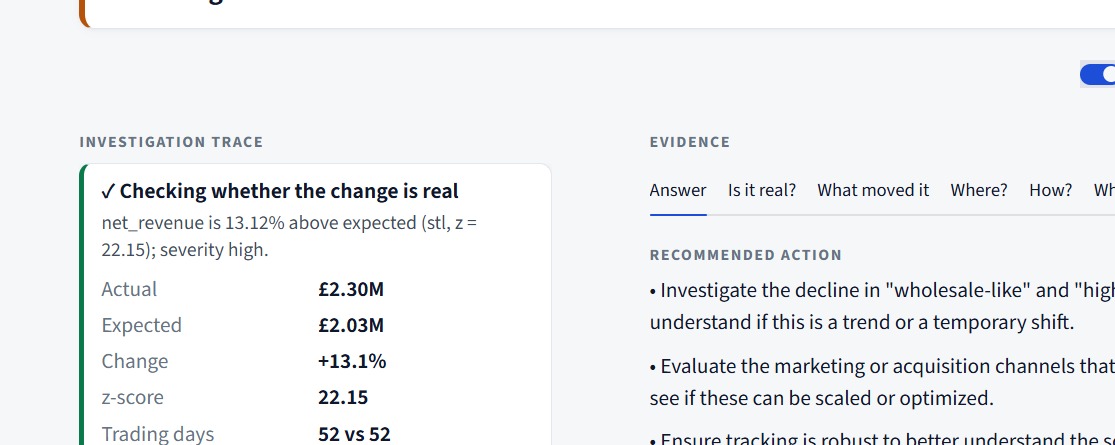
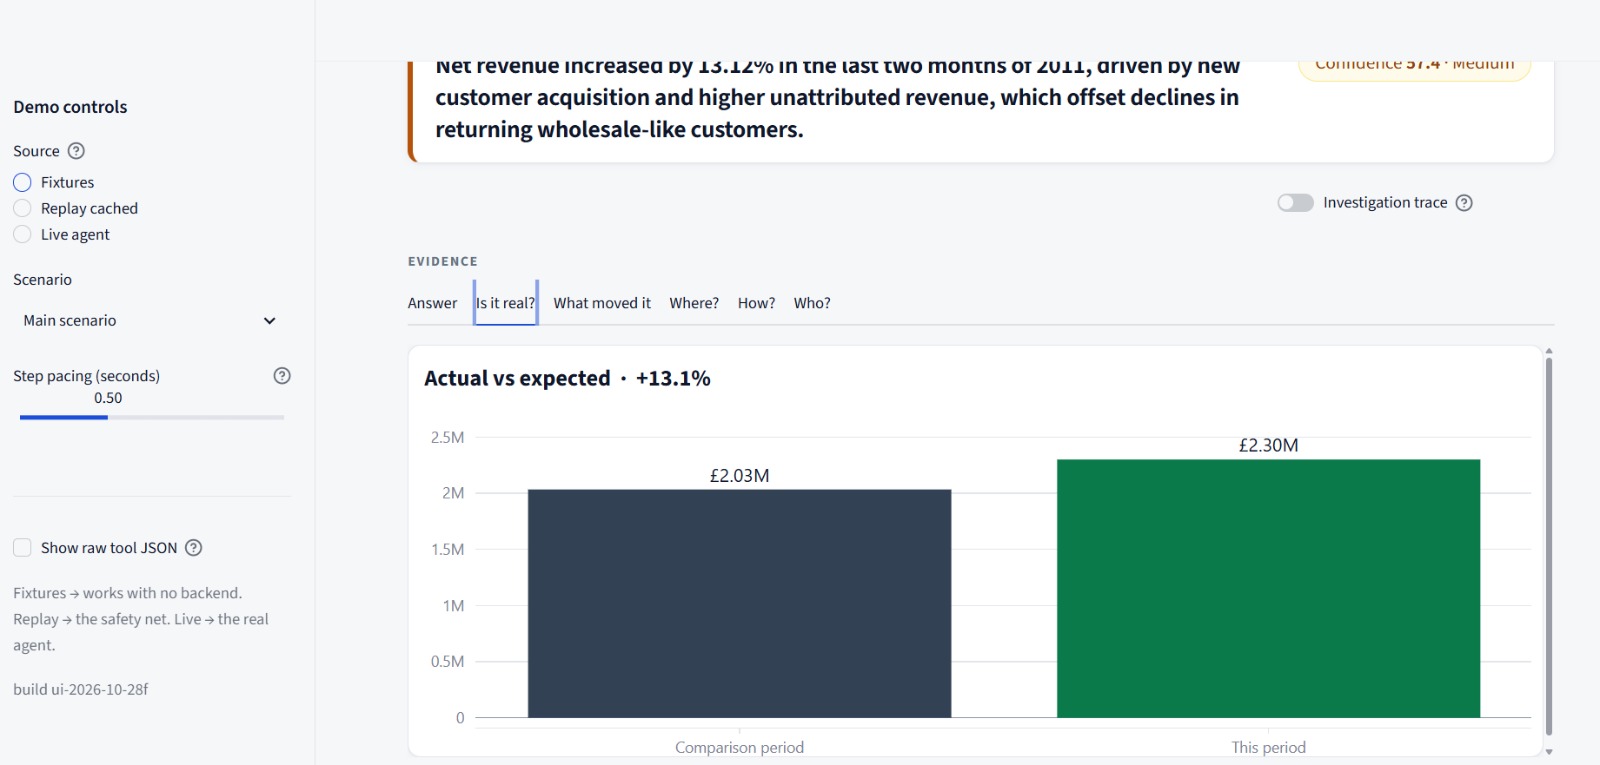
- Detects the revenue change and quantifies it (change %, dates, severity).
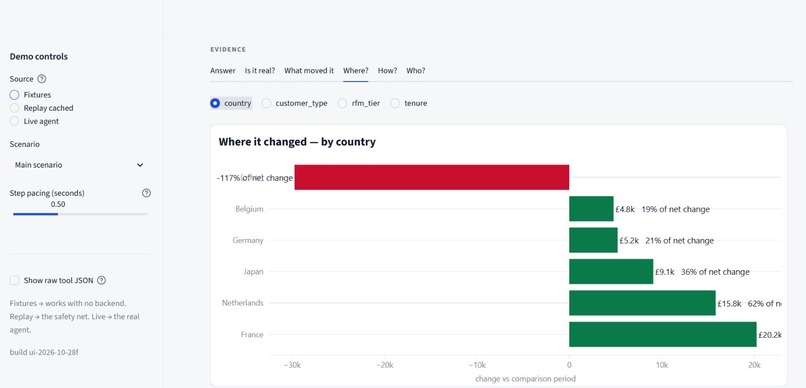
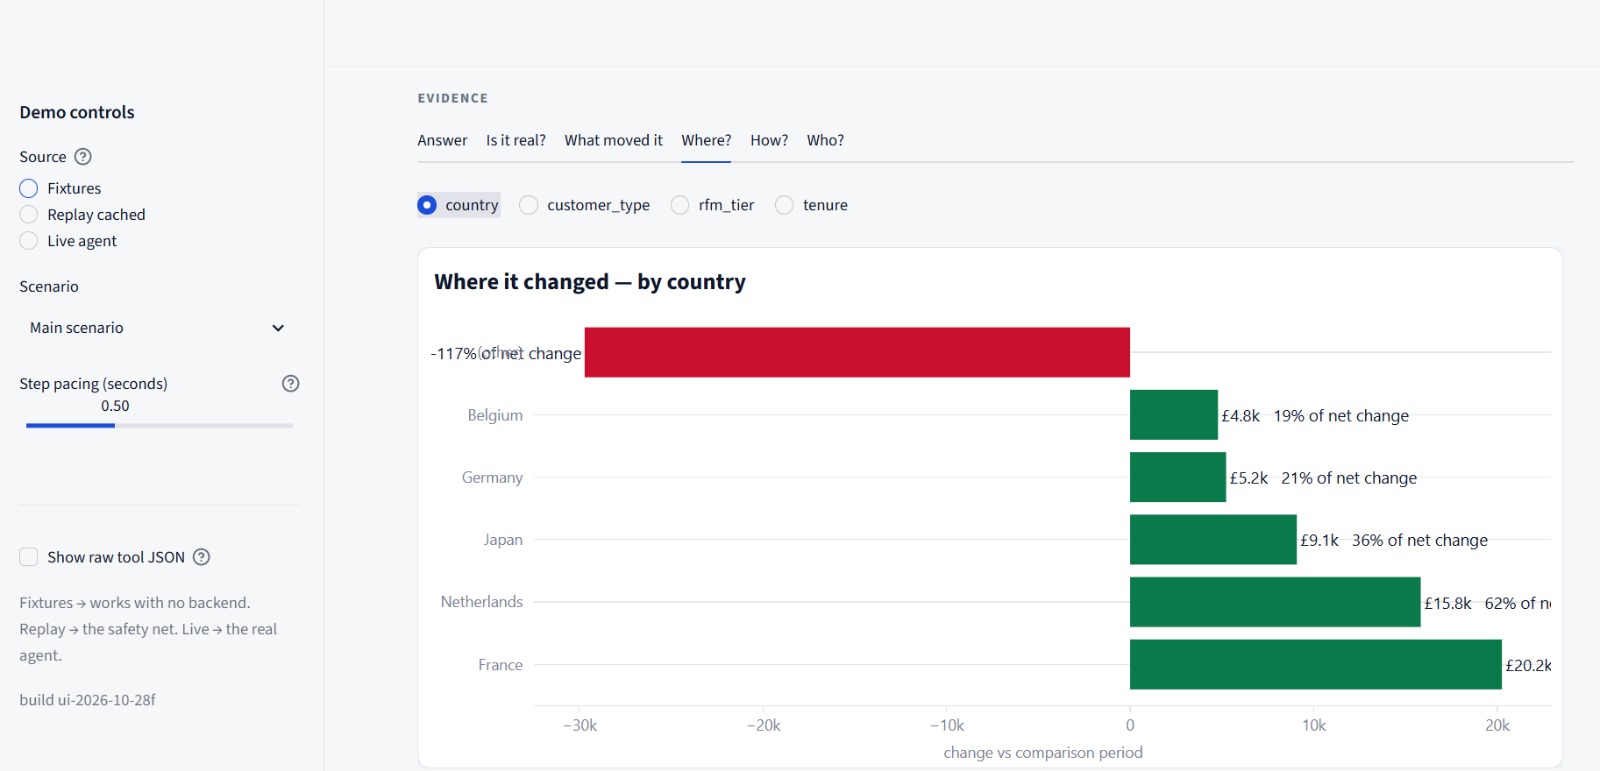
- Drills down by country, product, and customer segment using SQL.
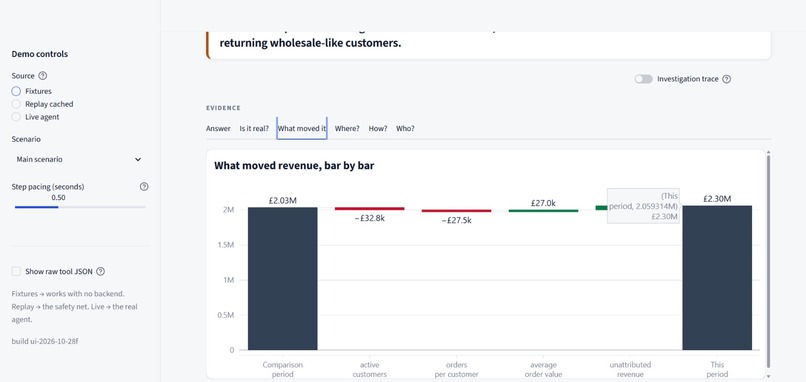
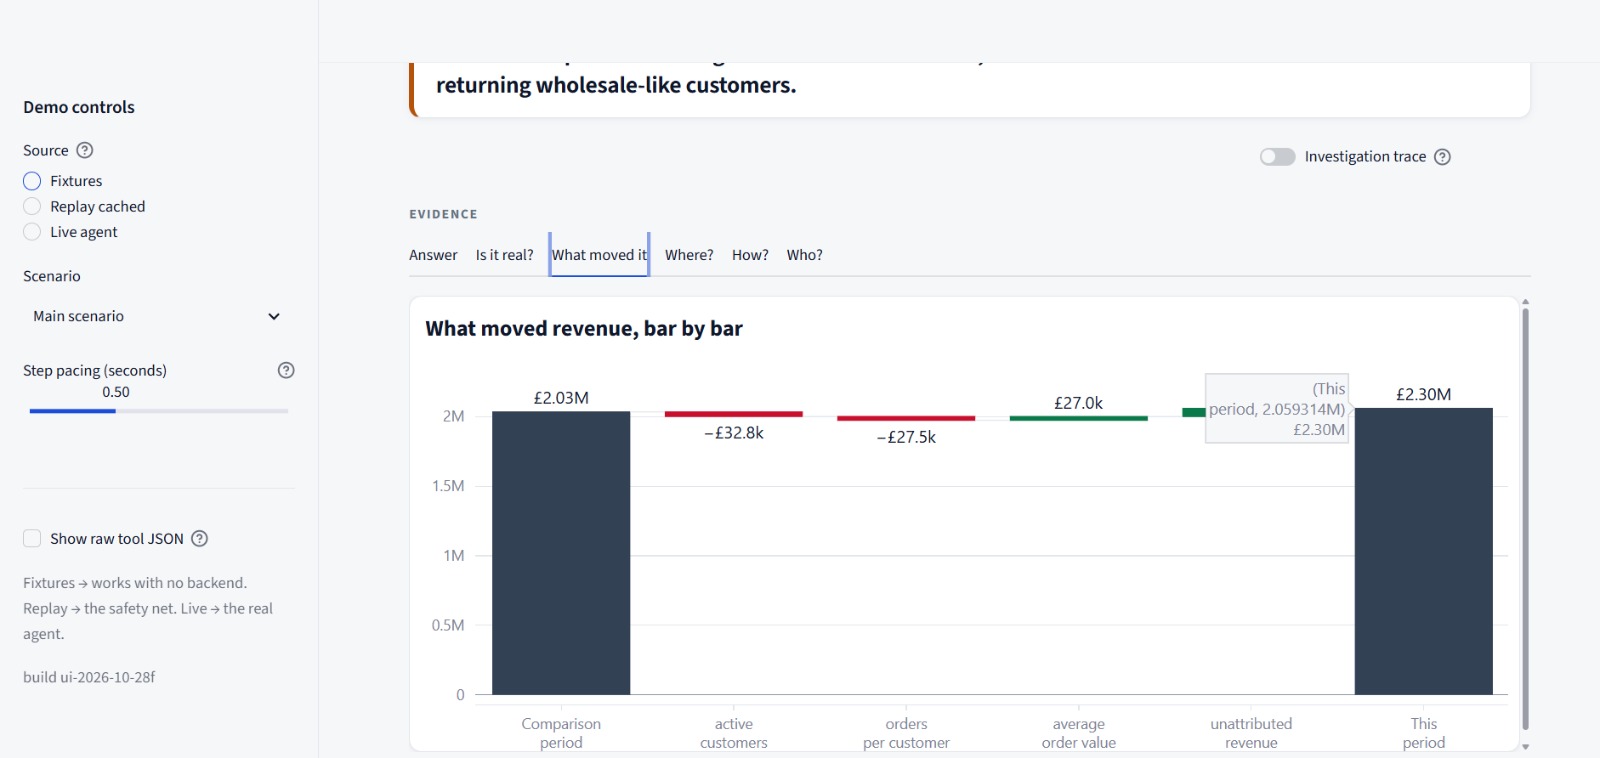
- Ranks contributors to the total change, so you see where the revenue went.
- Tests the likely causes statistically.
- Scores confidence from the share of the drop explained and significance tests.
- Writes a report with the cause, the evidence, and a recommended action.
Every step appears in a live investigation trace, so nothing is a black box.
Example: [Insert your real demo result here, e.g. "Revenue down X% in [period], driven mainly by [country/product/segment], which explains Y% of the drop. Confidence: Z."]
How we built it
- Data layer: the UCI Online Retail II dataset (about 1M transactions), cleaned with Python and pandas, stored in DuckDB, with a daily/weekly metrics table.
- Anomaly detection: time-series decomposition and residual z-scores with statsmodels.
- Drill-down engine: SQL and pandas contribution analysis across dimensions.
- LLM agent: the Claude API with tool use orchestrates the tools in a loop and writes the narrative.
- Interface: Streamlit and Plotly, with a question box, step-by-step trace, charts, and a final report card.
Key design decision: the math stays in code, not in the LLM. Statistics, contribution shares, and confidence scores are computed deterministically, and the LLM may only quote numbers returned by tools. That prevents hallucinated figures and makes every claim traceable.
Challenges we ran into
- Keeping the LLM from inventing numbers. We restricted it to tool outputs and checked its report against them.
- Defining a confidence score that is computed from data rather than guessed.
- Finding a clear revenue dip in real retail data and making the tools agree on the story.
- Integrating three people's modules in two days. We agreed on JSON tool interfaces up front and built against stubs.
Accomplishments that we're proud of
- A full investigation loop running end to end on real transactional data.
- Every conclusion links back to evidence, and the confidence score is computed, not generated.
- Our first hackathon, built in under 48 hours.
What we learned
- Agents are most trustworthy when the LLM reasons and explains while deterministic tools do the math.
- One polished scenario beats a broad system that breaks in the demo.
- Agreeing on interfaces early is what lets three people build in parallel.
What's next for WhyBot
- Connect to any SQL warehouse so it fits existing BI stacks.
- Add more data sources, such as regional economic context.
- Scheduled monitoring and proactive alerts, so WhyBot flags drops before anyone asks.
- Revenue forecasting to estimate the impact of each cause.
