-

-
-
-

Data Visualization with Omni

Inspiration
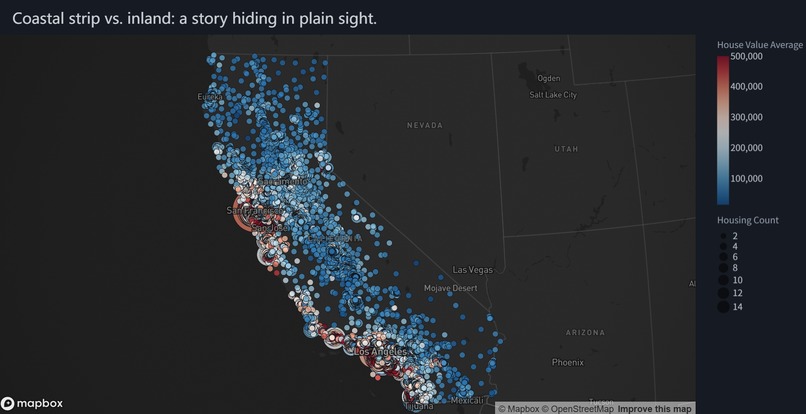
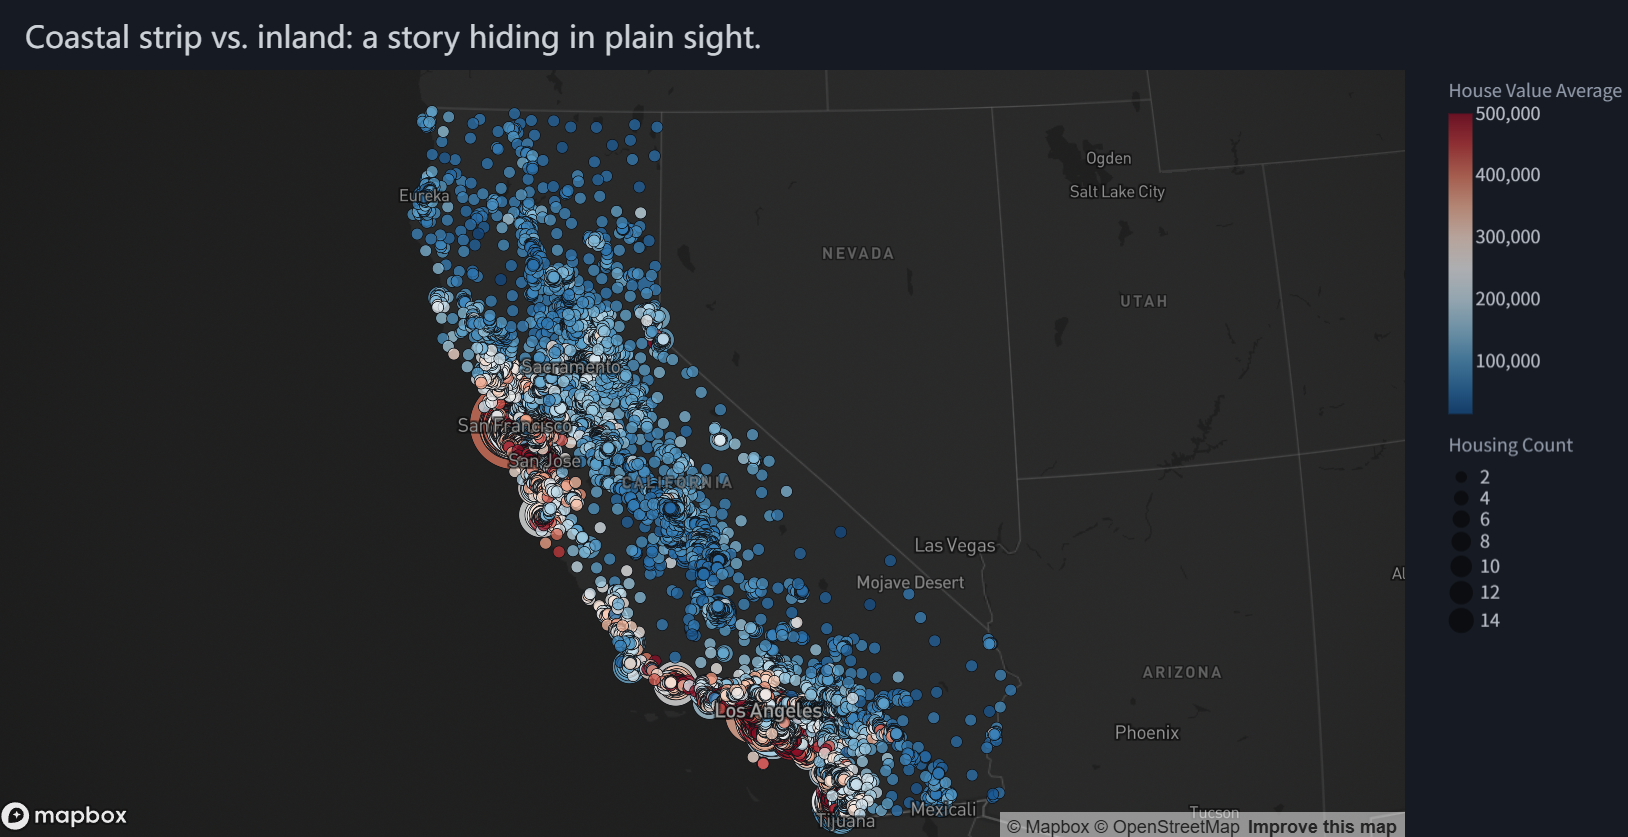
California has long symbolized opportunity and stability, but rising housing costs raise a difficult question: who can still afford the California Dream?
We started by exploring housing prices, but quickly realized the more meaningful question was not just where homes are expensive, but where limited policy resources should go first. That shift became the core of our project: Who Stole the California Dream?
What it does
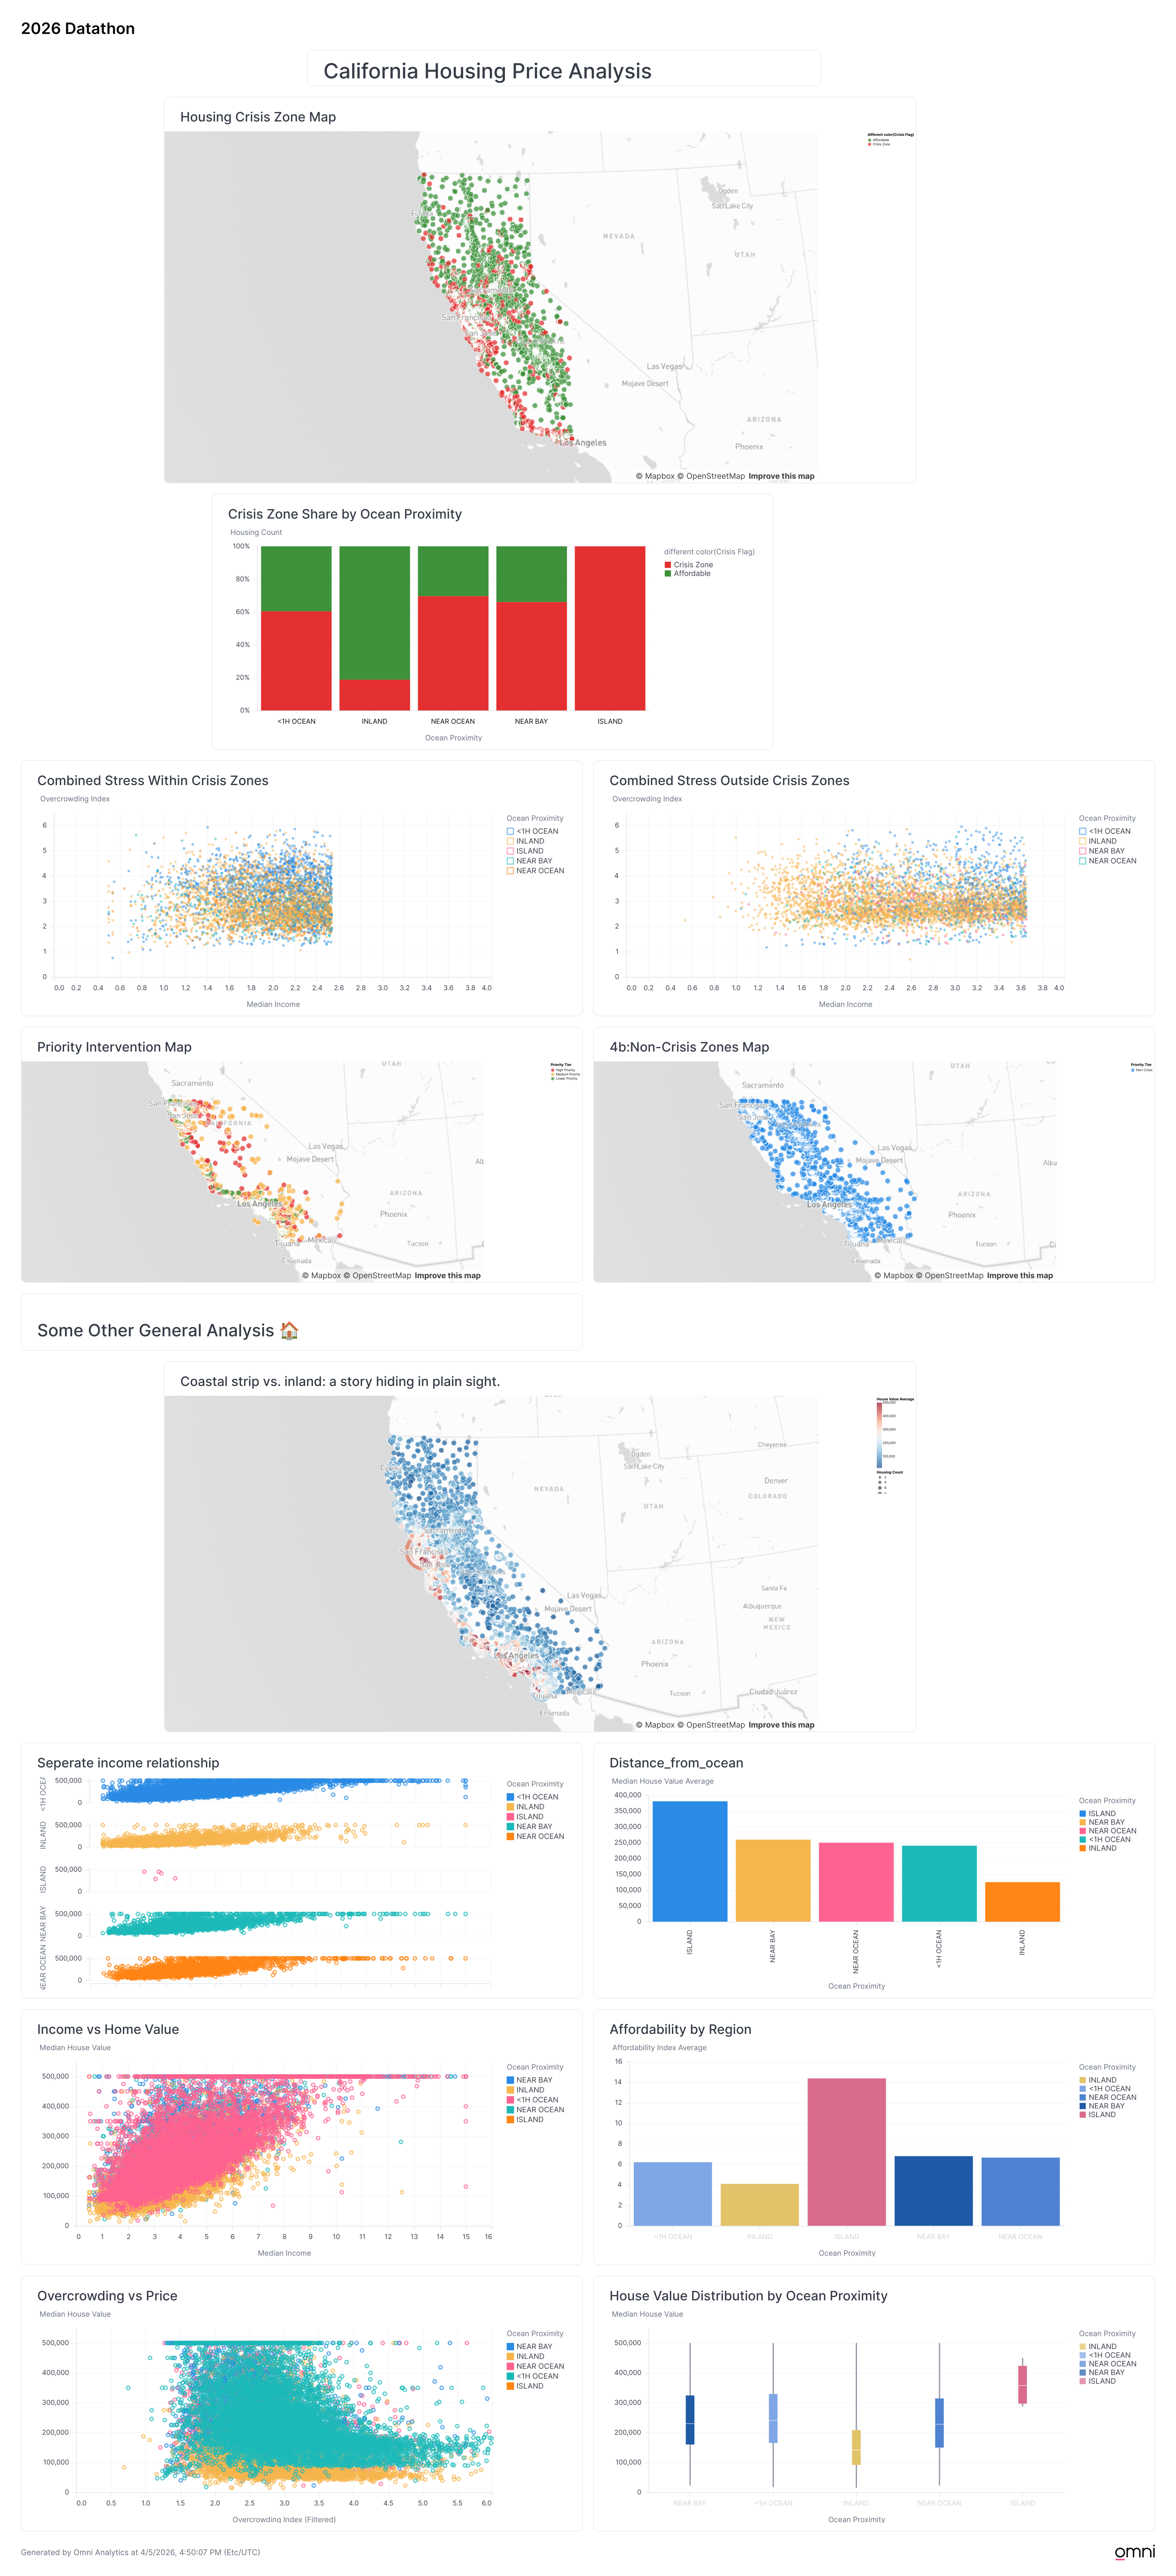
This project builds a data-driven framework for identifying and prioritizing housing crisis zones in California using 1990 Census housing data.
We define a Crisis Zone using an engineered Affordability Index:
Affordability Index = Median House Value / (Median Income × 10,000)
Then we combine affordability with:
- Median Income
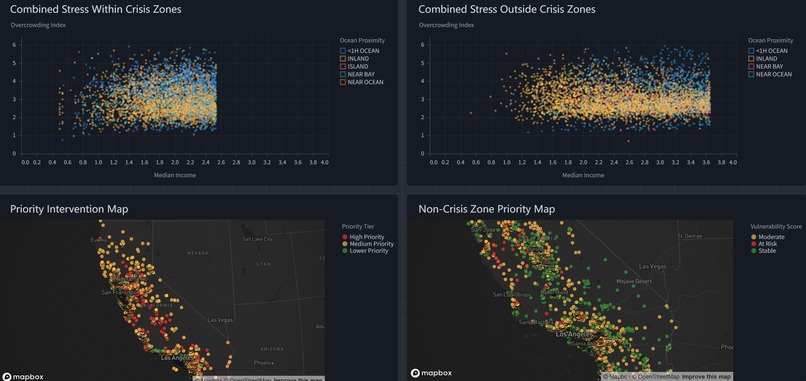
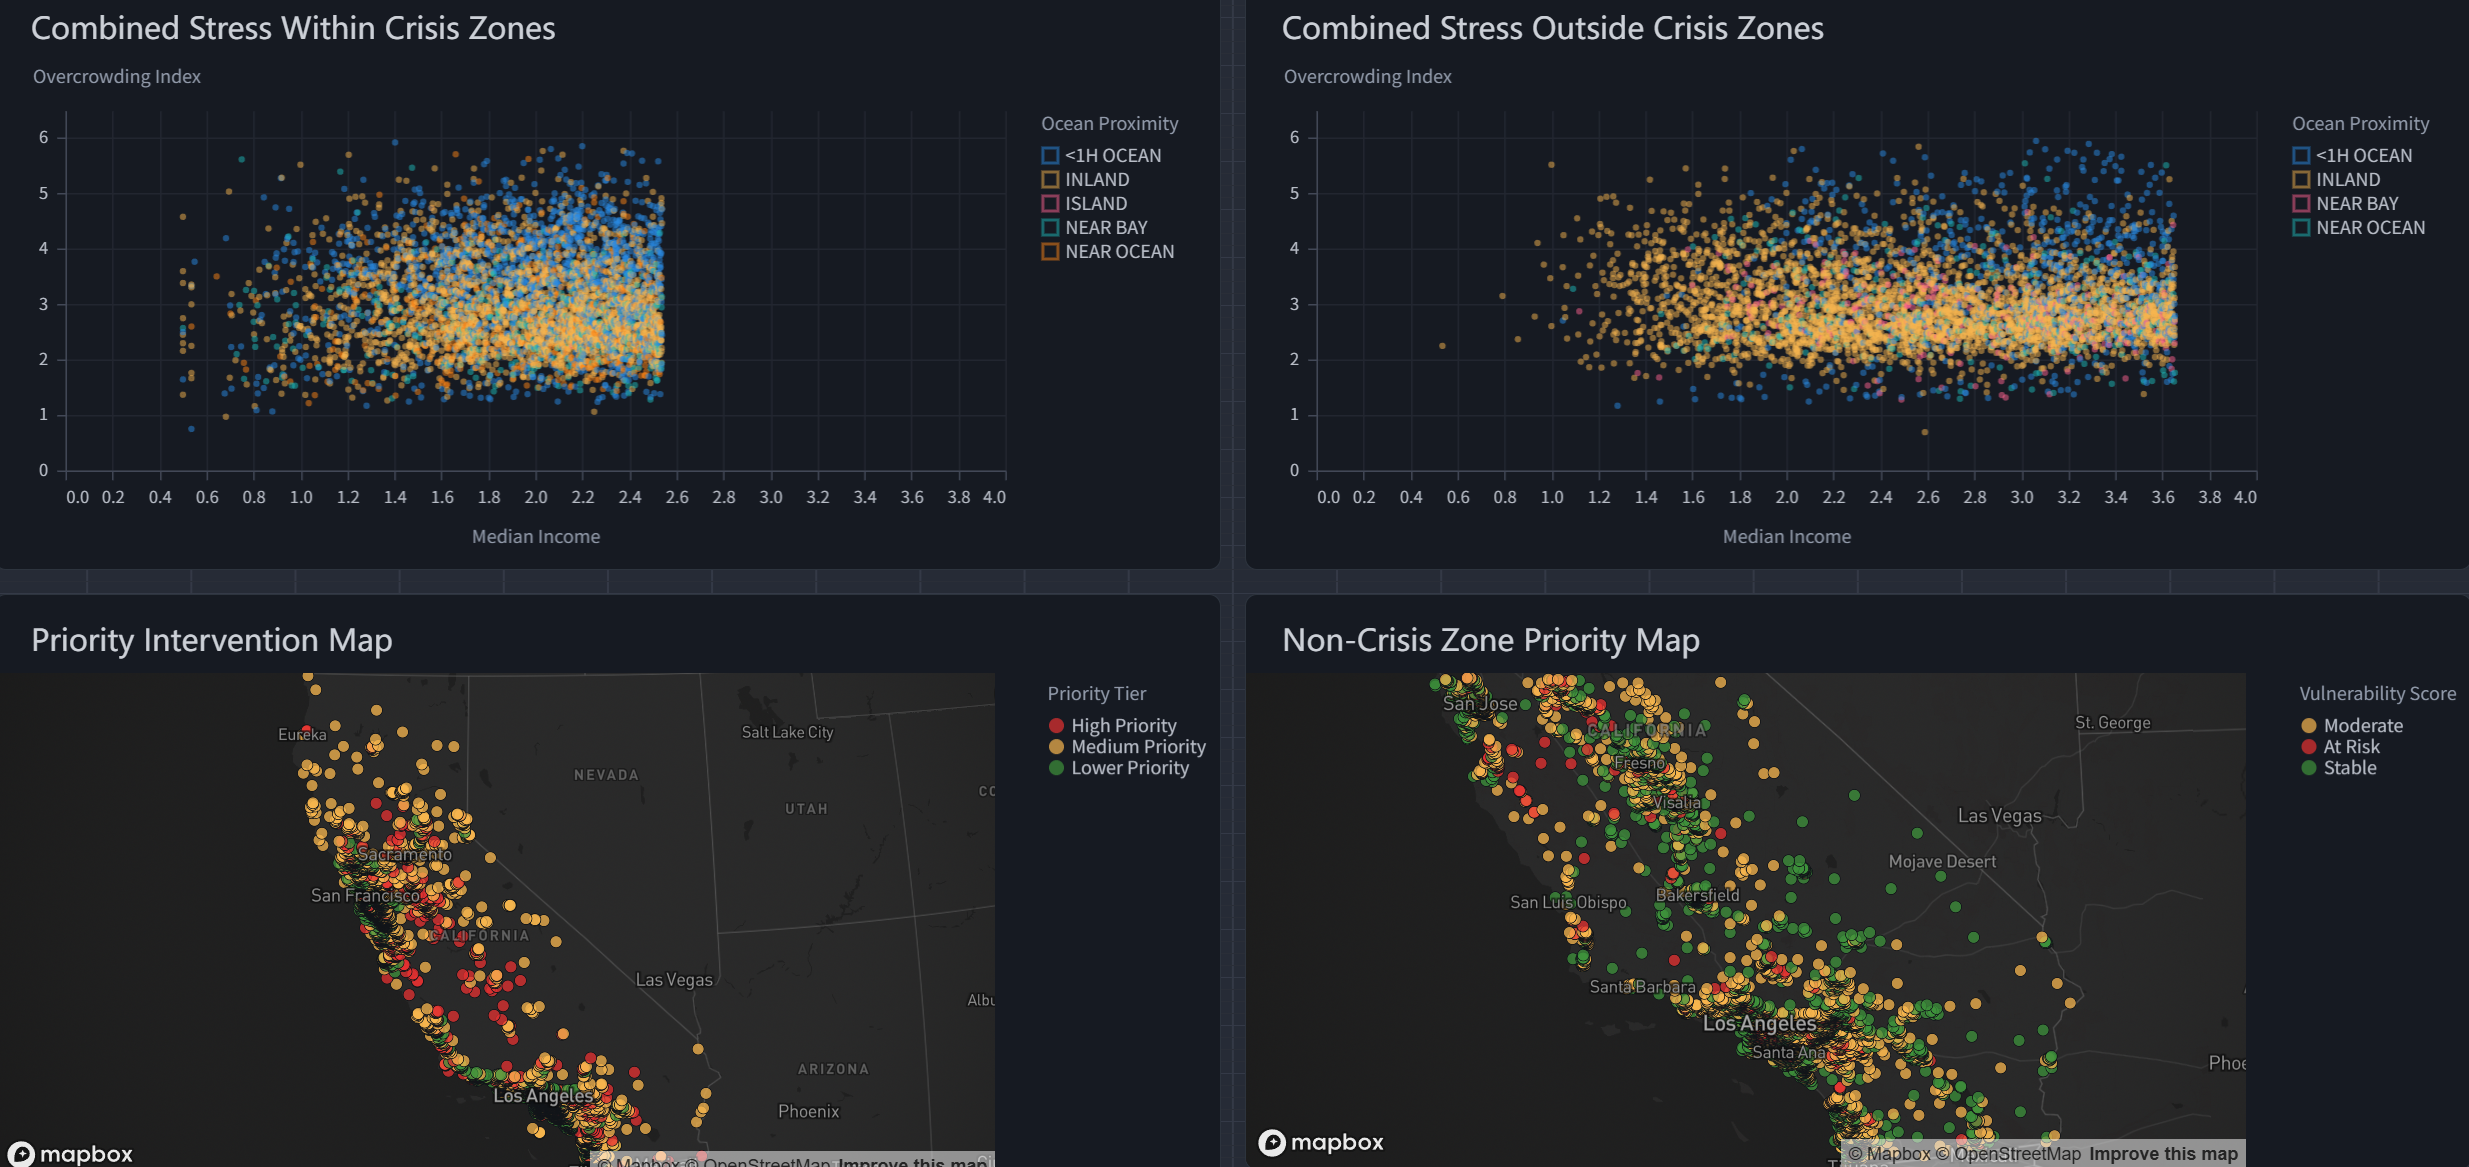
- Overcrowding Index = Population / Households
to assign each community to a Priority Tier:
- High Priority
- Medium Priority
- Lower Priority Crisis
- Non-Crisis
This lets us move from description to action: which communities should be prioritized for housing intervention?
How we built it
We used the Omni Data Platform to explore the California Housing Dataset, engineer new features, and build an interactive dashboard.
Our workflow was:
- Explore spatial housing patterns
- Create an Affordability Index, Crisis Flag, and Priority Tier
- Compare crisis burden across geography
- Map the highest-priority intervention zones
We also used Vega-Lite customization for chart refinement and GitHub + Markdown for documentation.
Challenges we ran into
Our biggest challenge was that the project initially felt too simple. We had several charts, but not yet a strong analytical story.
The turning point was reframing the project around prioritization under limited resources. That helped us decide which features to engineer, which charts to keep, and how to connect the visuals into one coherent narrative.
We also had to balance creativity and rigor: making the project memorable through the California Dream theme while keeping the logic transparent and data-driven.
Accomplishments that we're proud of
We are proud that this project grew from a basic housing-price exploration into a clear intervention-priority framework.
In particular, we are proud that we:
- turned a historical dataset into a policy-oriented question
- built interpretable features instead of relying only on raw variables
- created a dashboard that moves from crisis identification to intervention priority
- connected a creative story with a meaningful analytical framework
What we learned
We learned that a strong data project is not just about making visualizations — it is about building a framework for decision-making.
This project also showed us that not all crisis zones are equally urgent. The communities that matter most are those where unaffordability overlaps with lower income and higher overcrowding.
What's next for Who Stole the California Dream?
A next step would be to apply the same framework to more recent housing data and compare how these patterns have changed over time.
We would also like to add variables such as rent burden, housing supply, and neighborhood vulnerability, turning this project into a richer tool for housing policy and planning.


Log in or sign up for Devpost to join the conversation.