-
-
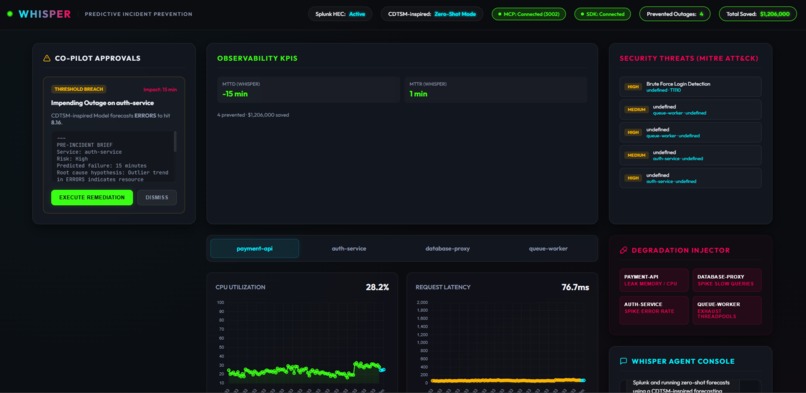
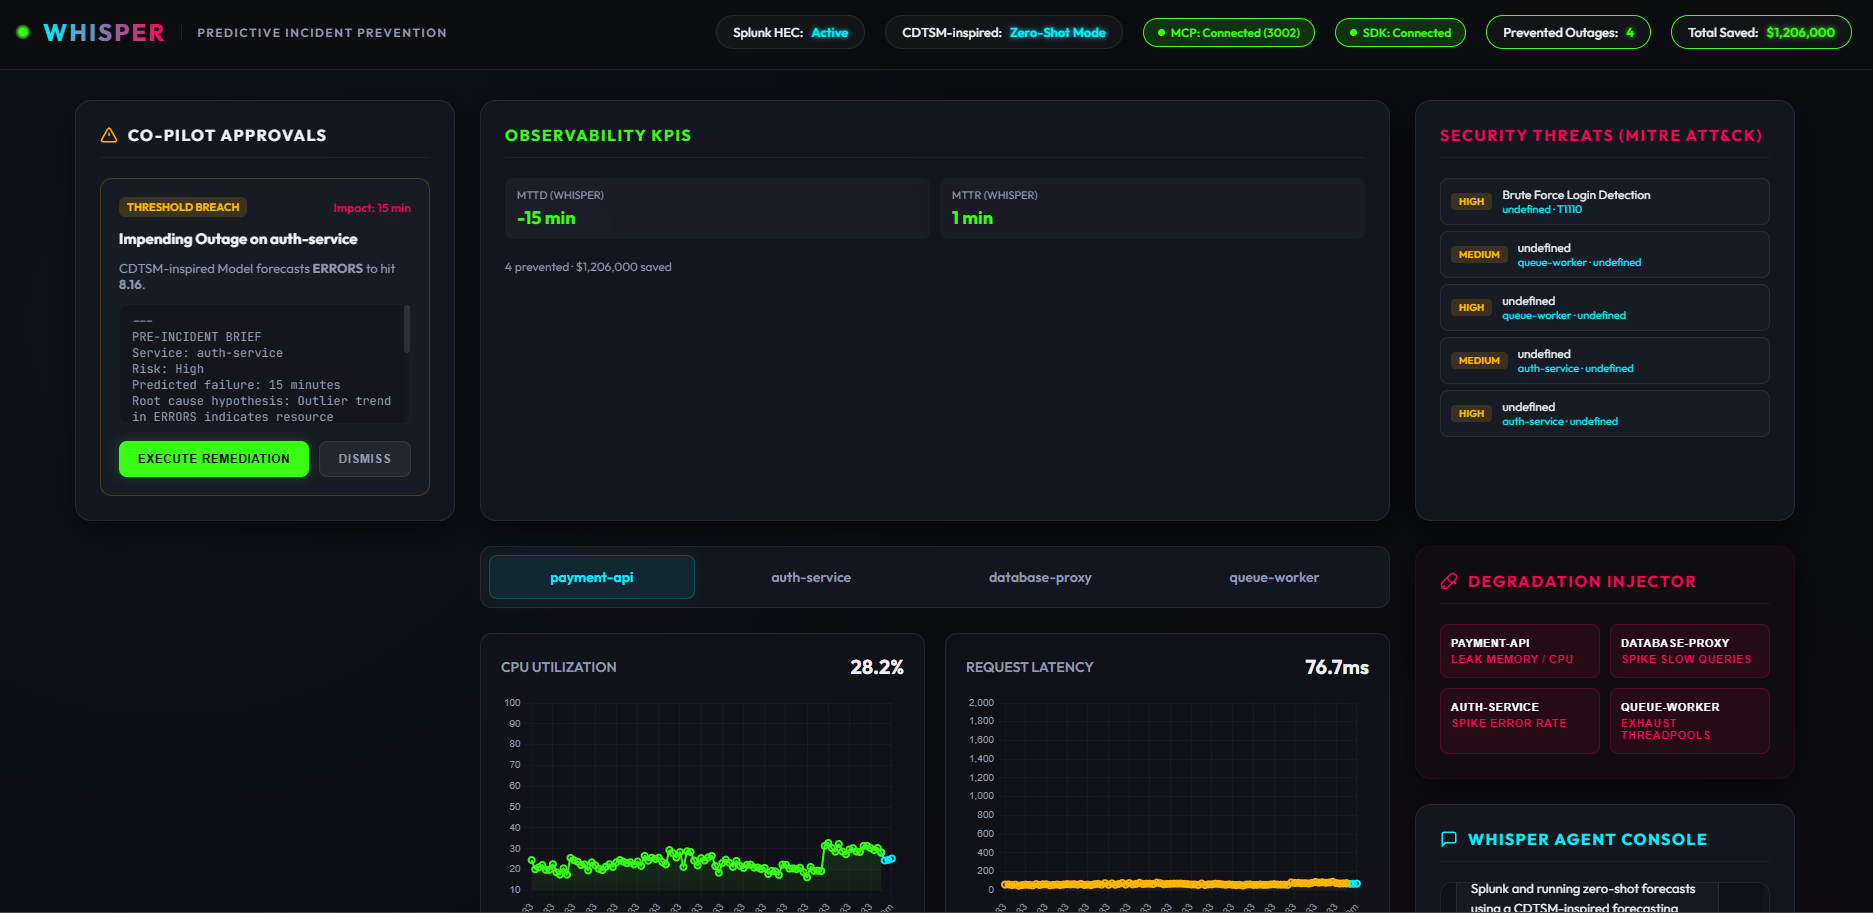
WHISPER predicts outages before they occur, combining Splunk telemetry, AI forecasting, and one-click remediation.
-
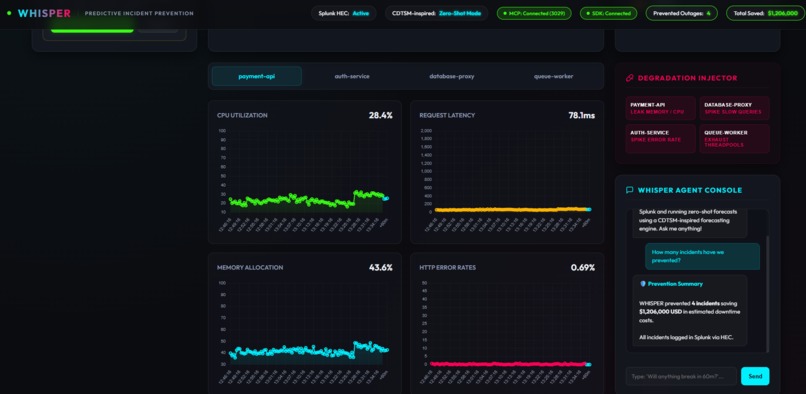
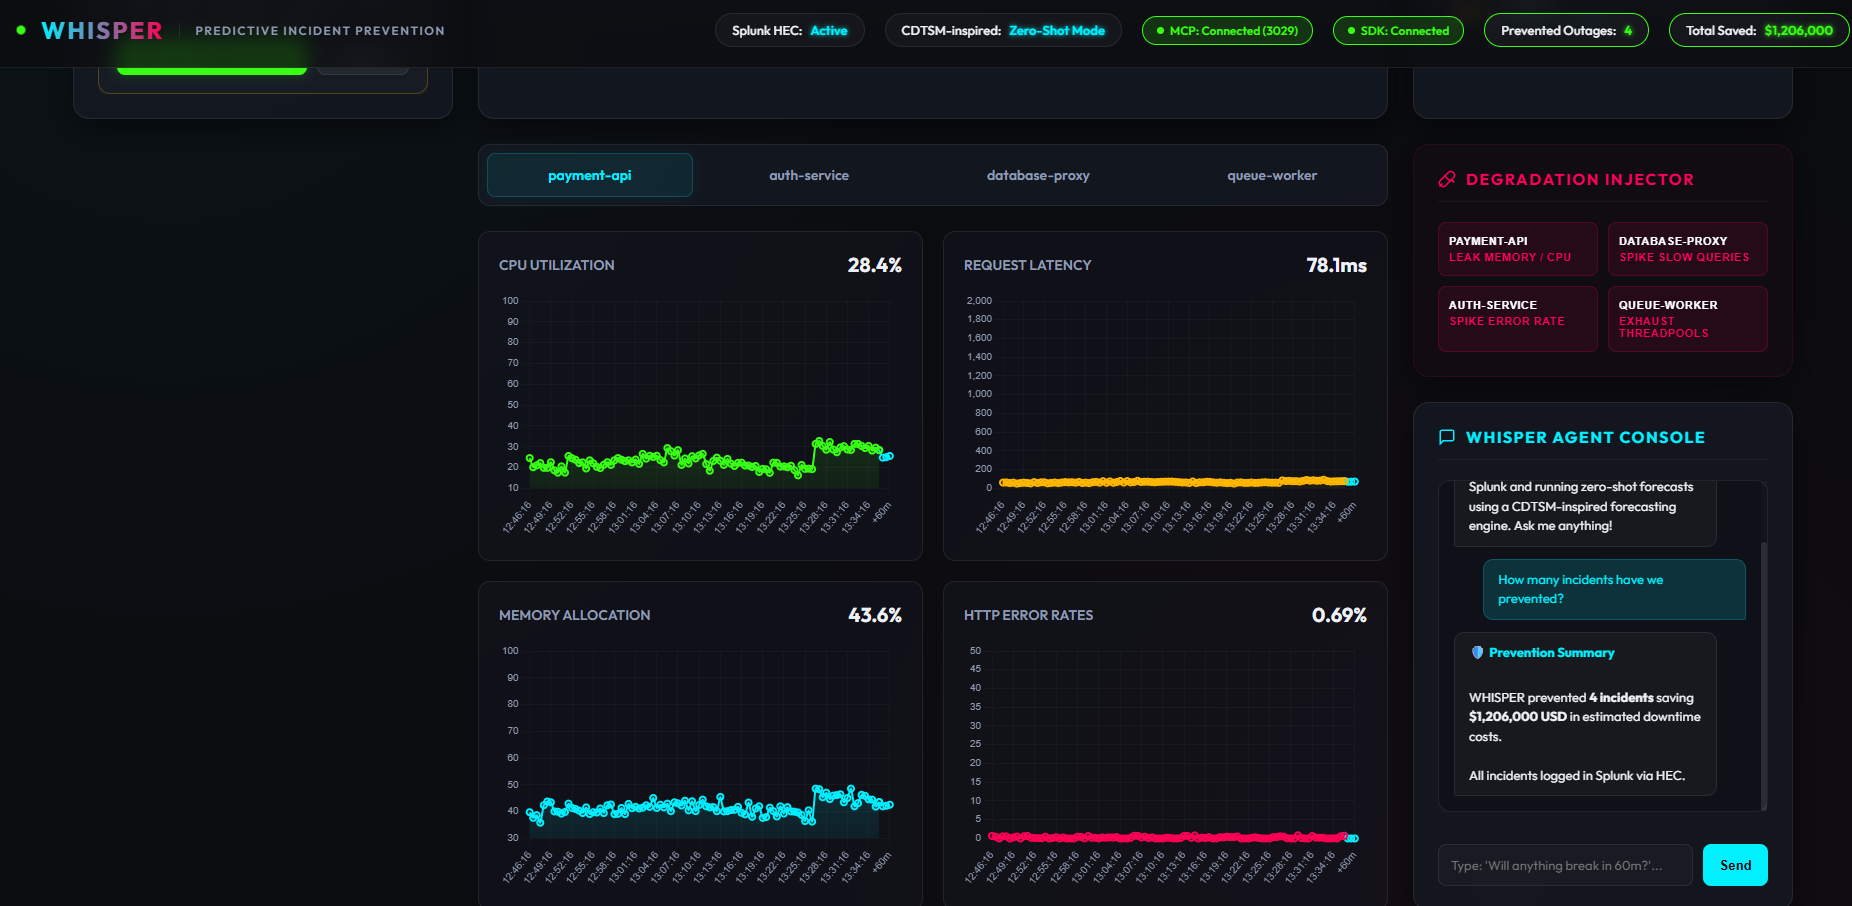
Monitor live service health, inject failures, and use AI-powered analysis to prevent outages before impact.
-
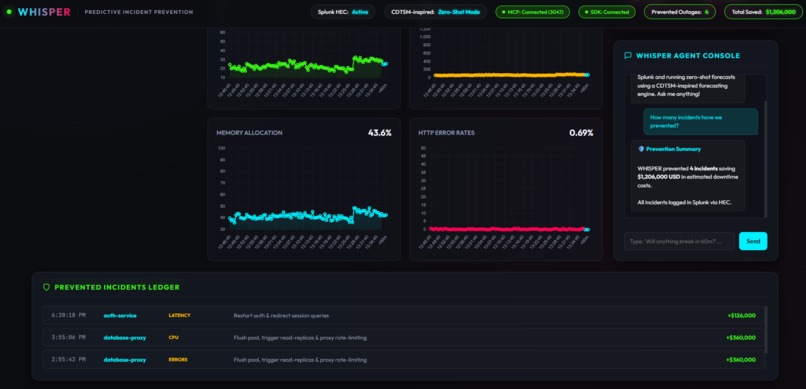
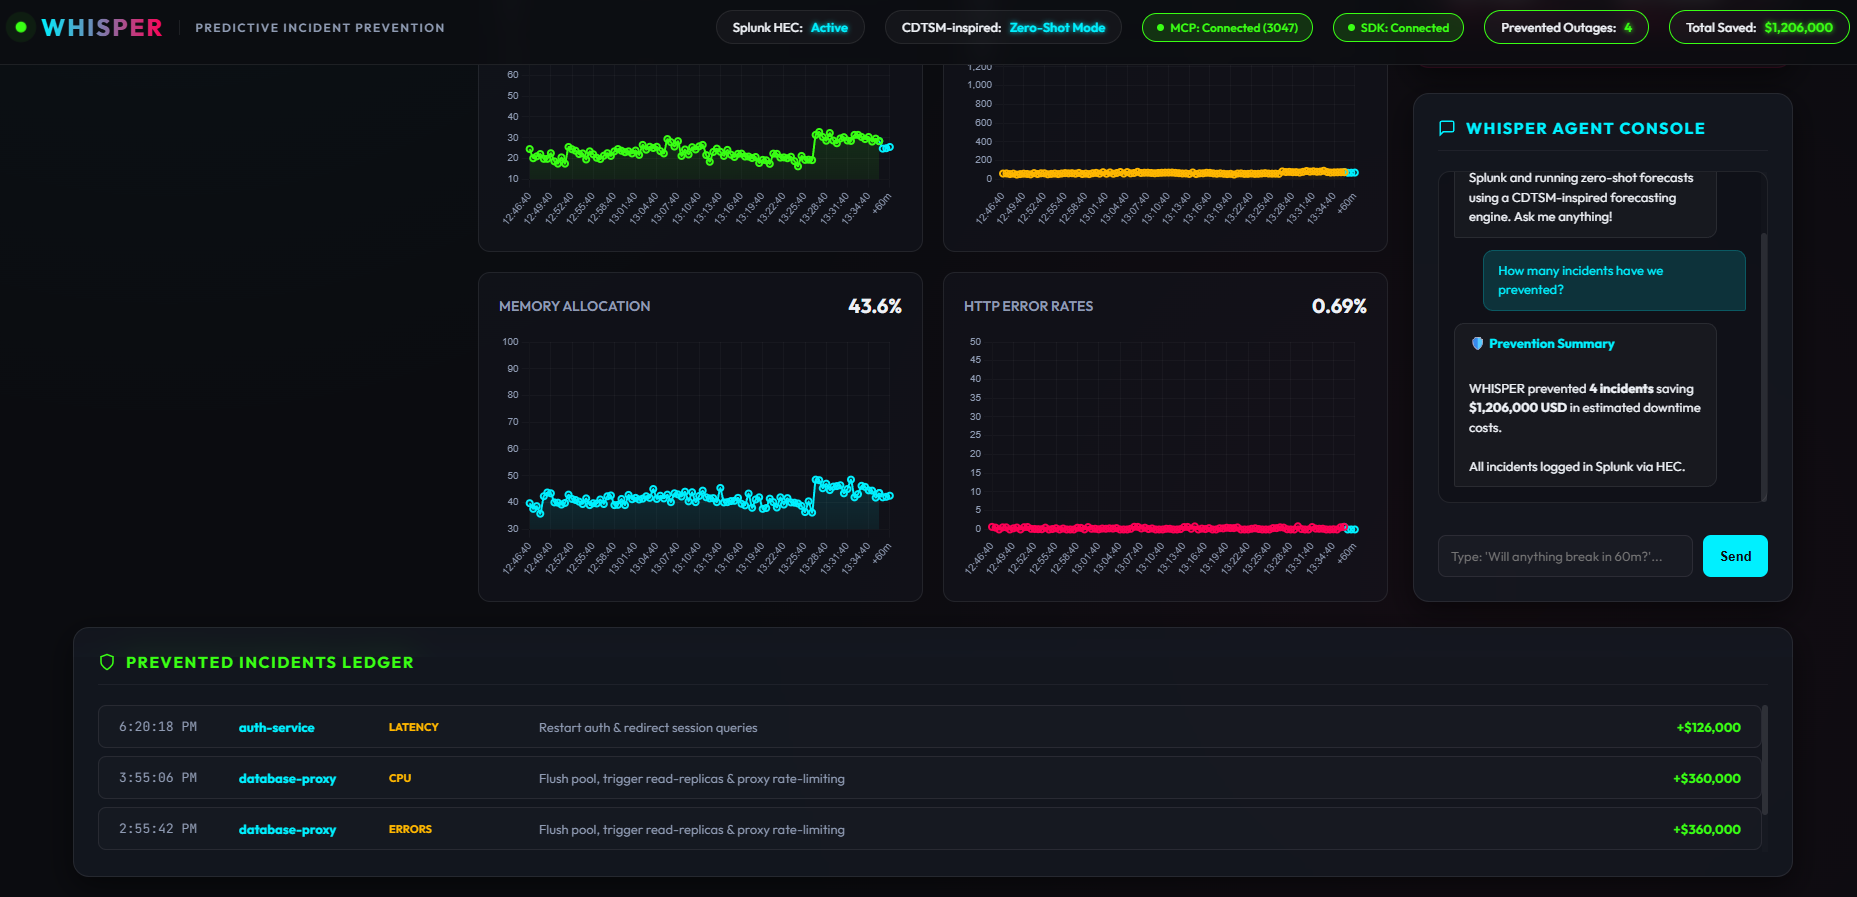
Track prevented outages, approved remediations, and estimated cost savings generated by predictive operations.
-
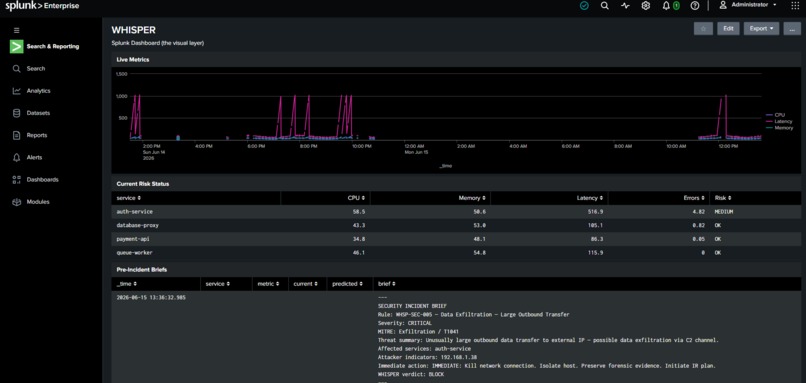
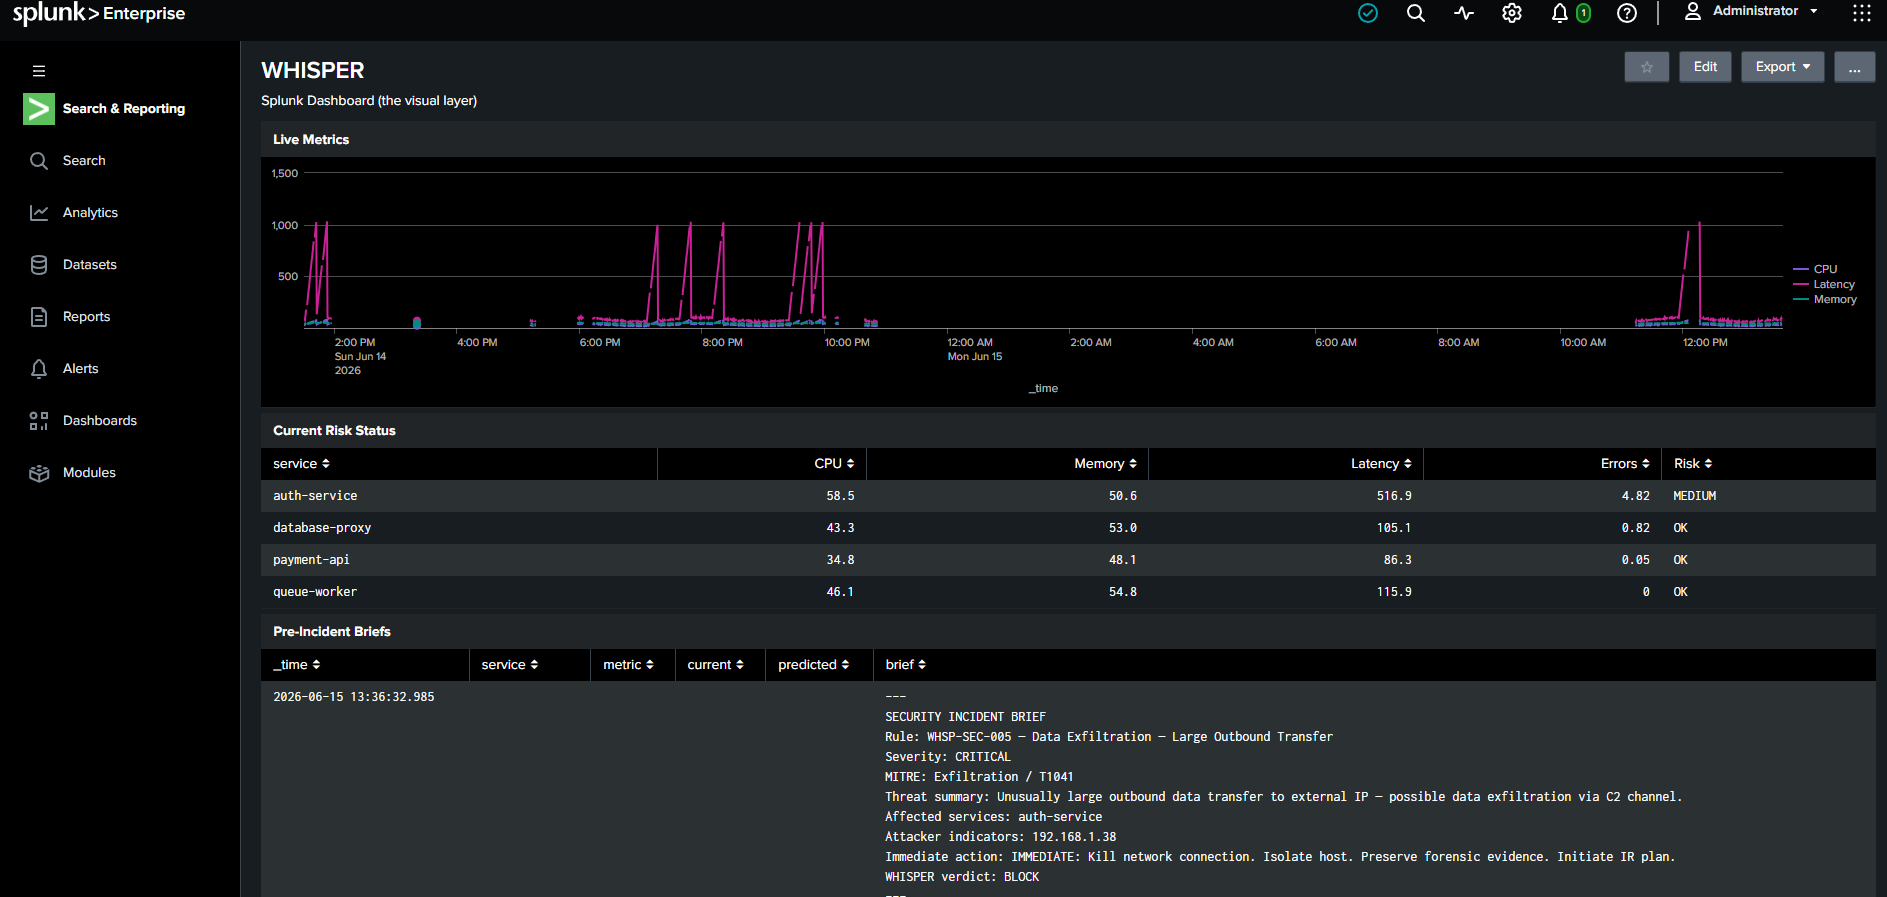
WHISPER data visualized inside Splunk Enterprise with live metrics, risk scoring, and AI-generated incident briefs.
-
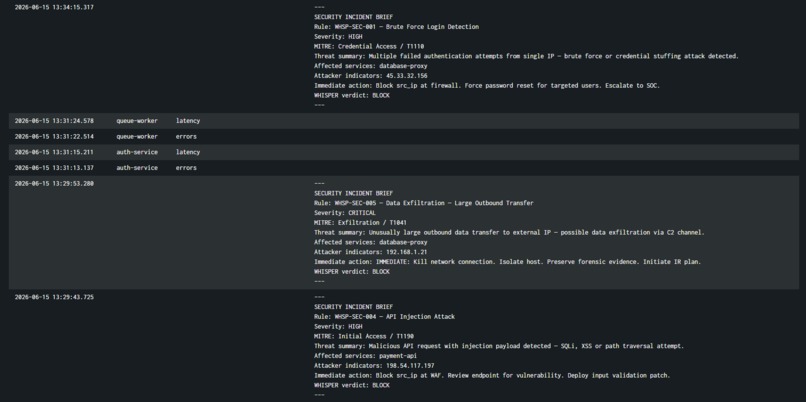
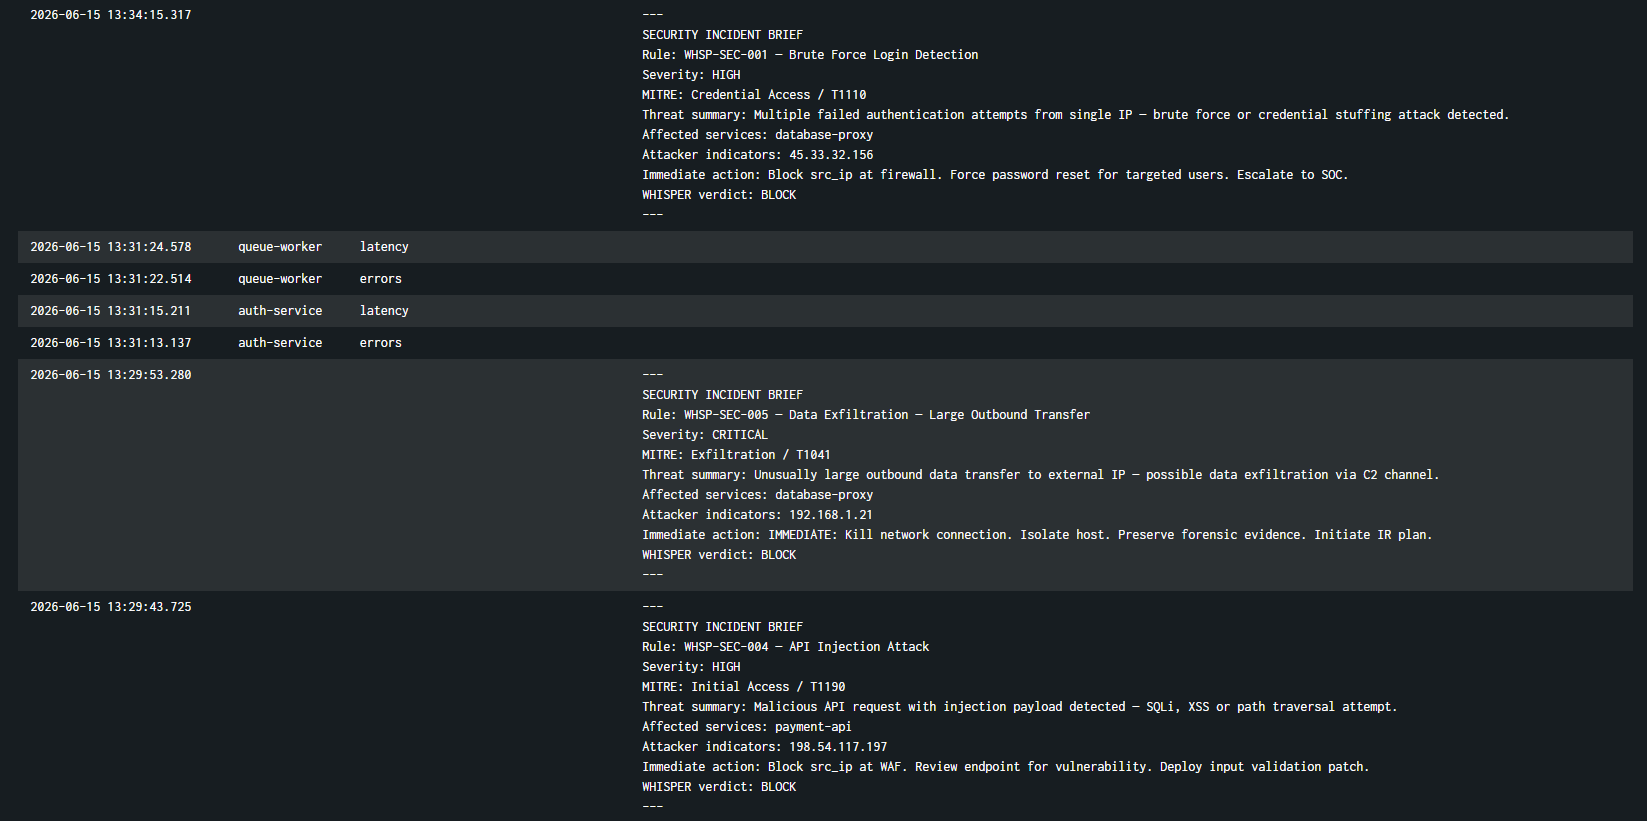
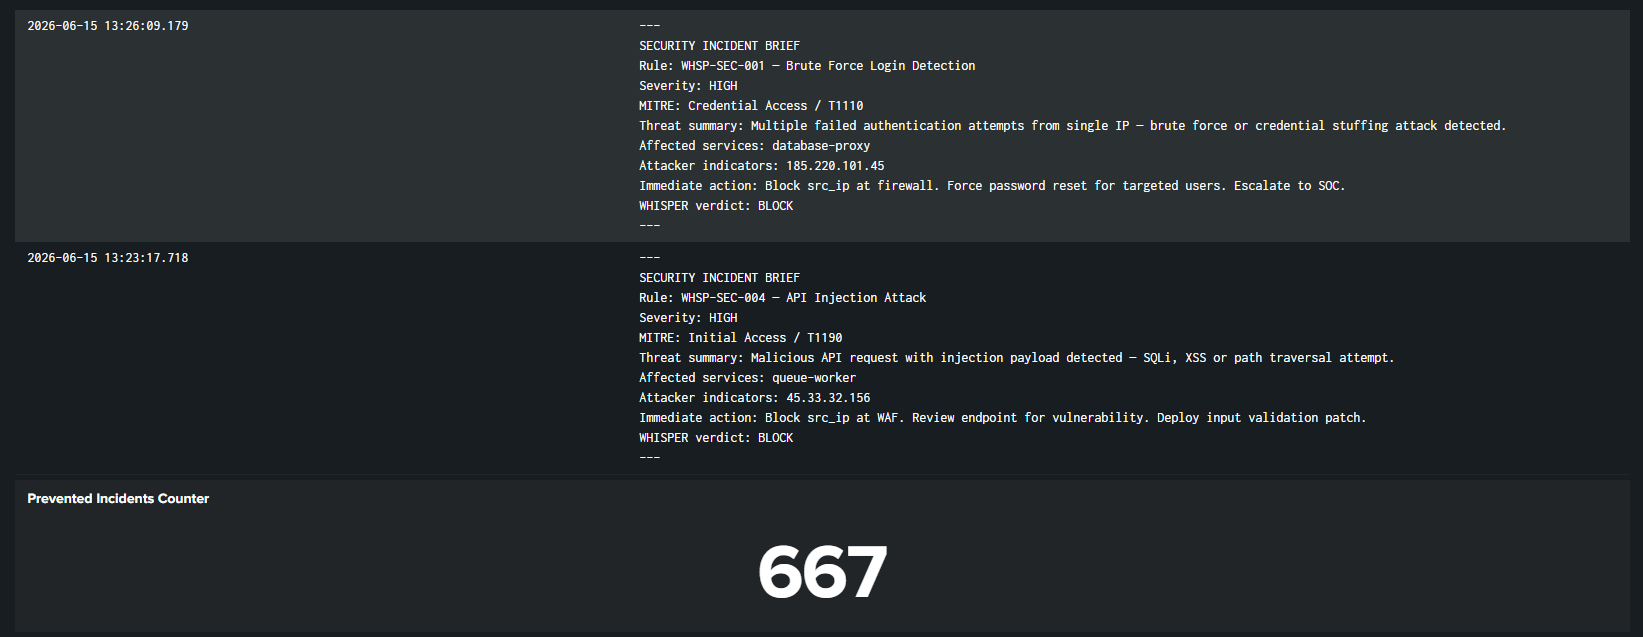
AI-generated security incident briefs mapped to MITRE ATT&CK, providing threat context and response guidance.
-
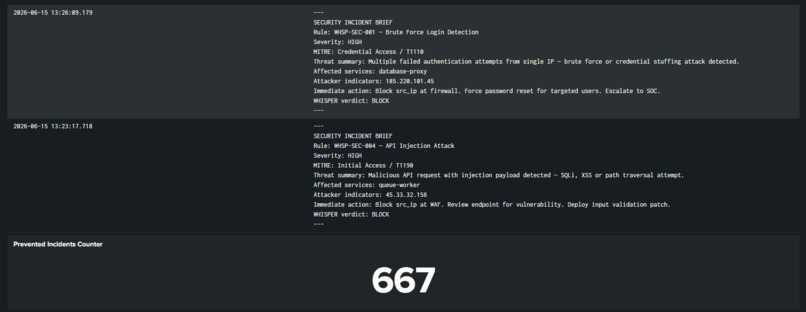
Security detections and AI-generated response briefs tracked alongside prevented incidents and operational outcomes.
-
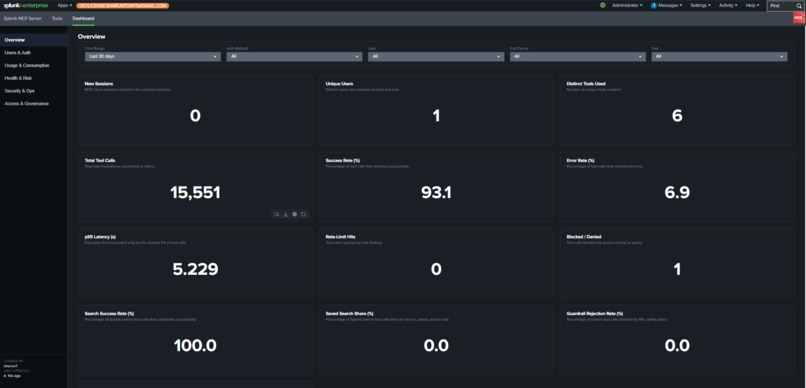
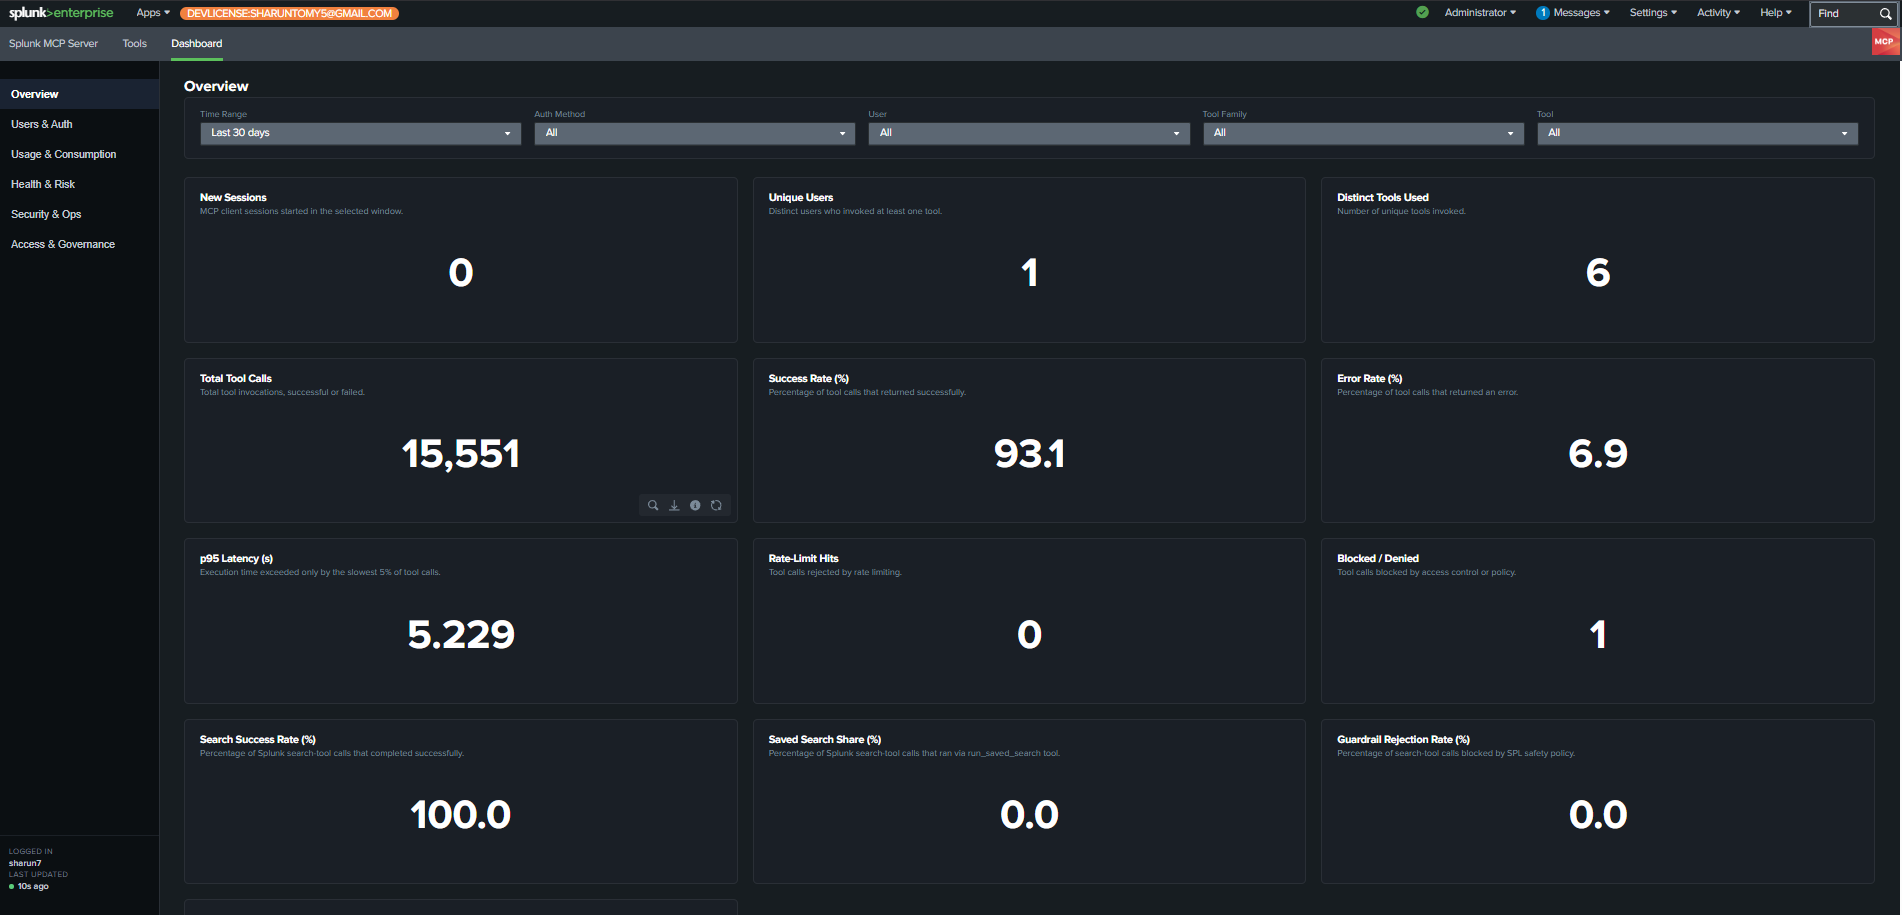
Splunk MCP Server analytics showing 15,551 tool calls, 6 tools used, and successful AI-assisted operations.
Inspiration
Every monitoring tool we've ever used follows the same broken pattern: something breaks, a threshold gets crossed, an alert fires, and then a human scrambles to figure out what happened usually at 2 AM, usually after customers have already noticed. Datadog, Dynatrace, CloudWatch, even Splunk's own standard dashboards they're all built to tell you about the past.
We kept asking ourselves: what if the system could see the trend before it became an incident? Not "CPU is at 95%, page someone" but "CPU will hit 95% in 14 minutes, here's why, and here's what to do about it." That single shift from reactive to predictive became the entire premise of WHISPER.
The name itself reflects this: a whisper is a warning that arrives quietly, before the shout. We wanted to build something that operates in that quiet window the 15 to 60 minutes before a system fails and turns that window into an opportunity instead of a blind spot.
What it does
WHISPER is a proactive, agentic observability and security platform built natively on Splunk Enterprise. It ingests live telemetry from four simulated microservices (payment-api, auth-service, database-proxy, queue-worker) and continuously runs a zero-shot forecasting engine inspired by Cisco's Deep Time Series Model that decomposes each metric into trend and seasonal components and projects 15, 30, and 60 minutes ahead with 90% confidence intervals.
When a forecast shows a metric is heading toward a critical threshold, WHISPER doesn't just fire an alert. It pulls relevant context from Splunk via the official Splunk MCP Server, sends that context to Google Gemini 2.0 Flash, and generates a structured Pre-Incident Brief: which service is at risk, what's likely causing it, how confident the prediction is, and exactly what action to take. The operator reviews this brief and approves the remediation with one click and the metric recovers in real time, before any outage actually occurs.
Beyond predictive observability, WHISPER also runs a security layer with five MITRE ATT&CK-mapped detection rules brute force login (T1110), credential stuffing (T1110.004), network port scanning (T1046), API injection (T1190), and data exfiltration (T1041) each executed as real SPL queries through Splunk's MCP Server, with Gemini generating a Security Incident Brief and a BLOCK/INVESTIGATE/MONITOR verdict for each detection.
The platform tracks four pillars of observability metrics, structured logs, distributed traces, and SLO/error-budget compliance and surfaces two headline KPIs that summarize WHISPER's entire value proposition: Effective MTTD: 15 minutes before threshold breach (we detect before the breach, not after) compared to an industry average of ~45 minutes, and Mean Time to Resolve (MTTR) of 1 minute compared to an industry average of ~120 minutes.
Every prevented incident is logged to a "Prevented Incidents Ledger" with an estimated cost-savings figure, written back to Splunk via HEC for a permanent audit trail.
For developers, WHISPER ships with a CLI tool (whisper_cli.py), a self-documenting OpenAPI spec, and an MCP Playground so anyone can query Splunk, test forecasts, inject test anomalies, or check security status from a single terminal command, and reuse WHISPER's agentic patterns in their own Splunk apps.
How we built it
WHISPER is structured in five layers.
Layer 1 - Simulators. Three Python scripts generate realistic telemetry: a metrics simulator (CPU, memory, latency, error rates with periodic degradation injection), a security events simulator (MITRE ATT&CK attack patterns brute force attempts, port scans, SQL injection payloads, large outbound transfers), and an observability simulator (structured logs, distributed trace spans with parent/child relationships, and SLO compliance events). All three push data into Splunk Enterprise via the HTTP Event Collector across eight distinct sourcetypes.
Layer 2 - Splunk Enterprise. This is the system of record. We installed Splunk Enterprise locally with a Developer License, enabled HEC, and built a custom Splunk app (splunk_app/whisper) with its own app.conf, inputs.conf, and a dashboard view. Critically, we also installed the official Splunk MCP Server app from Splunkbase and created an encrypted MCP token.
Layer 3 - The WHISPER Agent. A FastAPI application on port 8001 is the brain of the system. It contains:
- A singleton
SplunkMCPClientimplementing all 14 official Splunk MCP Server tools (splunk_run_query,splunk_get_info,splunk_get_indexes,splunk_get_metadata,splunk_get_user_info,splunk_get_knowledge_objects,splunk_run_saved_search, and the Splunk AI Assistant toolssaia_generate_spl,saia_explain_spl,saia_optimize_spl,saia_ask_splunk_question), with every call logged for auditability - A Splunk Python SDK client (
splunklib) that provisions saved searches into Splunk's knowledge object layer on startup - The CDTSM-inspired forecasting engine: OLS trend decomposition, hourly seasonal adjustment via sine wave, residual variance estimation, and confidence-interval projection — all in pure Python, with a live check for Splunk Cloud's hosted CDTSM model via
apply CDTSMand graceful fallback when unavailable - A security correlation engine running the five MITRE-mapped SPL detection rules
- A Gemini 2.0 Flash client generating both Pre-Incident Briefs and Security Incident Briefs from structured context
Layer 4 - AI Engine. Google Gemini 2.0 Flash takes forecast data, SPL query results, and MITRE rule metadata and returns a tightly-formatted brief in under two seconds, which the agent parses and displays.
Layer 5 - Consumer Layer. The dashboard is a custom glassmorphic, neon-themed UI (HTML/CSS/JS + Chart.js) showing live forecast curves with dashed prediction lines, a Co-Pilot Approvals queue, a Security Threats panel, Observability KPIs, a Degradation Injector for demos, and a Prevented Incidents Ledger with a running cost-savings counter. Alongside it, whisper_cli.py gives developers terminal access to the same data (status, forecast, slo, security, mcp-tools, inject), and /api/developer/spec exposes a full OpenAPI specification plus an MCP Playground for testing raw Splunk MCP calls.
Everything is orchestrated by run_whisper.py, a single launcher that starts all four background processes (three simulators + the agent) with health checks and unified logging.
Challenges we ran into
The biggest challenge was figuring out exactly what was real versus aspirational when it comes to "Splunk Hosted Models." We initially built our forecasting around the assumption that we could call Cisco's Deep Time Series Model directly via apply CDTSM in SPL. When we tested this against our local Splunk Enterprise instance, we got back Unknown search command 'apply' — confirming that CDTSM is currently a Splunk Cloud AI Toolkit preview feature, not available on-prem.
Rather than either abandoning the forecasting feature or falsely claiming we used a model we didn't have access to, we built our own zero-shot forecasting engine implementing the same methodology CDTSM uses - trend decomposition, seasonal adjustment, confidence intervals - entirely in Python, and added a live /api/hosted-models/status endpoint that actively probes for the real hosted model and transparently reports which engine is currently in use. We think this kind of honest, graceful-degradation design is actually a better demonstration of engineering maturity than a hardcoded claim would have been.
A related challenge was getting the Splunk MCP Server tool names exactly right early versions of our code used tool names like splunk_run_splunk_query that don't actually exist. We had to go back to Splunk's official documentation, find the correct names (splunk_run_query, saia_generate_spl, etc.), and rebuild the MCP client as a proper singleton with full call logging so we could prove — not just claim that all 14 tools were being used.
The other major challenge was integration risk. As we layered in observability (four pillars), security (MITRE detection), developer tooling (CLI, OpenAPI), and hosted-model checks on top of the original predictive core, we were adding significant surface area in a short window. We mitigated this by keeping every new feature behind its own endpoint with graceful fallbacks, testing each Splunk query directly in the Splunk search bar before wiring it into the agent, and building run_whisper.py as a single launcher with health checks so the whole system could be verified to start cleanly in one shot.
Accomplishments that we're proud of
We're proud that WHISPER isn't a mockup every panel on the dashboard is backed by a real Splunk query, a real forecast calculation, or a real Gemini API call. When the dashboard shows "MCP: Connected", that's a live counter of actual JSON-RPC calls made to localhost:8089/services/mcp during the session. When the Splunk-side dashboard shows a "Prevented Incidents Counter" of 425, those are real events indexed via HEC, queryable with standard SPL.
We're also proud of the honesty built into the architecture itself the hosted-model fallback logic, the call-logging MCP client, the clear separation between "what we built" and "what would activate automatically on Splunk Cloud." In a hackathon environment where it's tempting to overclaim integration with cutting-edge features, we chose to build something that tells the truth about its own capabilities while still demonstrating the right engineering patterns.
Finally, we're proud of the breadth-with-depth balance: WHISPER genuinely spans Observability, Security, Developer Experience, and Platform integration tracks not by bolting on disconnected features, but because each piece feeds the same core loop (predict → brief → remediate → log).
What we learned
We learned that "AI-powered" is only meaningful when the AI is doing something a human couldn't do as fast in our case, synthesizing a forecast, a Splunk query result, and a MITRE rule match into a clear, actionable brief in under two seconds. We also learned a lot about the real shape of Splunk's developer ecosystem: the difference between the REST API, the Python SDK, and the MCP Server, when each is the right tool, and how the official MCP tool names and capabilities are documented (and where they're still evolving, like the AI Assistant's saia_ tools which require separate cloud provisioning).
Perhaps most importantly, we learned that zero-shot forecasting doesn't require a massive pretrained model to be useful a well-designed trend-and-seasonality decomposition with confidence intervals, computed in milliseconds, can already provide genuinely actionable 15-60 minute predictions for operational metrics.
What's next for WHISPER
The most immediate next step is connecting WHISPER to real production telemetry instead of simulated data the architecture (HEC ingestion, MCP-based querying, forecasting, brief generation) is fully agnostic to data source, so pointing it at real application metrics, logs, and traces is primarily a configuration change.
On Splunk Cloud, WHISPER's hosted-model probe would automatically activate the real Cisco Deep Time Series Model via apply CDTSM, and we'd extend the same pattern to Splunk's Foundation AI Security Model for the security brief generation, replacing or complementing Gemini.
We'd also like to expand the MITRE ATT&CK rule library beyond the initial five techniques, add support for multi-step attack chain detection (correlating multiple low-severity events into a single high-severity campaign), and let the remediation actions go beyond simulation integrating with real infrastructure APIs (Kubernetes scaling, load balancer rerouting, database connection pool management) so "Execute Remediation" triggers an actual infrastructure change.
Finally, we want to open up the developer platform layer further publishing the workflow patterns as a starter template so other teams building on Splunk's MCP Server and AI Toolkit can adopt the same predict-brief-remediate loop for their own domains, whether that's IT operations, network operations, or security operations.
Team
Sharun Tomy
MSc Data Analytics, MG University
Designed and built WHISPER end-to-end as a solo project, including:
- Splunk Enterprise integration
- Splunk MCP Server integration
- HTTP Event Collector (HEC) data ingestion
- Predictive forecasting engine
- AI-powered incident brief generation
- Security detection workflows
- FastAPI backend services
- Interactive observability dashboard
- Developer CLI and MCP tools
- Testing and deployment


Log in or sign up for Devpost to join the conversation.