Inspiration
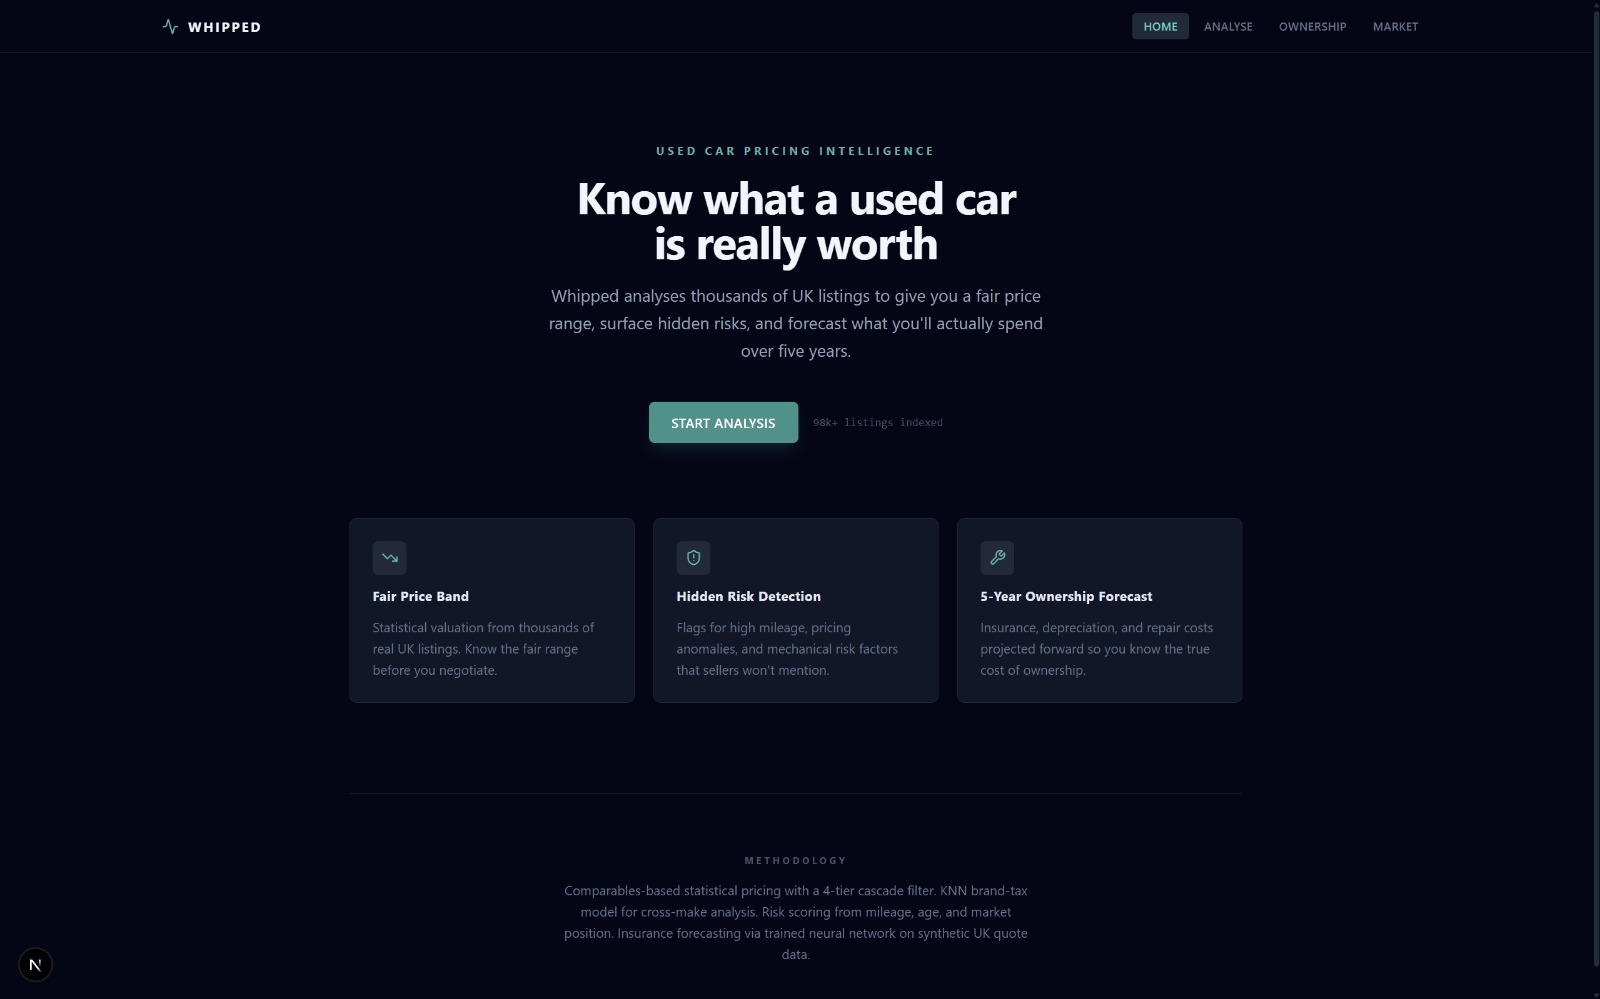
Buying a used car is one of those decisions where people get emotionally attached before they have enough evidence. A low price, a glossy listing, or a desirable badge can make buyers ignore red flags and overpay. That is where the name Whipped comes from: a whip is slang for a car, and being whipped means being so sold on something that you stop thinking clearly.
We wanted to build a tool that helps buyers step back and make a decision based on evidence rather than emotion. Instead of asking "does this listing look good?", Whipped asks a better question: is this car actually a buy, a negotiation target, or a trap?
What it does
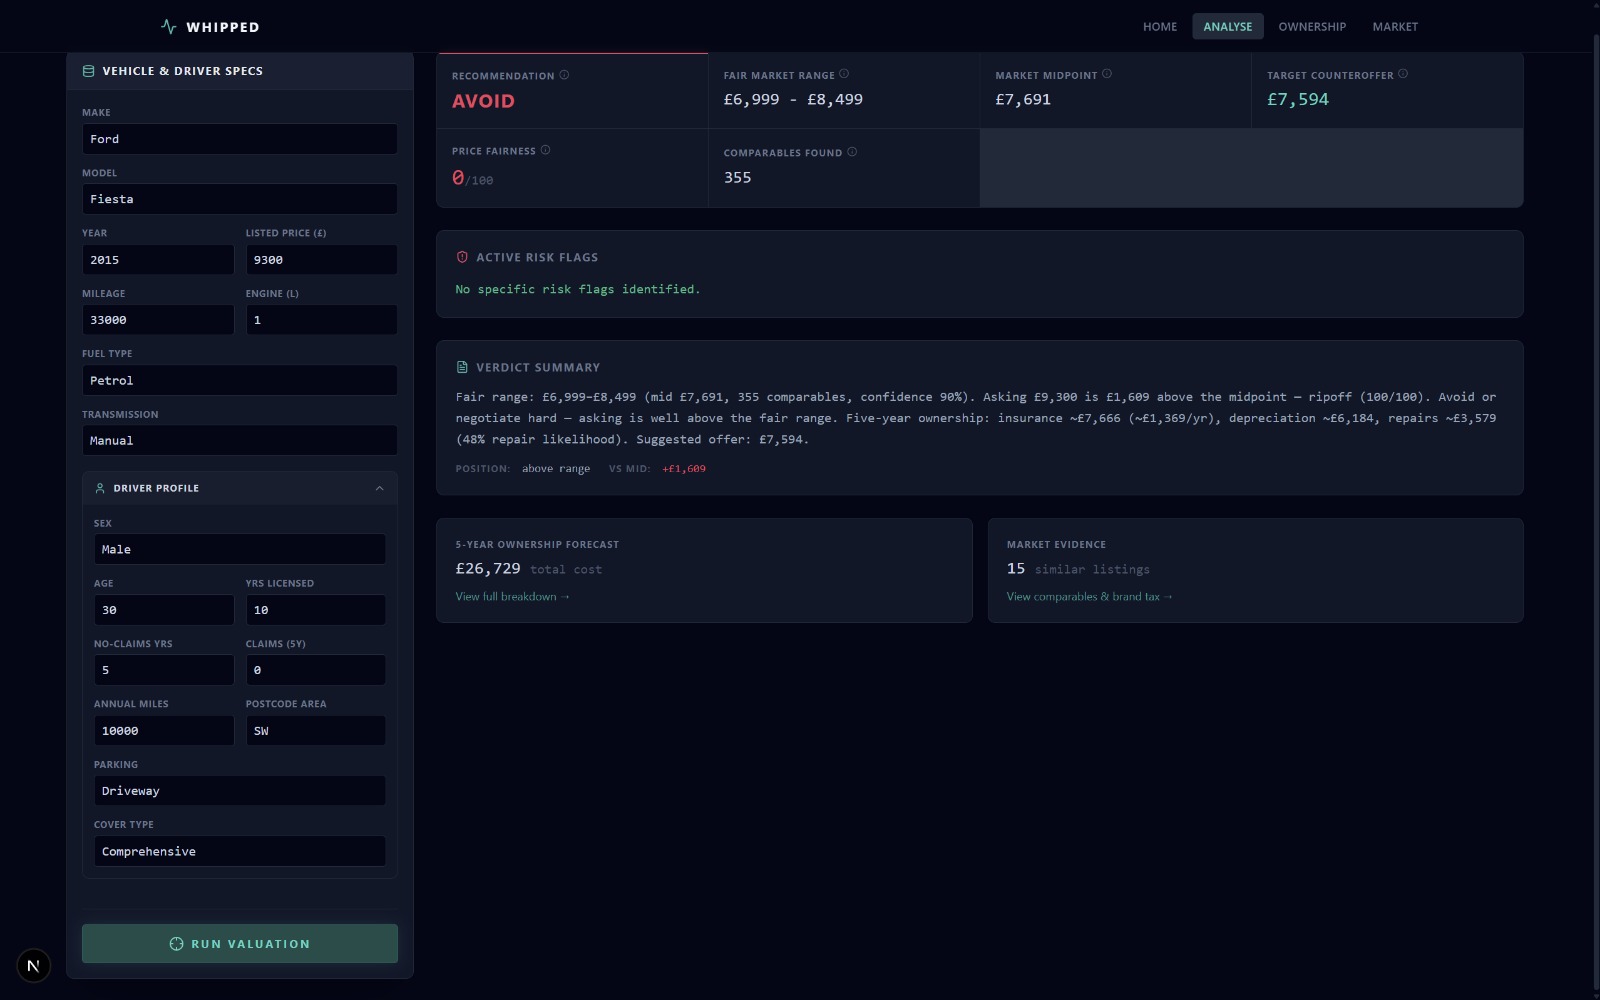
Whipped is a UK used-car pricing intelligence engine. A user enters a car listing and an optional driver profile, and Whipped returns:
- a fair price band (25th–75th percentile of comparable listings)
- a market midpoint (median of comparables)
- a price fairness score (0–100, where 100 is a bargain)
- a risk assessment with specific flags (high mileage, pricing anomalies, sparse data, etc.)
- a recommended action: strong buy, negotiate, or avoid
- a suggested counteroffer (when confidence and comparables are sufficient)
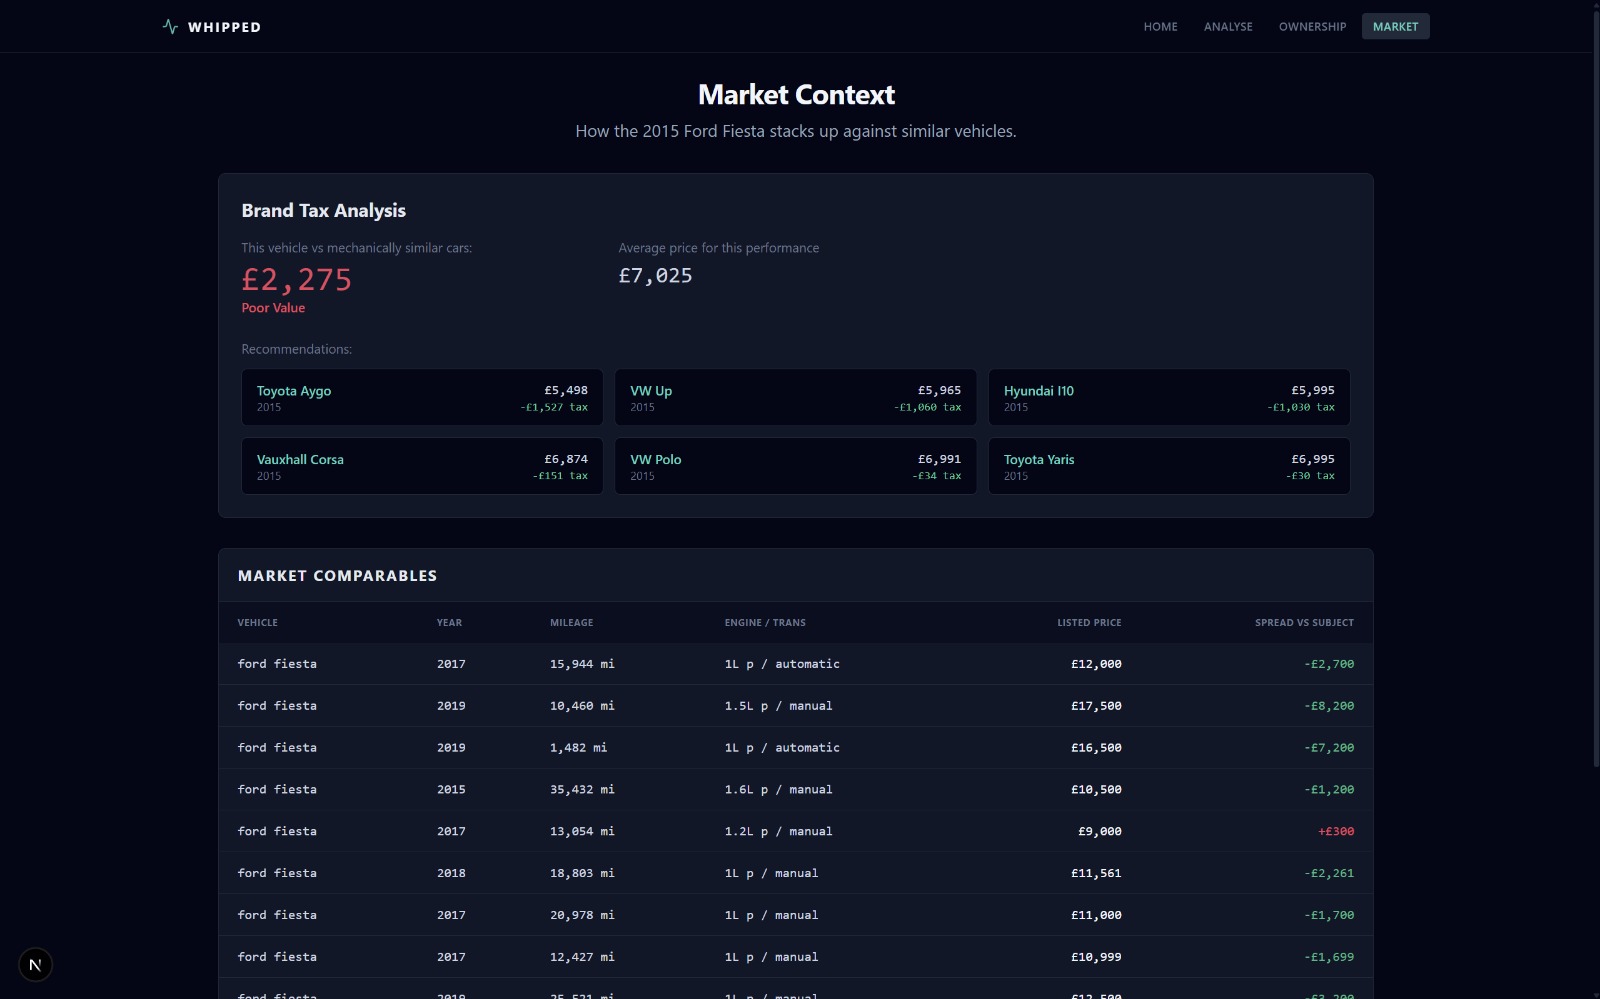
- a brand tax analysis showing how much extra (or less) you pay for the badge vs mechanically similar cars from other makes
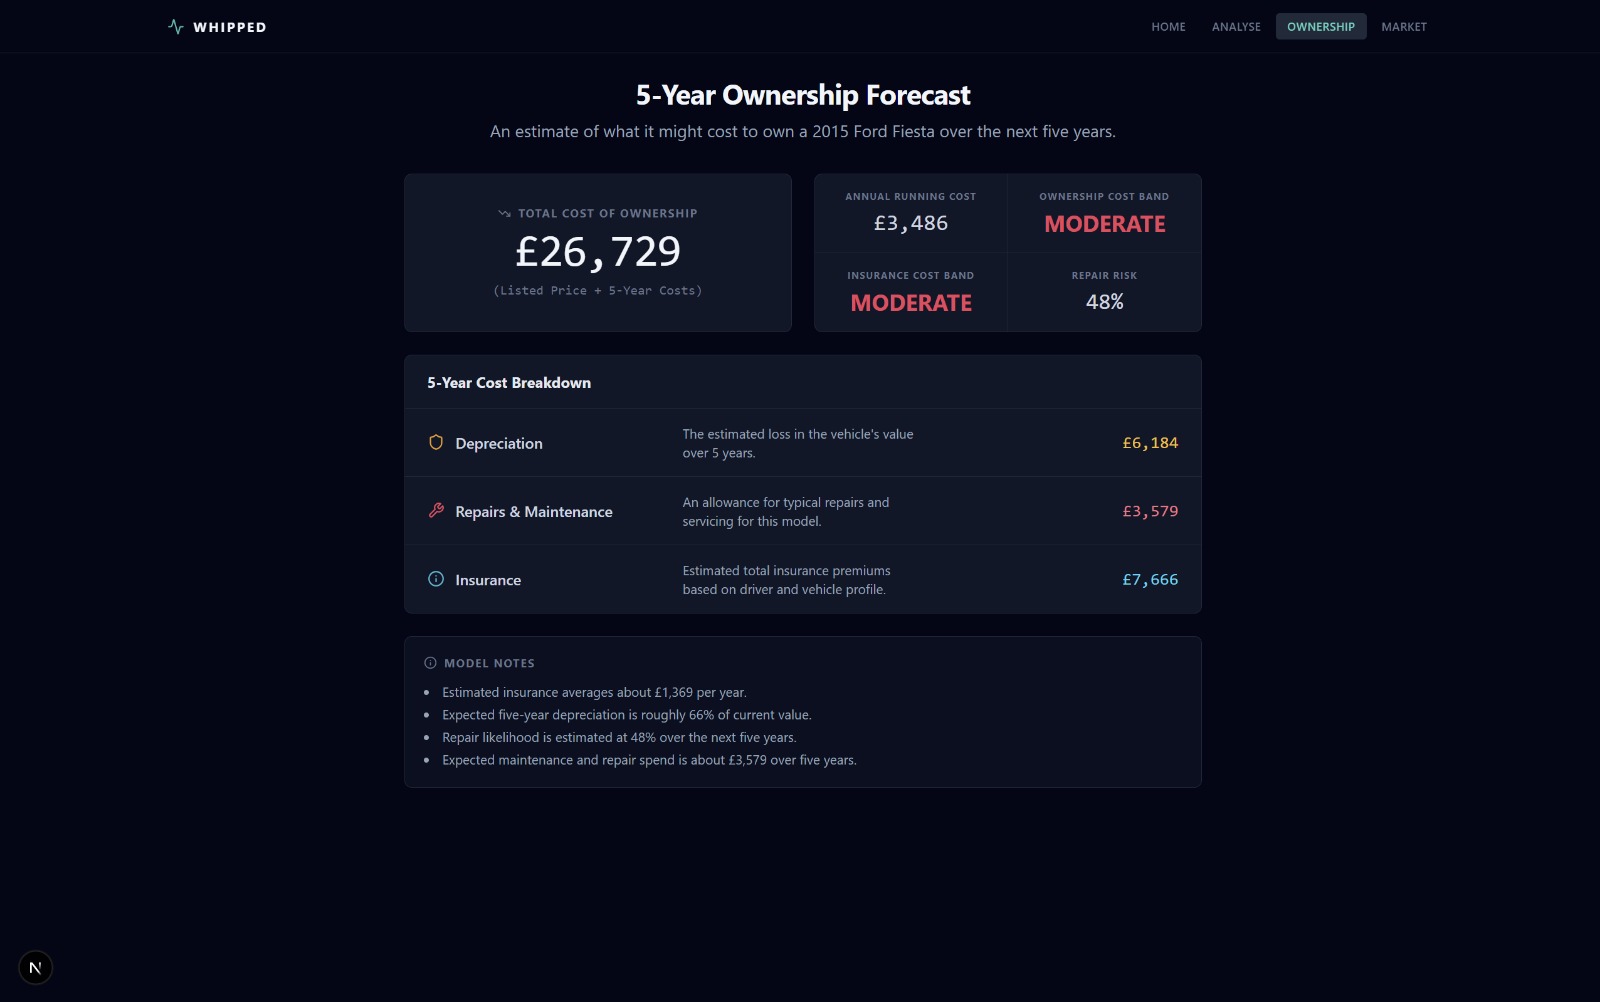
- a 5-year ownership forecast covering insurance, depreciation, and repairs
The goal is not just to estimate a price. It is to help someone make a better purchase decision.
How we built it
Comparables-based pricing
We built Whipped around a comparables-based pricing engine rather than a black-box price regressor. For each target listing, we search a pool of real UK used-car listings and match comparable vehicles through a 4-tier cascade:
- same make, model, year $\pm 1$, mileage $\pm 15\%$, same fuel type and transmission
- same make, model, year $\pm 2$, mileage $\pm 20\%$, no fuel/transmission requirement
- same make, model, year $\pm 3$, mileage $\pm 30\%$, no fuel/transmission requirement
- same make, model, year $\pm 4$, no mileage filter
We stop at the first tier that yields at least 5 comparables. From the matched price distribution, we compute:
- lower bound = 25th percentile
- midpoint = median
- upper bound = 75th percentile
If no tier reaches 5 matches, we fall back to the best sparse result (the tier with the most matches), with confidence capped at $20\%$.
Confidence scoring
Each valuation carries a confidence score derived from match count, price spread, and tier quality:
$$ C = 0.05 + 0.45\,C_{\text{count}} + 0.30\,C_{\text{spread}} + 0.20\,C_{\text{tier}} - P_{\text{missing}} $$
where
$$ C_{\text{count}} = \min!\left(1,\frac{n}{20}\right), \qquad C_{\text{spread}} = \max!\left(0,\,1 - \frac{\text{spread_ratio}}{0.6}\right), $$
and $C_{\text{tier}}$ ranges from $1.0$ (tier 1) down to $0.55$ (tier 4). $P_{\text{missing}}$ penalises absent fields, up to $0.30$.
Sparse results are hard-capped at $0.20$ confidence. This lets Whipped be honest when the evidence is weak: counteroffers are suppressed when confidence falls below $30\%$ or when fewer than 8 comparables are available.
Ripoff detection and risk assessment
We separate price fairness from risk. A car can be cheap but still risky, or expensive but mechanically safer.
The ripoff index maps the asking price's position within the fair range to a 0–100 scale and assigns a band: bargain, good deal, fair, overpriced, or ripoff. Risk is assessed independently through a set of specific flags—high mileage per year, very high total mileage, old age, undisclosed fields, sparse comparables, wide price spread, and suspiciously low pricing. Each flag adds 20 points to the risk score (baseline 5, capped at 100).
Brand tax analysis
We built a KNN-based cross-make model to answer: "how much am I paying for the badge?" For a given listing, we find its mechanical twins—vehicles from different makes within 1 year, matched on a normalised 6-feature vector:
- engine size
- mileage
- year delta
- fuel type match (binary)
- transmission match (binary)
- body type match (binary)
We take the 5 nearest neighbours by Euclidean distance in normalised feature space. The difference between the target's asking price and the average twin price is the brand tax. Whipped also surfaces up to 12 cheaper alternatives from the same mechanical neighbourhood as purchase recommendations.
Insurance forecasting
For the 5-year ownership forecast, we trained a 2-layer neural network (ReLU activation, 800 epochs, MSE loss) implemented in pure NumPy—no PyTorch or scikit-learn. The model takes 12 numeric features (driver age, years licensed, no-claims years, claims history, annual mileage, vehicle year, age, price, mileage, engine size, condition score) and 9 categorical features (sex, make, model, fuel type, transmission, body type, postcode area, parking type, cover type), one-hot encoded.
It is trained on 6,000 synthetic UK insurance quotes generated from a distribution model that accounts for age loading, postcode risk, no-claims discounts, and vehicle profile. When a trained model is not available, Whipped falls back to a rule-based heuristic with configurable loadings for fuel type, body type, engine size, postcode area, parking, and driver age.
Ownership projection
The 5-year total cost of ownership combines:
- Insurance: 5 years of the annual premium estimate, with a $12\%$ inflation factor
- Depreciation: base rate of $38\%$, adjusted for vehicle age ($+1.5\%$/yr, capped at $+22\%$), mileage (up to $+12\%$), and fuel type (diesel $+6\%$, electric $+3\%$, hybrid $-2\%$), clamped between $20\%$ and $82\%$
- Repairs: expected major repair cost (based on vehicle value and repair risk), plus wear-and-tear (base £900 $+ £120$/yr of age $+$ up to £1,400 from mileage), plus a risk loading
Repair risk itself is estimated from age, mileage, and risk score, ranging from $10\%$ to $95\%$.
Data pipeline
We used a real Kaggle UK used-car dataset covering 9 makes (Ford, Vauxhall, BMW, Mercedes, Audi, VW, Toyota, Hyundai, Skoda) with validation filters rejecting listings below £500, outside 1990–present, or above 500,000 miles. The ingestion pipeline normalises column names, derives make from filename, and produces a clean comparables pool.
On the frontend, we built a multi-page Next.js 15 interface with React Context for shared state, so the valuation, ownership forecast, and market evidence each have their own focused view.
Challenges we ran into
One of the biggest challenges was that our early synthetic sample data produced obviously nonsensical outputs, including negative price ranges and absurd counteroffers. That forced us to rethink our validation and confidence guardrails much earlier than expected.
We also ran into the classic problem of balancing feature ambition against clarity. It was tempting to keep adding modules, but we realized quickly that a hackathon project scores better when the core flow is tight and defensible.
Another challenge was data quality and comparables density. Some segments of the market have plenty of clean matches, while others become sparse much faster. That meant we had to design Whipped to abstain gracefully—suppressing counteroffers, capping confidence, and flagging sparse data—instead of pretending it always knows the answer.
Finally, we had to coordinate quickly as a team: version control, dataset syncing, frontend/backend integration, and getting everyone working on parallel branches without breaking the demo.
Accomplishments that we're proud of
- Building a valuation engine on top of real UK used-car data covering 9 makes and $\sim 98{,}000$ listings
- Using an interpretable comparables-based method with an explicit 4-tier cascade instead of hiding behind a black box
- Adding confidence-aware behaviour: counteroffers require $\ge 30\%$ confidence and $\ge 8$ comparables; sparse results are hard-capped at $20\%$ confidence
- Separating price fairness (how the asking price compares to the market) from risk assessment (what could go wrong with the car itself)
- Building a KNN brand-tax model that answers a question most pricing tools ignore: "am I paying for the car or the badge?"
- Training a neural network for insurance estimation using only NumPy
- Extending the tool beyond sticker price into a 5-year ownership cost projection
- Designing a frontend that presents valuation, ownership, and market evidence as three distinct, focused views
What we learned
The biggest lesson was that interpretability matters. It is easy to produce a number; it is much harder to produce a number that a user can trust and defend. Comparables-based pricing turned out to be much better for this use case than a rushed black-box model.
We also learned that confidence and abstention are underrated product decisions. A good tool should not just answer questions—it should know when its evidence is weak and say so.
On the engineering side, we learned how much fast iteration depends on clean internal contracts, good branch discipline, and aggressively scoping to the most important path through the product.
More broadly, we learned that a used-car buying tool becomes much more compelling when it goes beyond "cheap or expensive" and starts answering "should I buy this?"
What's next for Whipped
The most immediate improvements would be:
- DVLA / DVSA enrichment for vehicle history and MOT signals
- broader make and model coverage beyond the current 9 makes
- better handling of sparse-data segments with adaptive tier widening
- richer repair and insurance features using real quote data instead of synthetic
- user-uploaded listings and saved comparisons
- dealership or marketplace integrations
Longer term, we think Whipped could become a consumer tool that helps buyers avoid expensive mistakes by combining market evidence, risk awareness, and ownership intelligence in one place.
In short: we do not want people to get whipped by the listing. We want them to use Whipped before they buy.

Log in or sign up for Devpost to join the conversation.