-

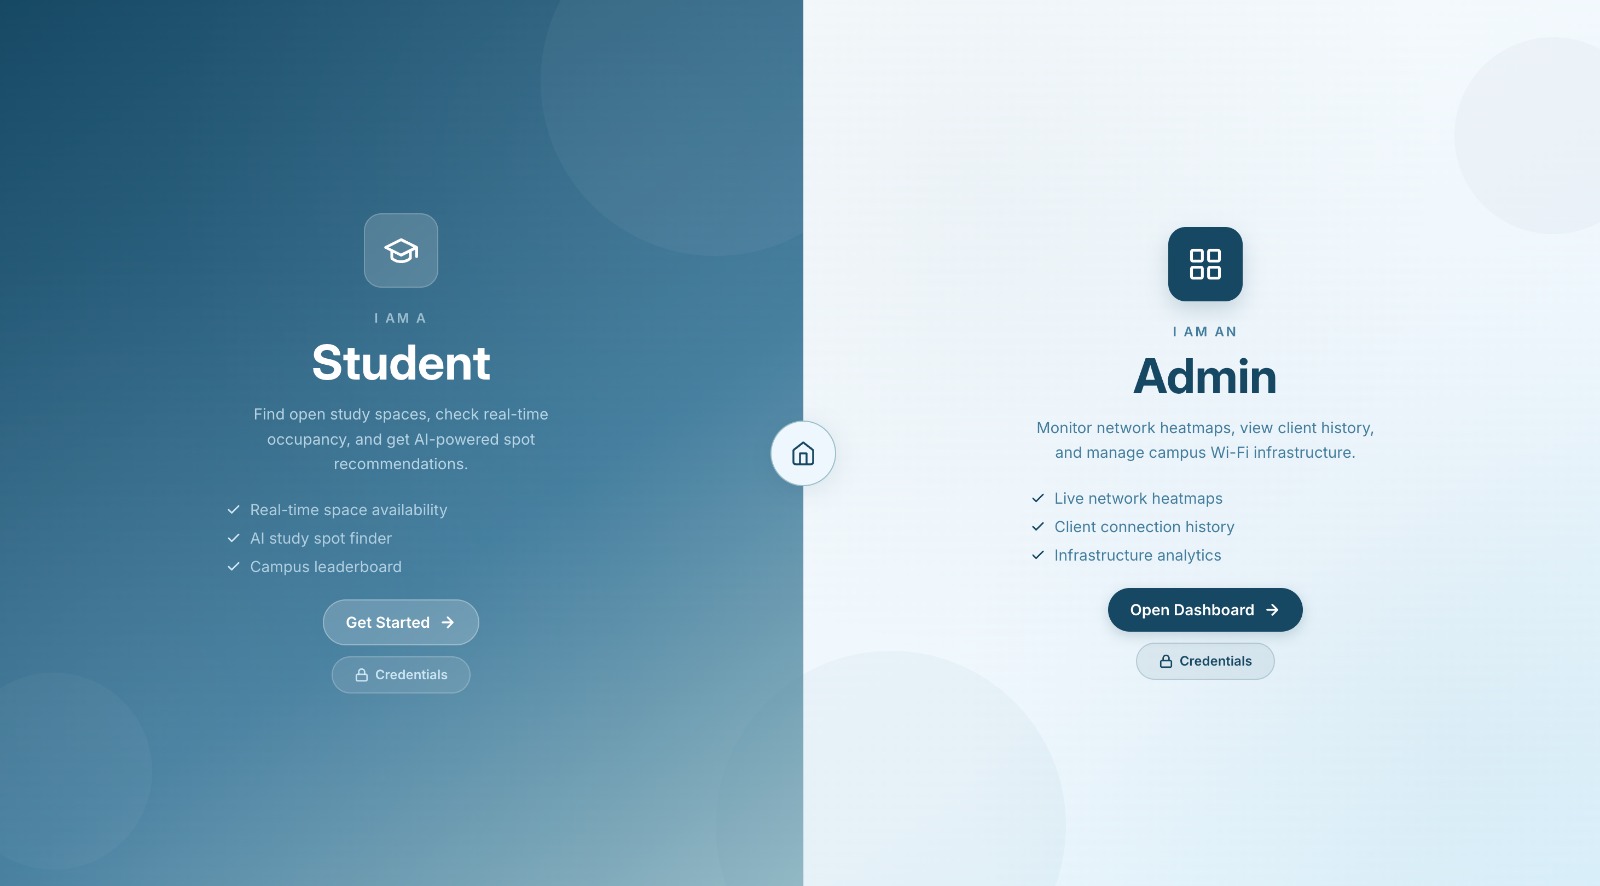
Login Page
-
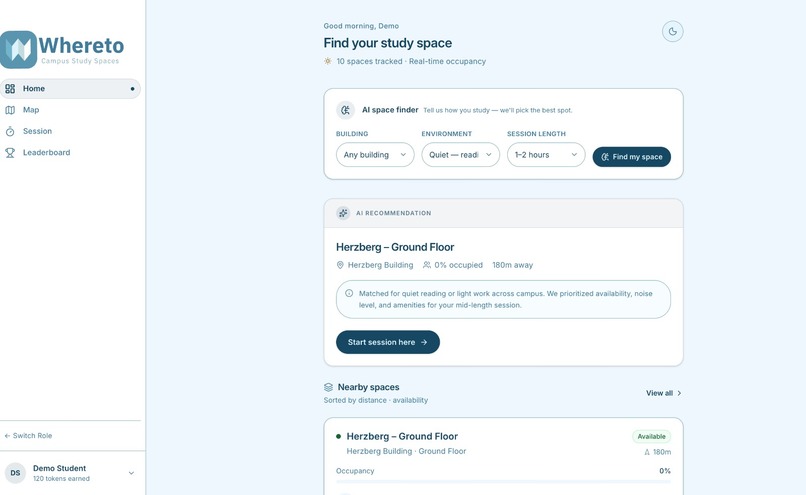
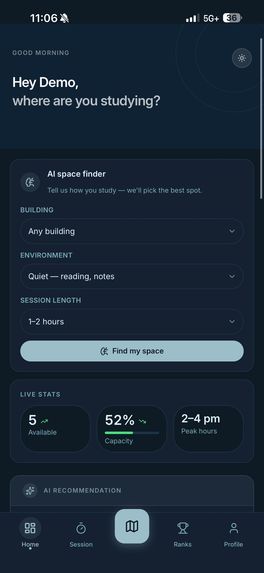
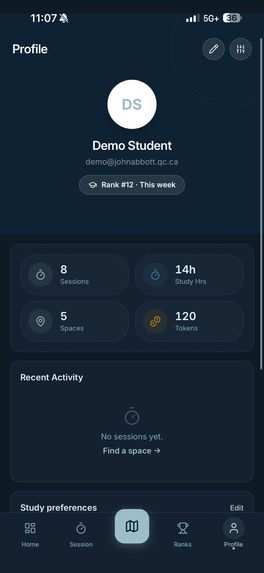
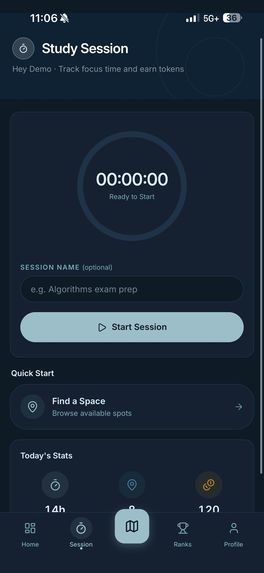
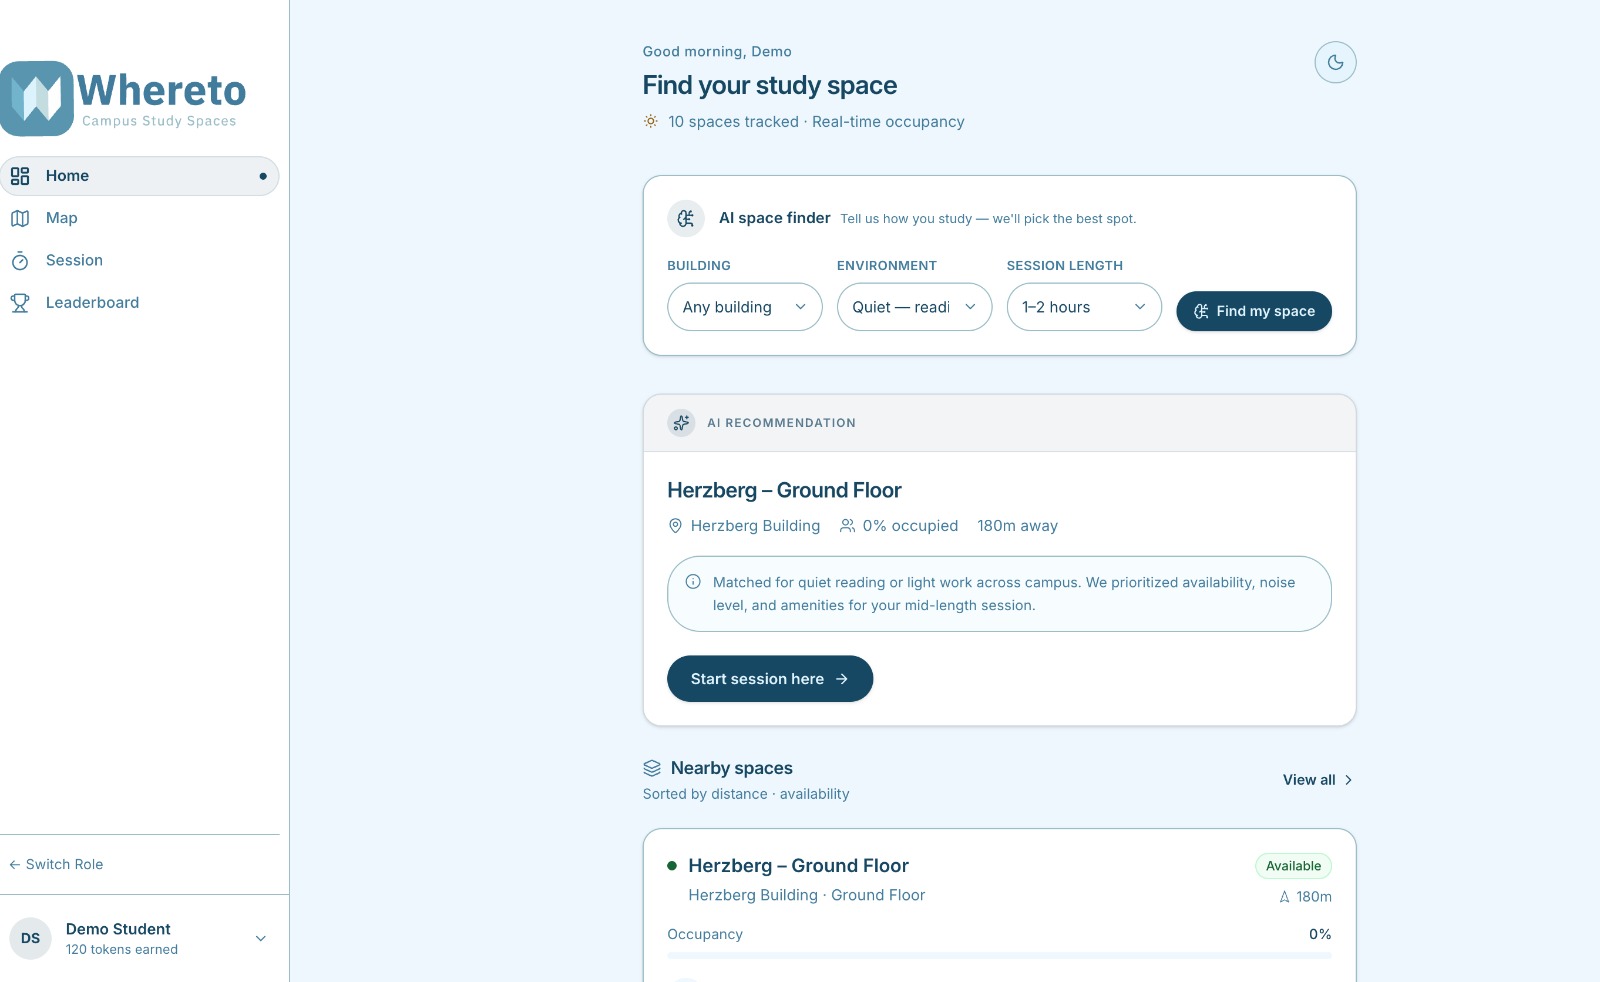
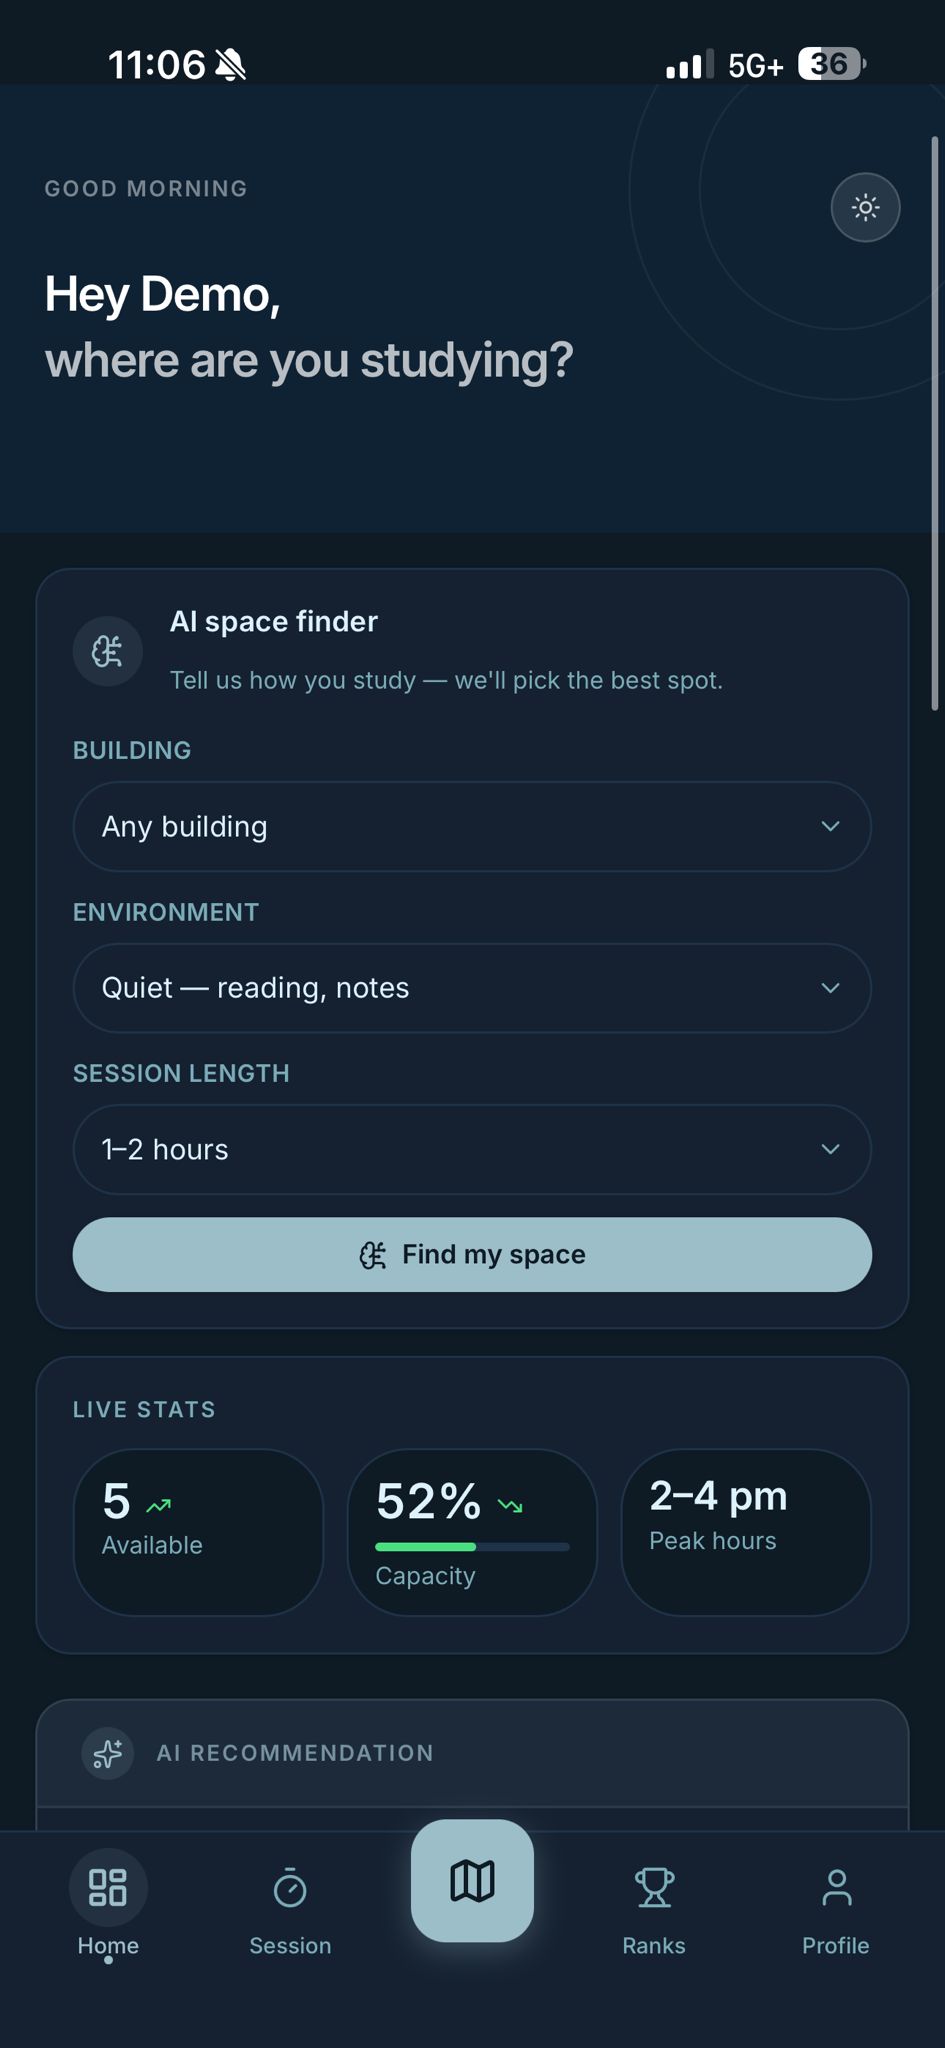
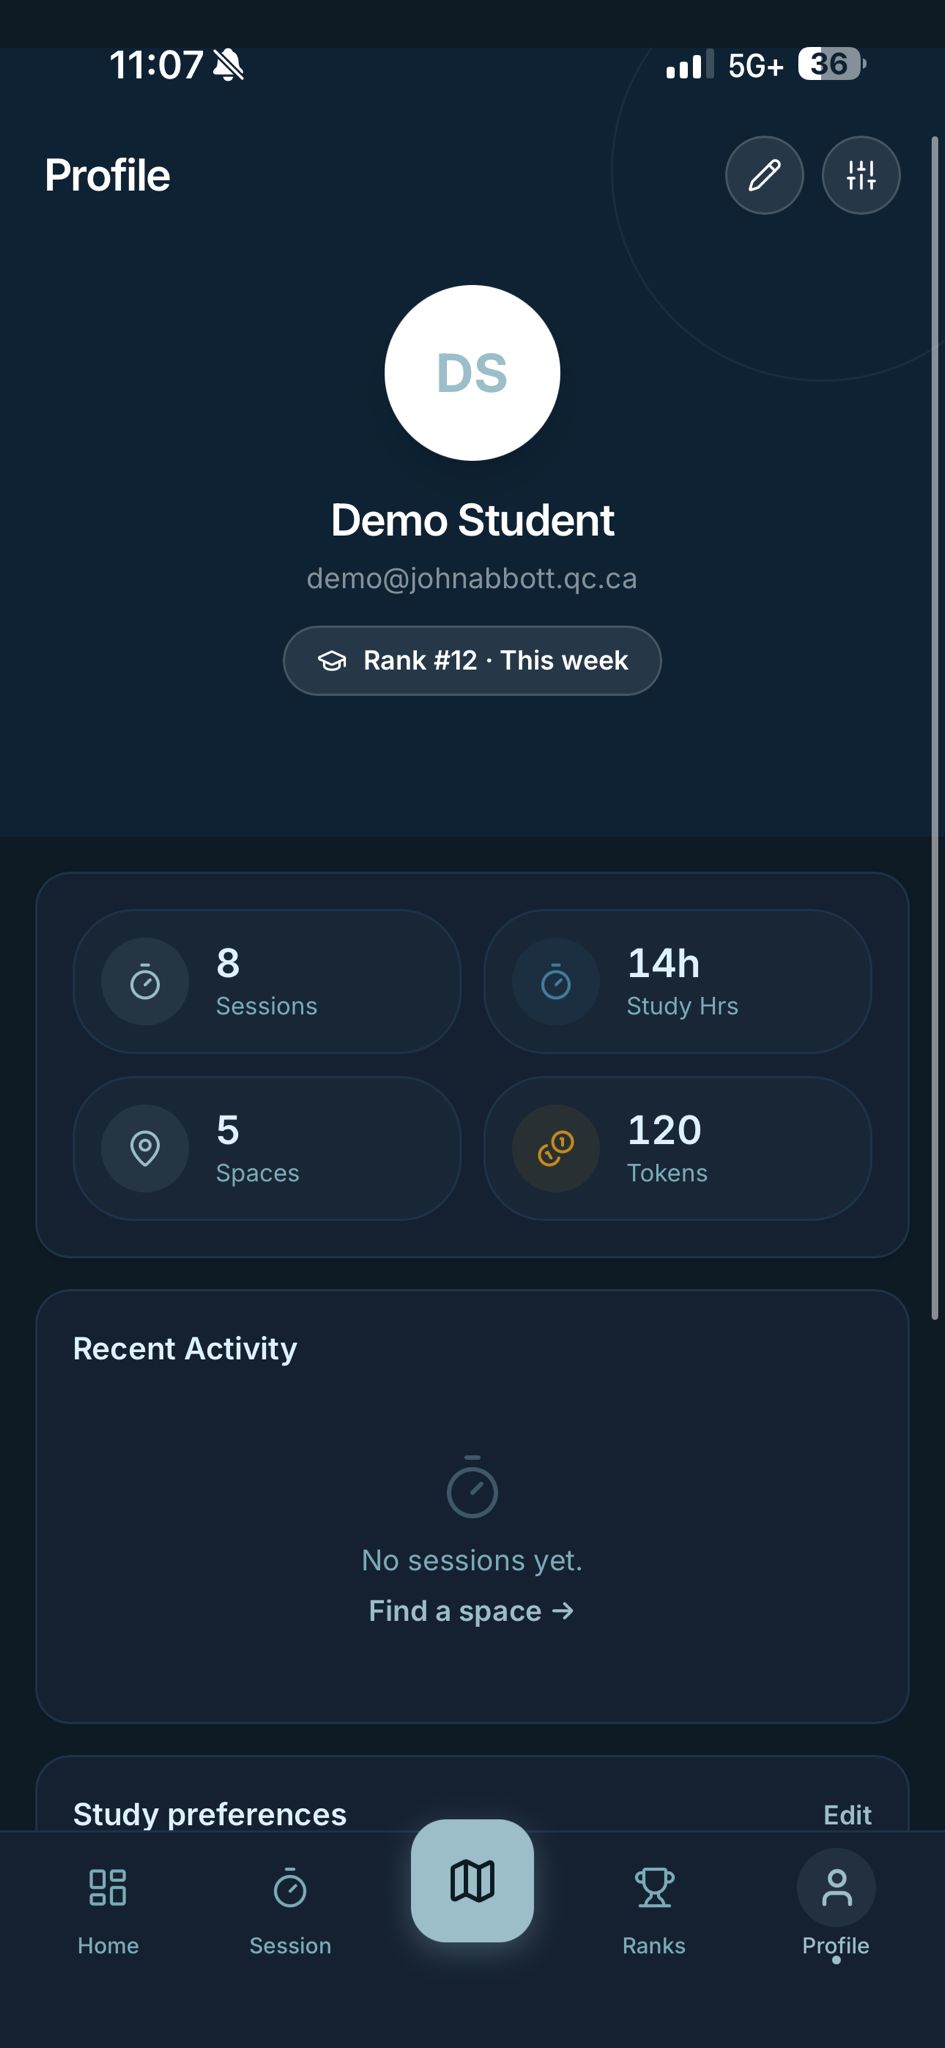
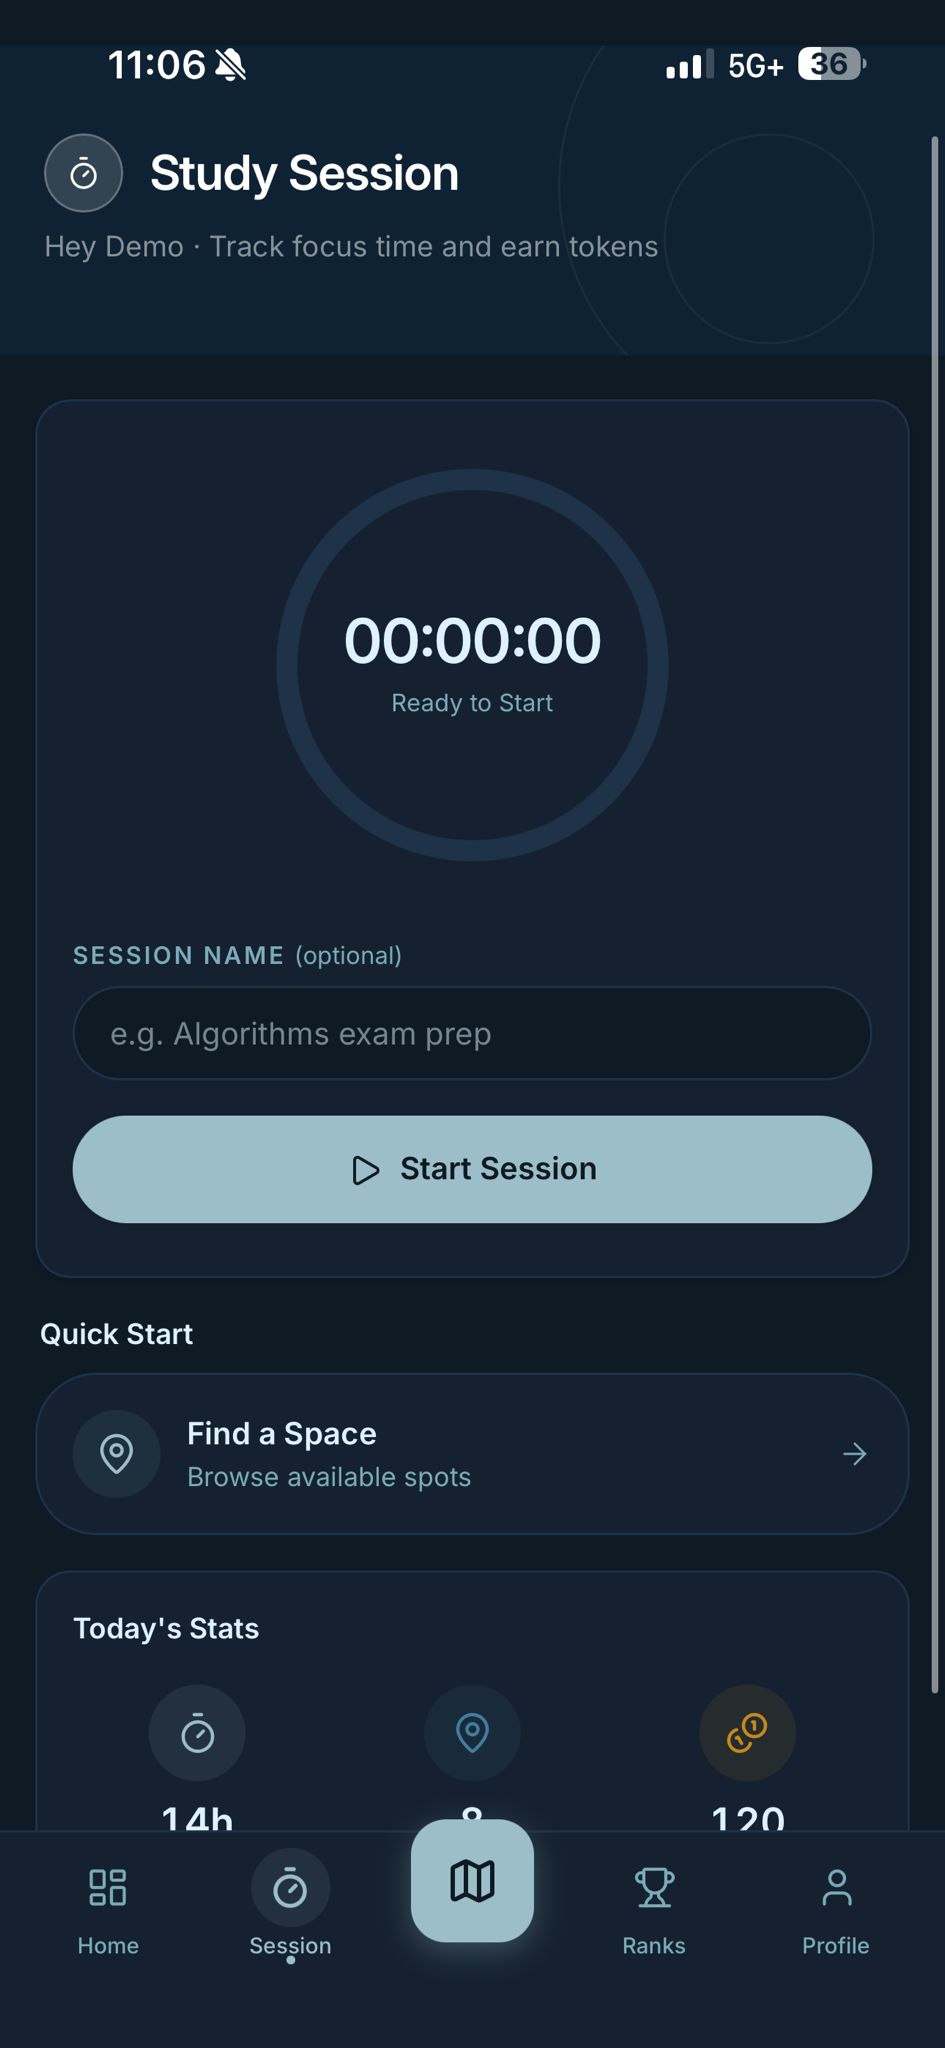
Student Dashboard
-
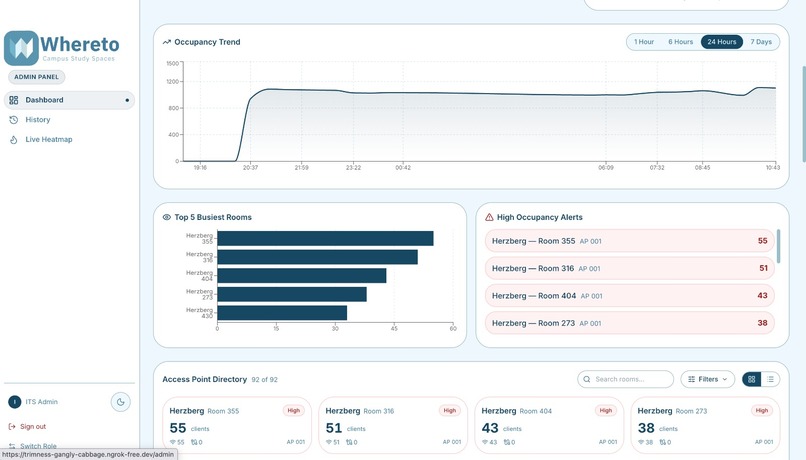
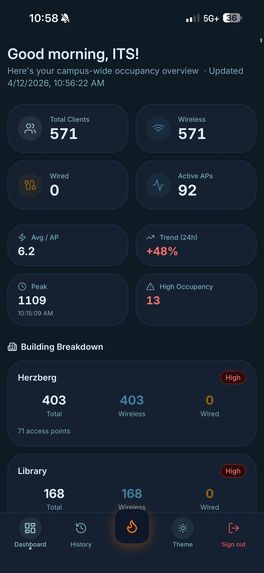
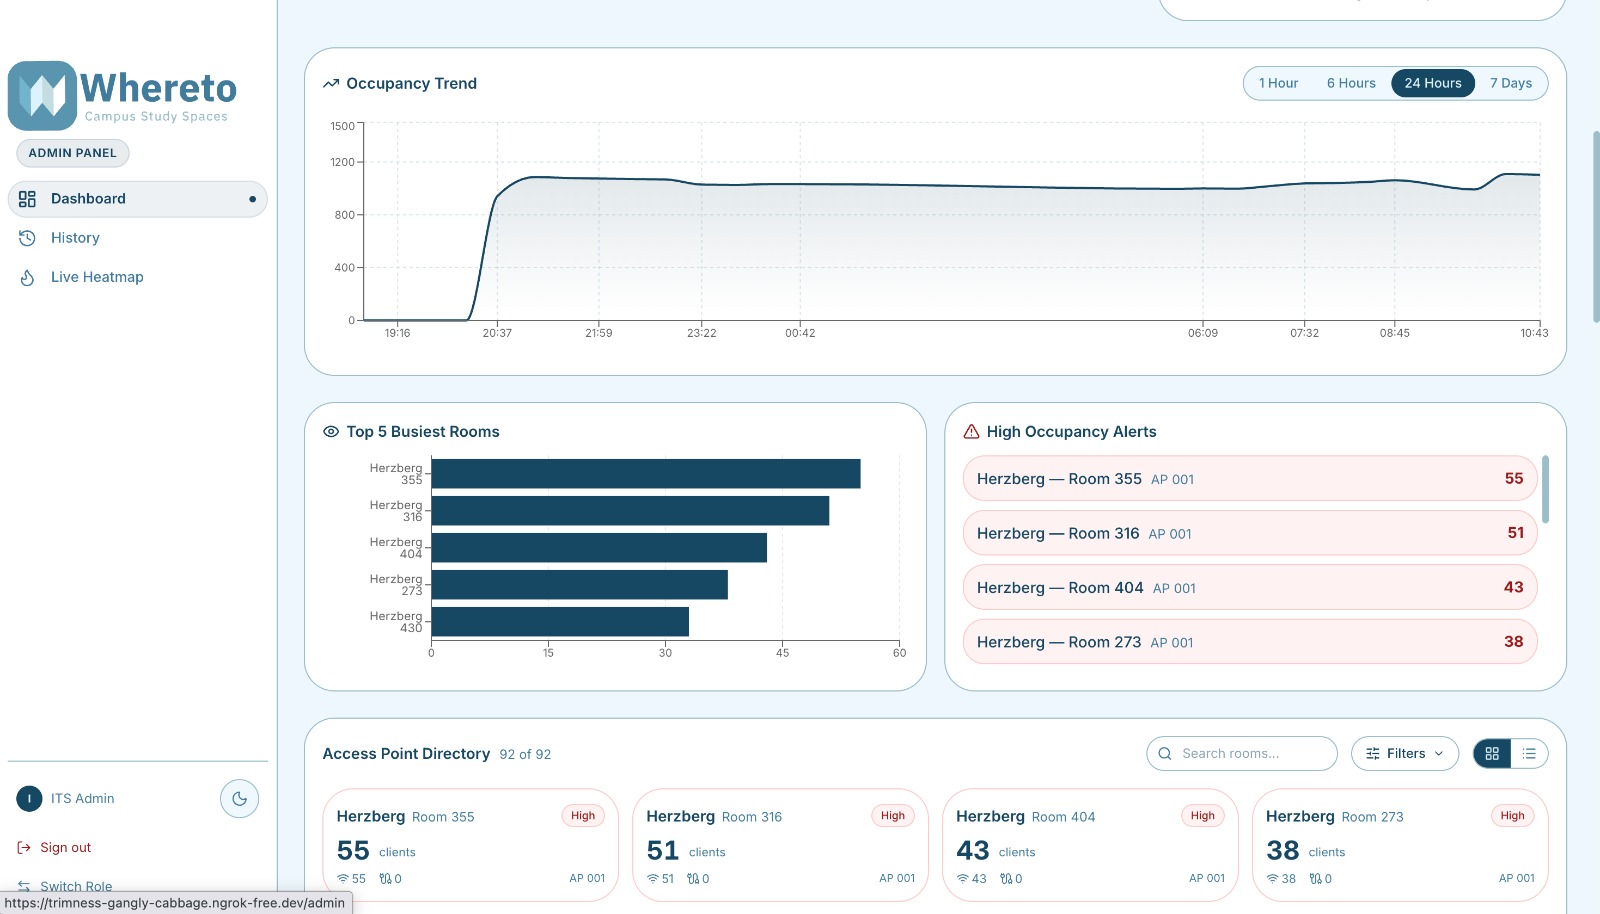
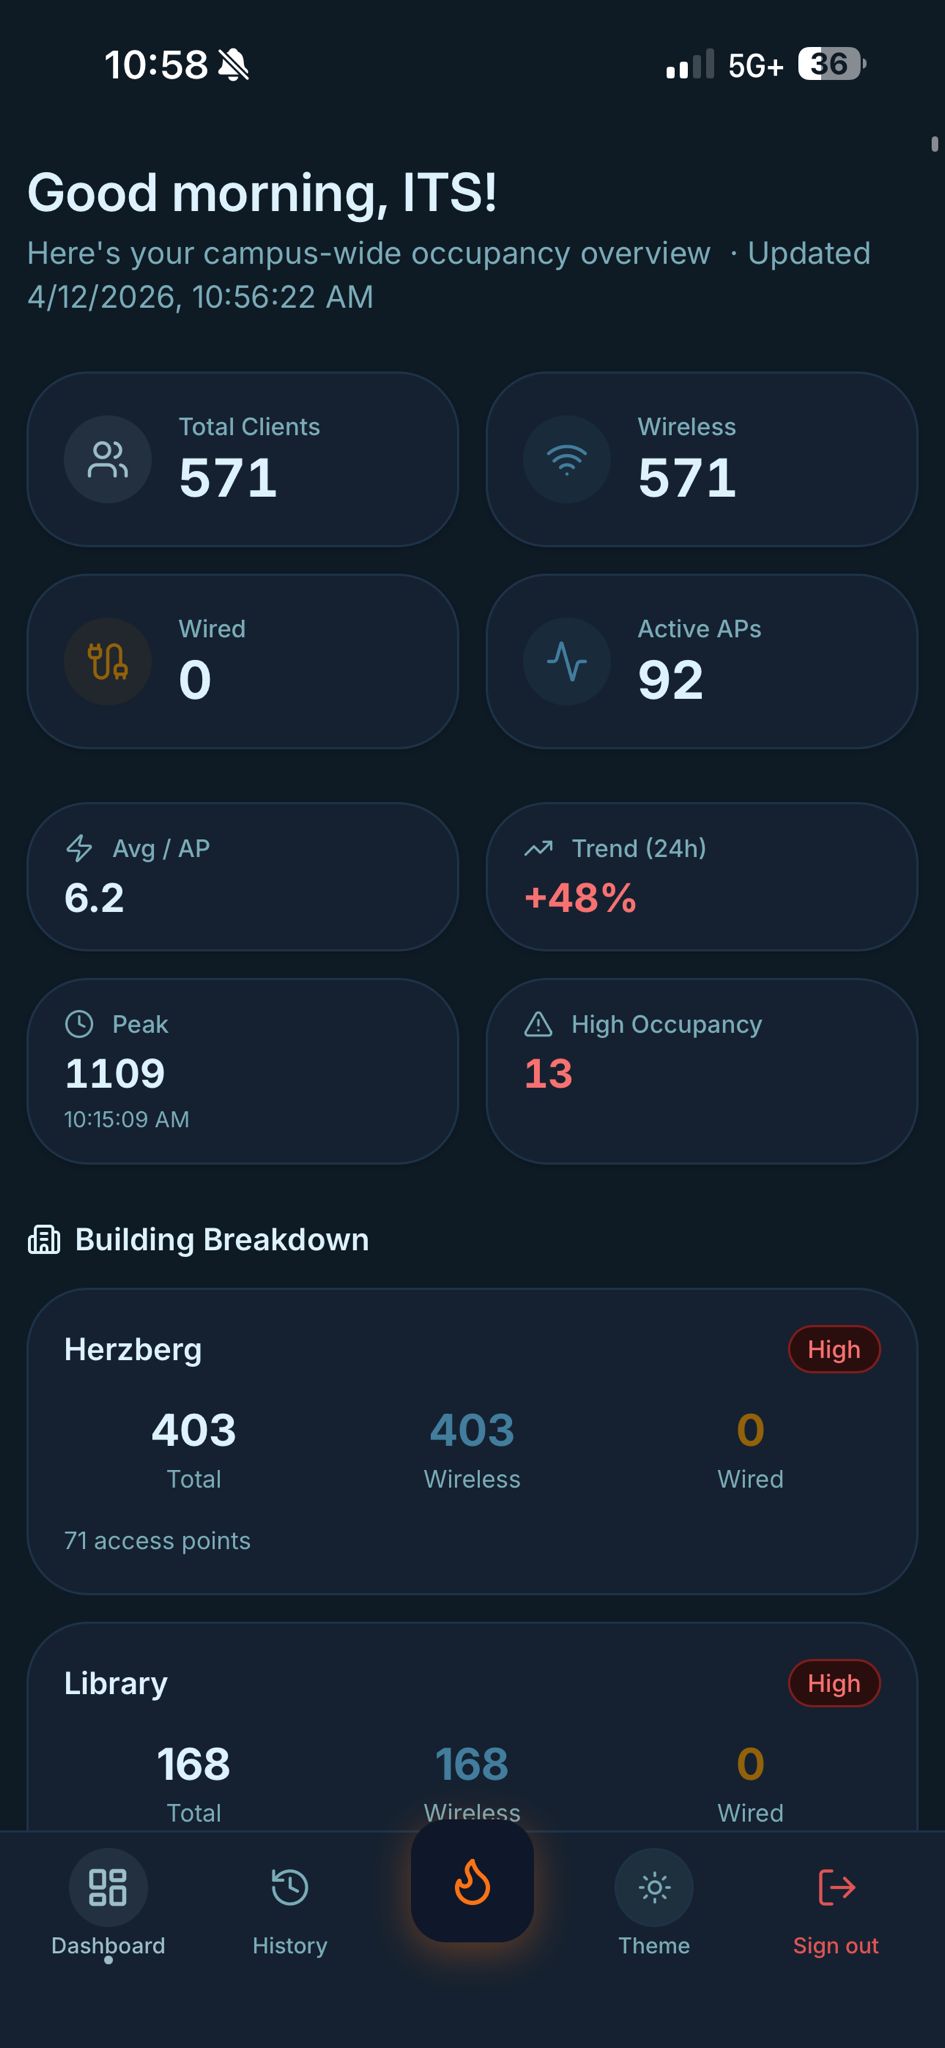
Admin Dashboard
-
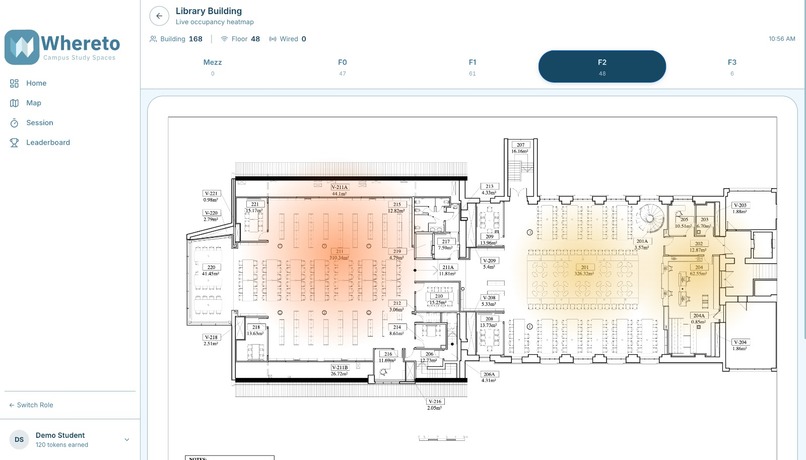
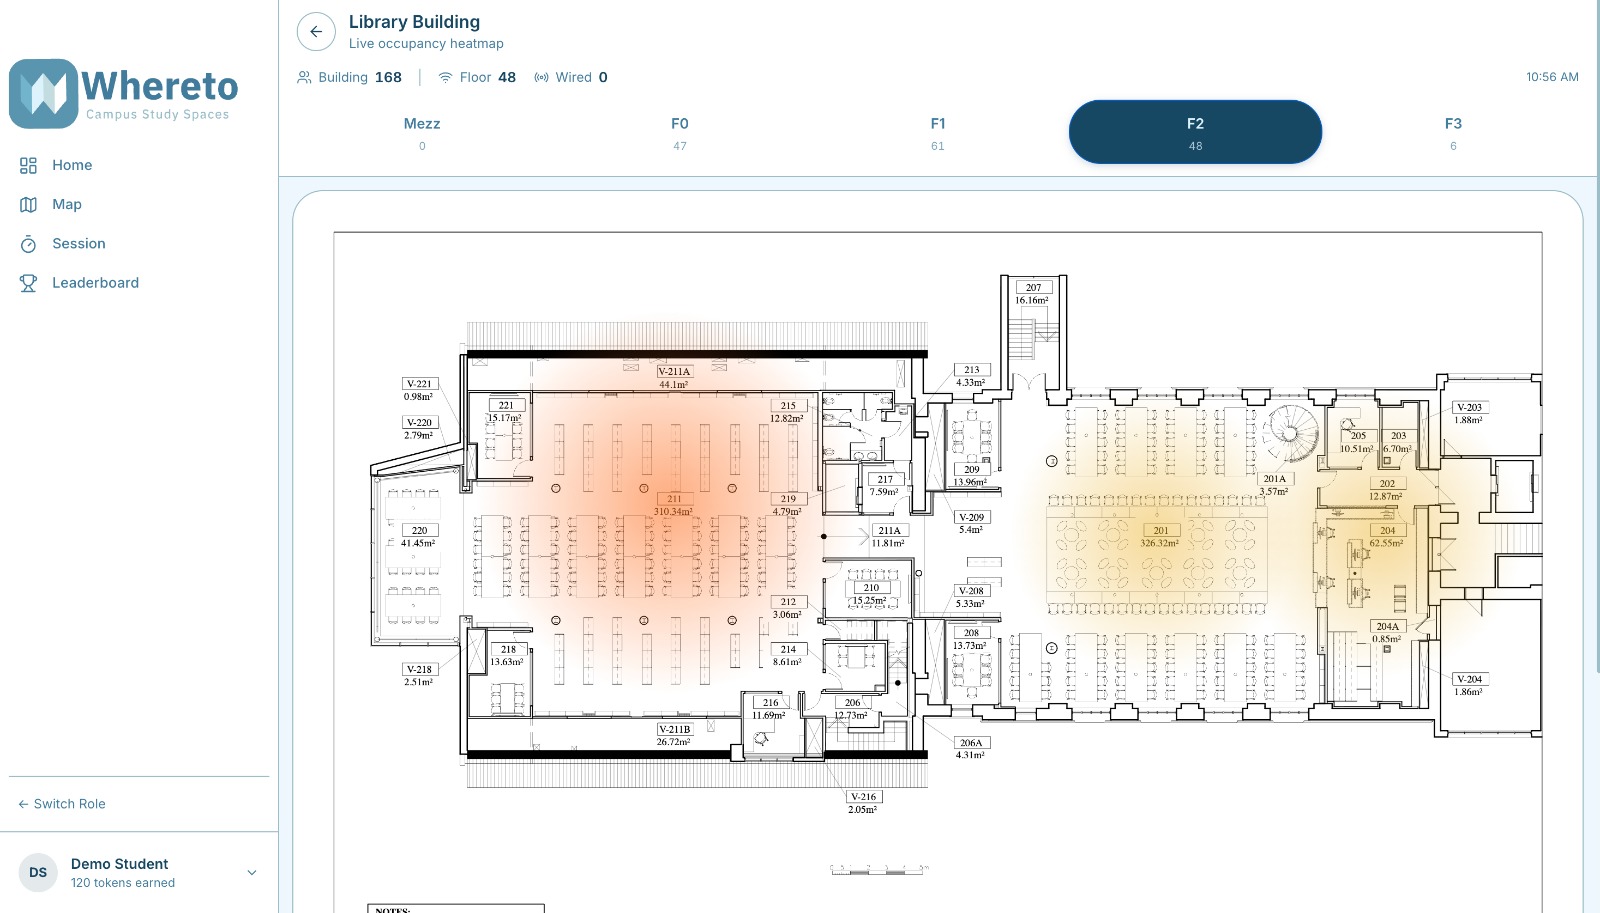
Heatmaps
-
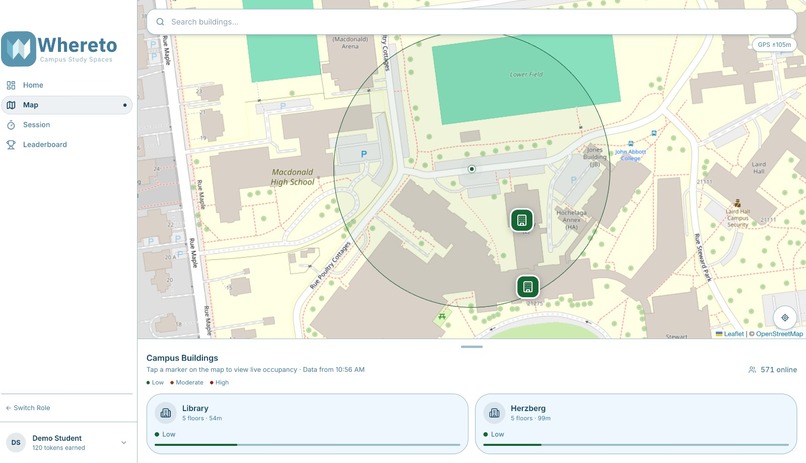
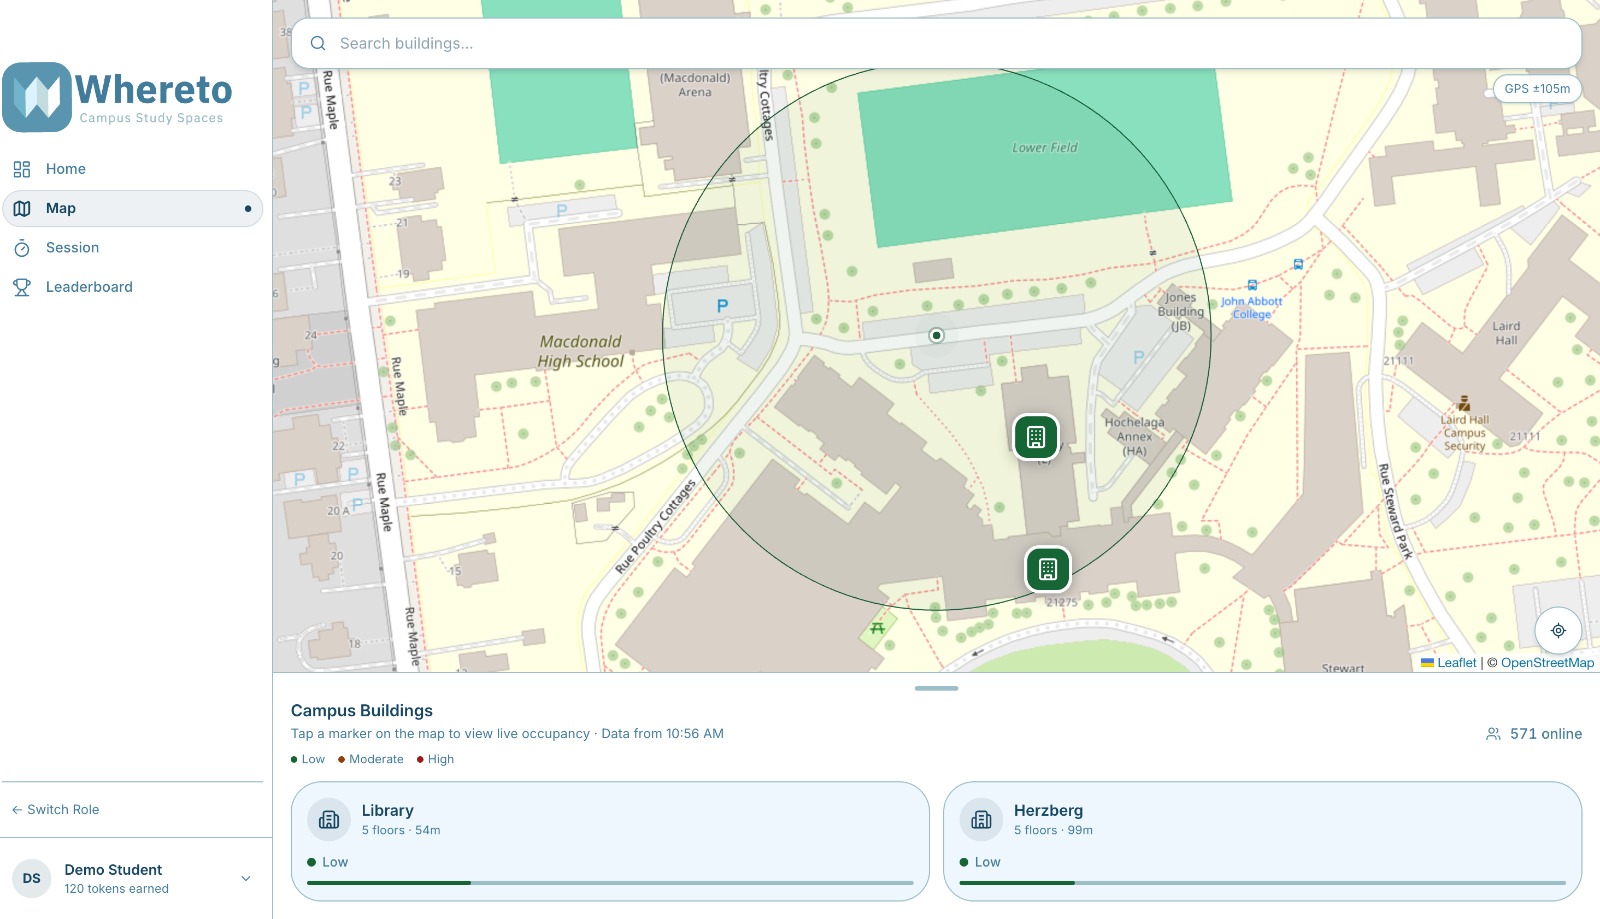
Open Street Map
-
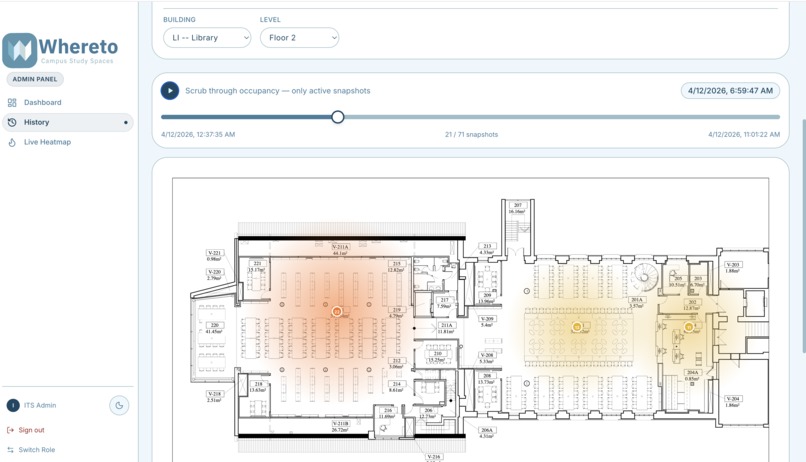
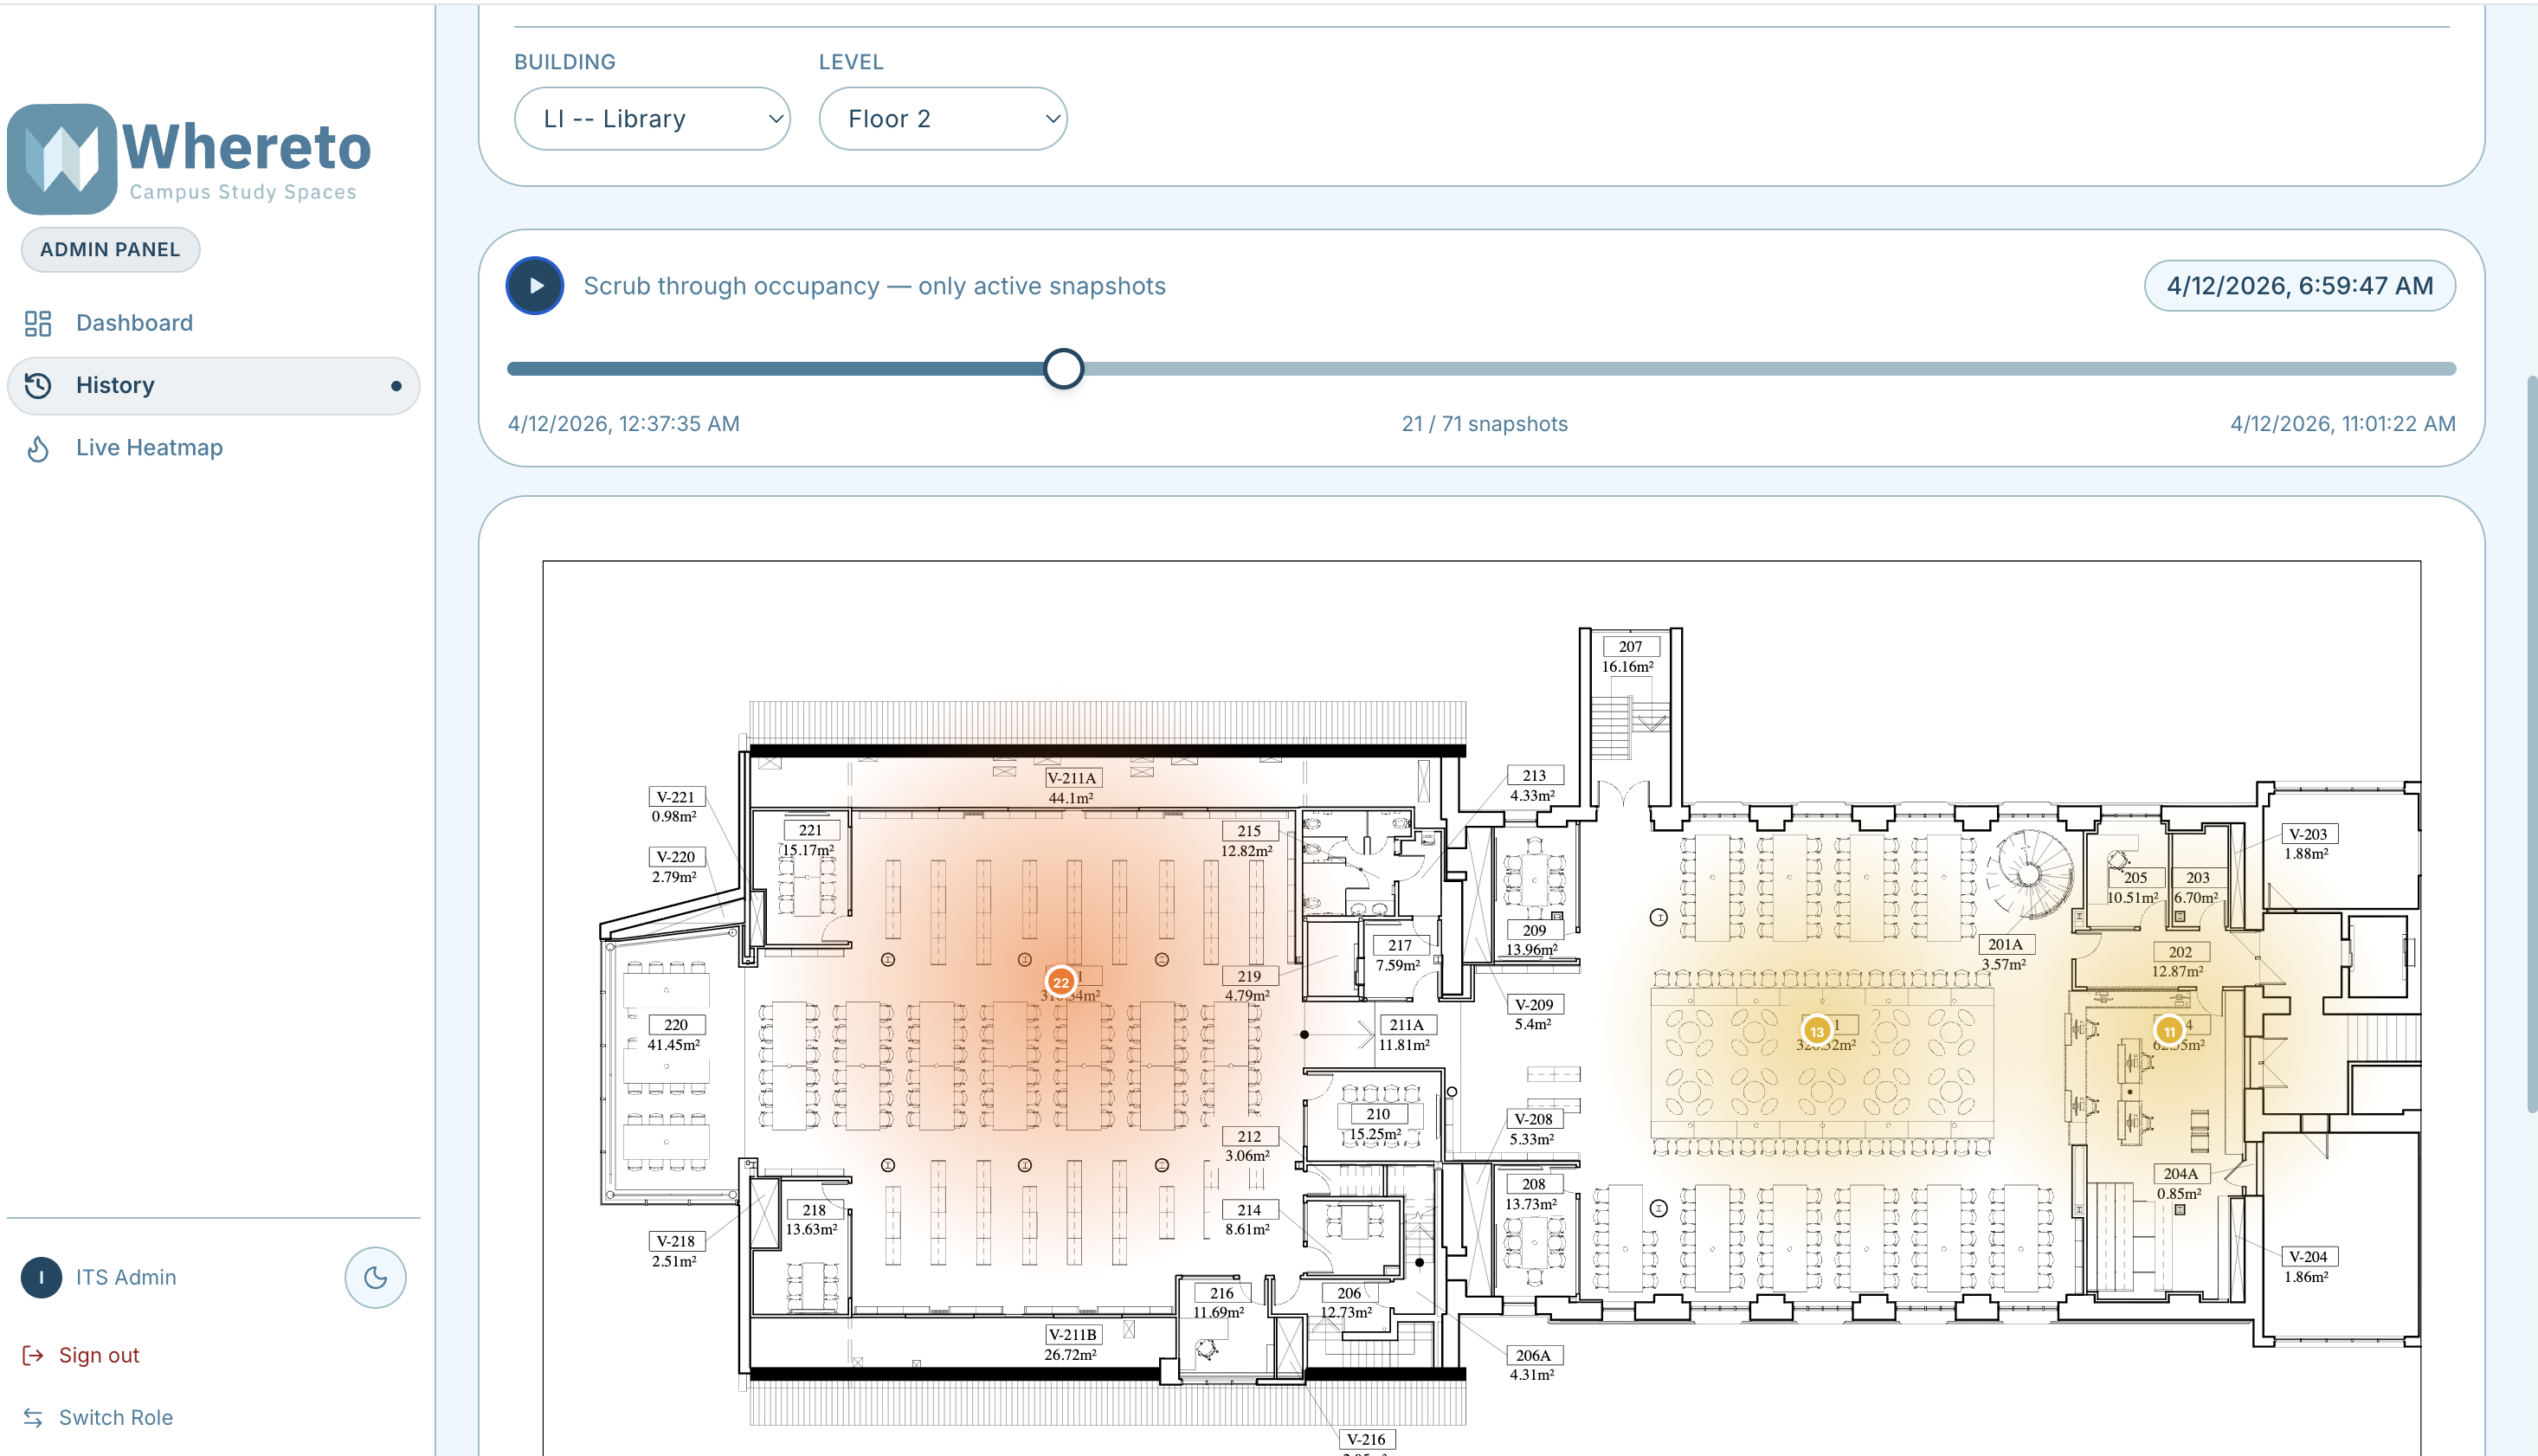
Admin HeatMap history
-
-
-
-
Inspiration
Every student knows the feeling: you haul your laptop across campus, peek into room after room, and every seat is taken. We wanted to eliminate that wasted walk. The ITS Challenge gave us access to live UniFi AP data — and we realized that connected client counts are a surprisingly reliable proxy for "how busy is this room right now." That was the spark.
What it does
Whereto turns raw campus Wi-Fi data into a live occupancy map students can check before they leave their dorm. It shows:
- A floor plan heatmap with real-time colour-coded busyness per room
- Occupancy trends over 1 hour, 6 hours, 24 hours, 7 days, or 30 days
- An AI-powered suggestion that recommends the quietest study spot based on current load
- A fully installable PWA — works on any phone, loads instantly, functions offline
How we built it
The stack is a clean three-tier pipeline:
UniFi Controller → Node/Express API → React PWA
- Backend — Express polls the UniFi controller on a schedule, normalises AP records by building and room, and serves
/api/heatmapand/api/historyendpoints - Frontend — React + Tailwind CSS, Recharts for trend graphs, Leaflet for the interactive floor plan overlay
- AI layer — feeds current occupancy data to Claude to generate a plain-English study spot recommendation
- PWA — a service worker caches the app shell and JS chunks so the app loads in under a second on mobile
Challenges we ran into
Mapping APs to rooms. One access point can cover parts of multiple rooms. We had to reverse-engineer the AP naming convention and cross-reference floor plans to produce a trustworthy room-level occupancy signal.
Chart scaling across time ranges. Rendering one hour of data looks nothing like 30 days. We built a downsampling pipeline capped at 36 points per view and a range-aware tick formatter — HH:MM for short ranges, Mon 14 for weekly, Apr 1 for monthly — so the X-axis never collapses into an unreadable blur on mobile.
Service worker stability. Our SW was passing undefined to event.respondWith() whenever an asset wasn't cached and the network was unreachable. That single bug crashed the entire fetch pipeline and took down React, Leaflet, and Recharts simultaneously. Fixing it required a proper per-path caching strategy so every code path always returns a valid Response.
Accomplishments that we're proud of
- A floor plan heatmap that updates in real time and is actually readable on a phone
- A scrubable timeline that lets you replay occupancy snapshots across any time window
- An AI recommendation that gives students a concrete answer, not just a list of numbers
- Shipping a polished, installable PWA under hackathon time pressure
What we learned
- UniFi AP client counts are a reliable occupancy signal if you normalise by room carefully
- PWA service workers are powerful but unforgiving — one missing
Responseguard cascades into a full app failure - Mobile chart design requires explicit tick budgets and short label formats, not just responsive containers
- Building for real users on real campus hardware forces you to handle edge cases you would never encounter in a mock dataset
What's next for Whereto
- Push notifications — alert students when a favourite room drops below a busyness threshold
- Seat-level granularity — combine AP data with computer lab login records for room-by-room accuracy
- Predictive occupancy — train a lightweight model on historical patterns to forecast busy periods before they happen
- Cross-campus rollout — the architecture is site-agnostic; any institution running UniFi could plug in and go
Built With
- claude
- css
- express.js
- javascript
- motion
- node.js
- pwa
- radix
- react
- react-leaflet
- recharts
- sqlite
- tailwind
- typescript
- unifi

Log in or sign up for Devpost to join the conversation.