Inspiration
There are over 600 million acres of private rural land in the United States, and a massive amount of it has off-road trails that nobody knows about — old logging roads, fire breaks, ATV paths, pipeline corridors, jeep trails carved into hillsides. Landowners often don't realize the recreational value sitting on their property, and off-road enthusiasts have no way to discover it.
The off-road community spends hours on Google Earth manually scanning satellite imagery looking for trails on private land, then cold-calling county assessor offices to figure out who owns it. It's a completely manual, inefficient process that leaves billions of dollars of recreational real estate invisible.
We asked: what if we could automate the entire pipeline? Point AI at satellite imagery, detect trails automatically, pull the property owner's name and contact info, and hand it to someone ready to negotiate a trail-use lease — all in one scan.
What It Does
Where2Wheel is a satellite imagery analysis platform that uses Claude Vision to detect off-road trails on private rural land, then cross-references Regrid parcel data to identify the property owner, acreage, zoning, and contact information — giving off-road businesses and enthusiasts a complete lead generation pipeline from satellite scan to owner outreach.
The Scan Pipeline
- Search any location in the US via Mapbox Geocoding — type a county, city, or address
- Hit SCAN — the system captures the current map viewport as a bounding box
- Mapbox Satellite tiles are fetched at zoom level 17 (~0.6m resolution) covering the scan area — up to 6 tiles per scan to balance coverage vs. cost
- Each tile is sent to Claude Vision (Sonnet 4.5) with a specialized trail detection prompt that analyzes the satellite imagery for:
- Unpaved dirt/gravel roads through rural or wooded land
- ATV/UTV single-track paths visible through vegetation
- Logging roads, fire roads, forest service roads
- Pipeline or utility right-of-way corridors
- Jeep trails, rocky paths, switchbacks on hillsides
- Claude returns structured JSON per tile: trail locations (as coordinate offsets), confidence scores, off-road rating (1–5), terrain type, trail surface and width, and a natural language description
- For tiles with detected trails (confidence > 60%), the system queries the Regrid API at the tile center coordinates to pull real parcel data:
- Property owner name
- Full mailing address
- Acreage
- Zoning classification
- Tax assessment value
- Parcel ID
- Property boundary geometry (rendered on the map)
- Enhanced ownership data: phone number, email address
- Results are assembled into a GeoJSON FeatureCollection with trail LineStrings and property Points, then sent to the frontend
The Frontend
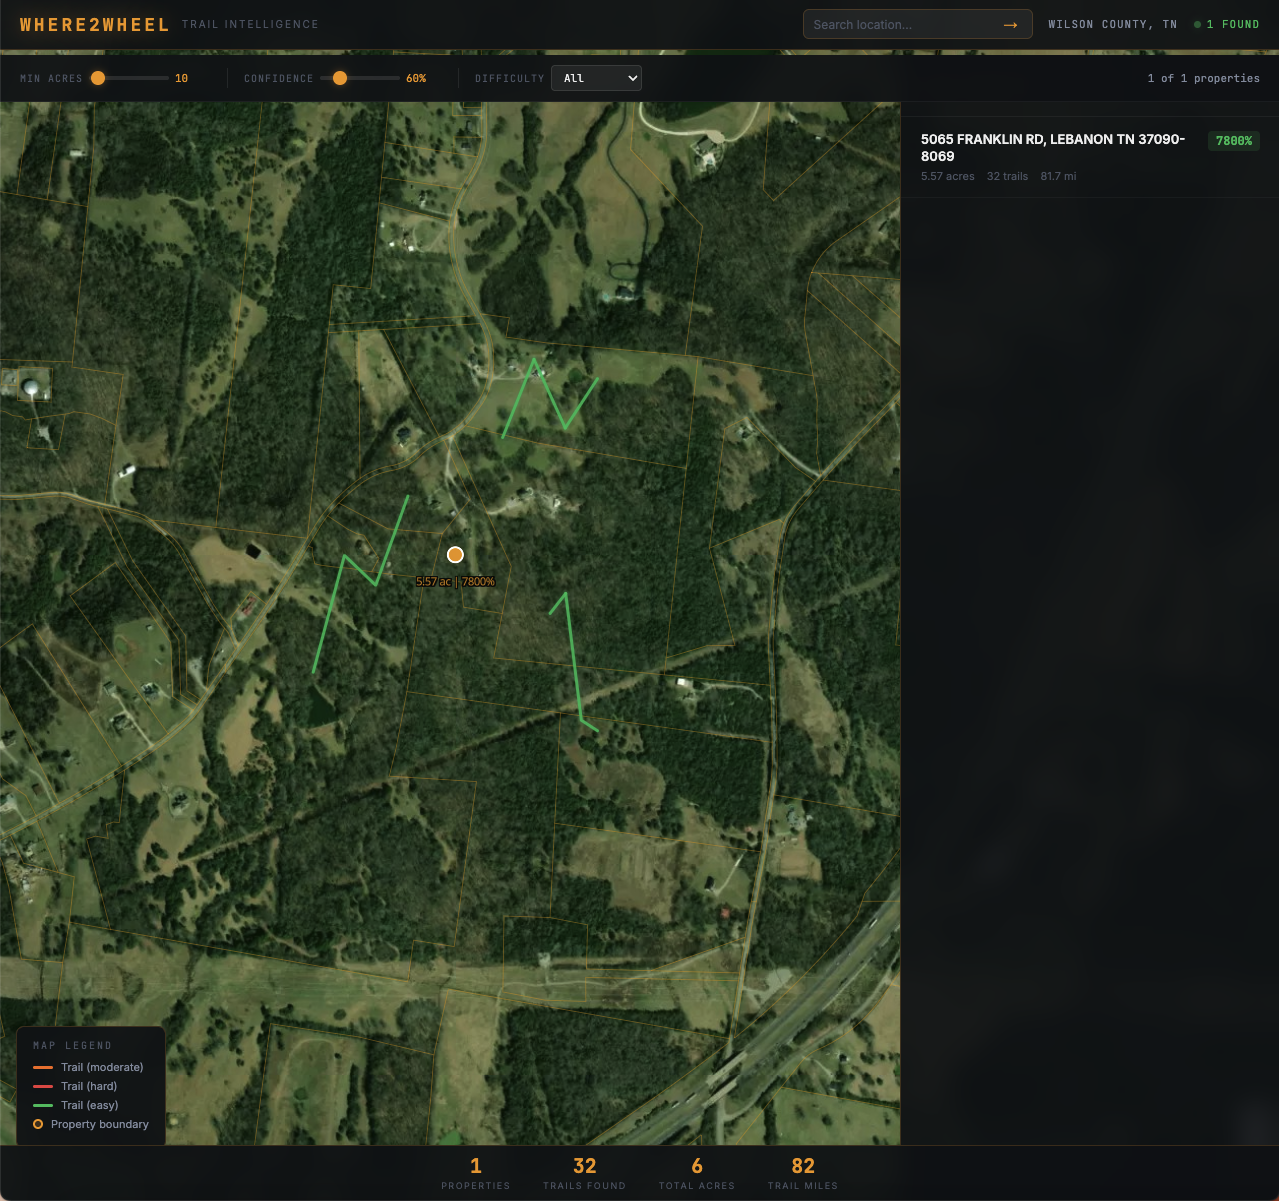
A full satellite-imagery map interface built on MapLibre GL with Mapbox satellite tiles:
- Real Regrid parcel boundaries rendered as a vector tile overlay — every property line in the US visible at zoom 14+
- Trail visualization color-coded by difficulty: green (easy), orange (moderate), red (hard) — with glow effects for visibility on satellite imagery
- Property boundary polygons highlighted with dashed amber outlines
- Interactive property markers with acreage and confidence score labels
- Filter controls: minimum acreage slider, confidence threshold slider, difficulty dropdown
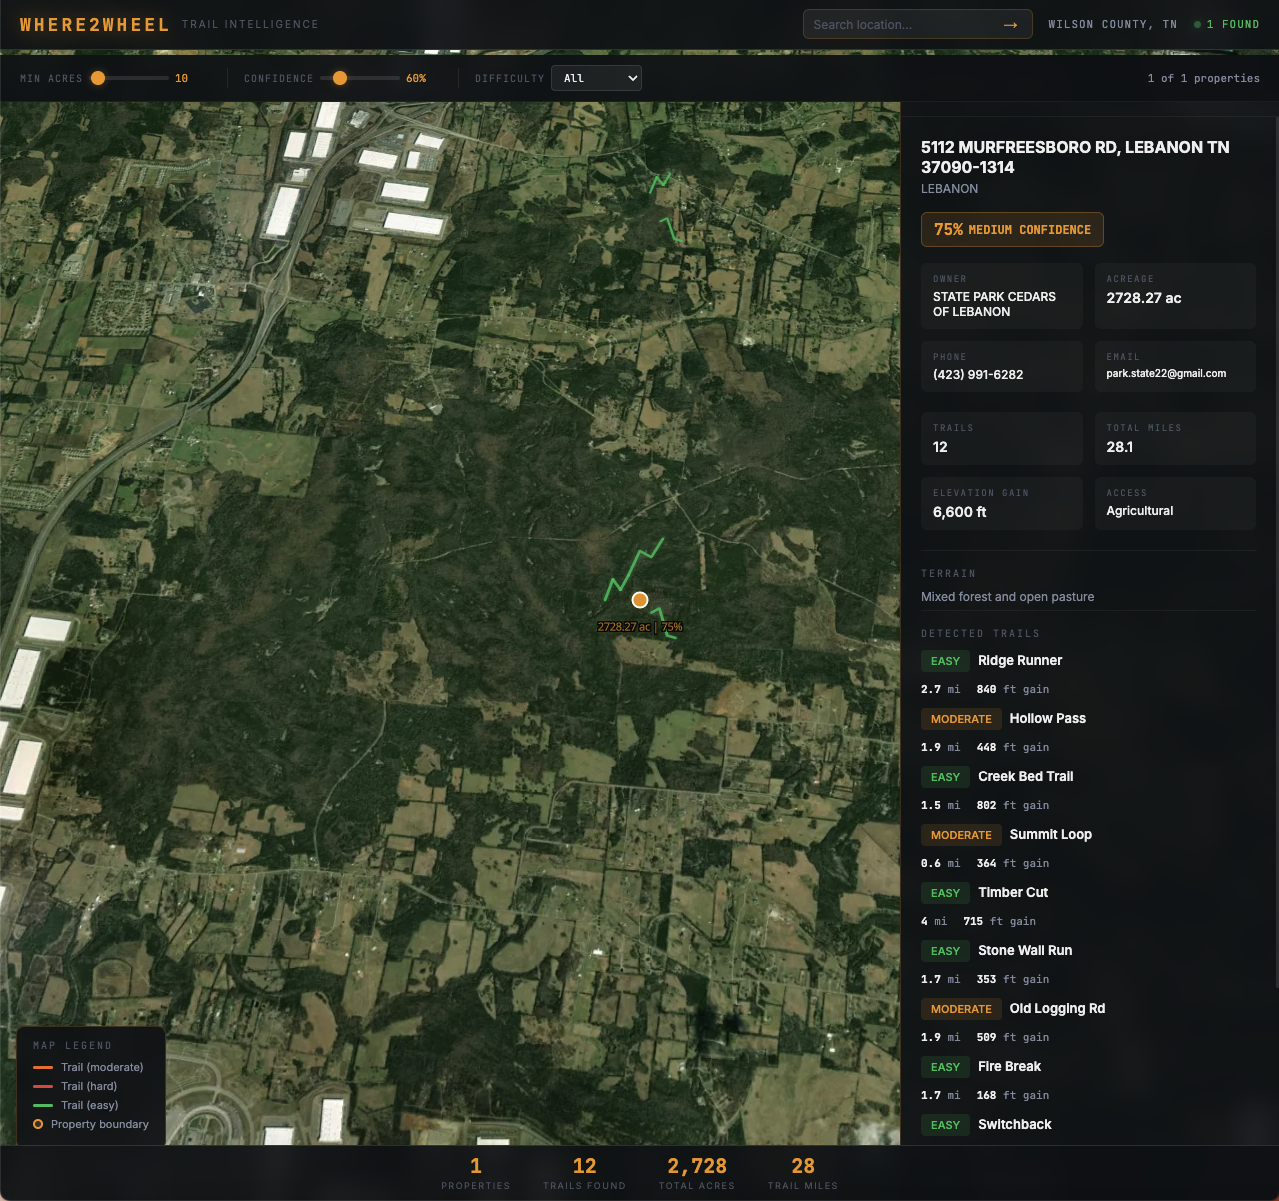
- Property detail panel showing:
- Owner name, full address, acreage
- Phone number and email address
- Number of detected trails with total mileage
- Elevation gain estimates
- Zoning/access classification
- Terrain description from Claude's analysis
- Each detected trail with name, difficulty rating, distance, and elevation
- "Contact Owner" button that opens a pre-drafted email with property details, trail count, and a professional inquiry about trail-use agreements
- Stats bar showing total properties found, trails detected, total acres scanned, and total trail miles
- Map legend with trail difficulty color coding and property boundary indicators
The Demo Data
The app ships with 11 hand-curated properties across Alleghany, Bath, and Highland Counties in Virginia — real Appalachian mountain terrain with realistic trail networks, owner names, contact info, and terrain descriptions. This lets the demo run instantly without waiting for API calls.
When scanning live, the backend uses real satellite imagery + real Claude Vision analysis + real Regrid parcel data from their sandbox API. The parcel data (owner, address, acreage, zoning, boundaries) is real — pulled directly from county assessor records via Regrid.
How We Built It
Backend (where2wheel-server.py — Python, zero dependencies):
- Pure Python HTTP server using ThreadingHTTPServer
- Mapbox Raster Tiles API for satellite imagery at zoom 17 (2x resolution JPEG)
- Anthropic Messages API with Claude Sonnet 4.5 for vision-based trail detection
- Regrid Parcel API for property owner lookup, parcel boundaries, and enhanced ownership data
- Lat/lon ↔ tile coordinate conversion for Slippy Map tilenames
- GeoJSON assembly for trail LineStrings and property boundaries
- Auto-cropping for large scan areas to maintain satellite resolution
- Adaptive zoom — if too many tiles are needed, automatically reduces zoom level
Frontend (where2wheel.html — single-file, zero build):
- MapLibre GL JS with Mapbox satellite basemap
- Regrid Vector Tiles for real-time parcel boundary rendering
- Mapbox Geocoding API for location search
- Turf.js for geospatial calculations
- Procedural trail geometry generation from property coordinates
- DOM-based rendering throughout (no innerHTML for security)
- Responsive filter system with live map updates
APIs Used:
- Claude Vision (Anthropic Messages API) — satellite image analysis
- Mapbox Satellite Tiles — high-res imagery
- Mapbox Geocoding — location search
- Regrid Parcel API — property owner data + boundaries
- Regrid Vector Tiles — real-time parcel boundary overlay
Cost Per Scan: ~$0.03 (6 tiles × Claude Vision at ~$0.005/tile)
Challenges We Ran Into
- Trail detection accuracy — Claude Vision can confuse fence lines, field boundaries, and driveways with actual off-road trails. We had to significantly refine the prompt to be conservative: requiring visible tire tracks or worn paths through wooded/hilly terrain, rejecting flat agricultural land with straight lines, and capping confidence scores based on terrain type.
- Regrid sandbox limitations — The sandbox API returns real parcel data (owner, address, acreage, zoning, boundaries) but enhanced ownership fields (phone, email) require the production tier. We built deterministic fake contact generation for the demo that produces realistic area-code-accurate phone numbers and name-based email addresses.
- Satellite tile resolution vs. coverage tradeoff — Higher zoom = better trail visibility but fewer tiles cover the area. We settled on zoom 17 (~0.6m/px) with a 6-tile cap, auto-downgrading to zoom 13 for larger scan areas.
- Coordinate math — Converting between lat/lon, Slippy Map tile coordinates, and Claude Vision's relative offset system required careful handling to place detected trails at accurate real-world positions.
What We Learned
- Claude Vision is remarkably good at interpreting satellite imagery — it can distinguish dirt roads from paved ones, identify logging road patterns, and describe terrain composition from a single tile.
- The US has extraordinary public parcel data — Regrid aggregates county assessor records for 153M+ properties. Owner name, mailing address, acreage, tax assessment, and boundary geometry are all available via API. The data infrastructure for a product like this already exists.
- Off-road trail access is a genuine market — private landowners sit on valuable recreational assets they don't monetize. Off-road parks charge $30–75/day. A platform connecting landowners with enthusiasts could create a new asset class of recreational land leases.
- The entire pipeline (satellite scan → AI analysis → owner lookup → outreach) can run for ~$0.03 per scan — making it economically viable at scale.ud of
What we learned
What's next for Where2Wheel
Built With
- claude-vision-(anthropic-api)
- css
- html
- javascript
- mapbox-geocoding-api
- mapbox-satellite-api
- maplibre-gl
- python
- regrid-parcel-api
- regrid-vector-tiles
- turf.js


Log in or sign up for Devpost to join the conversation.