-
-
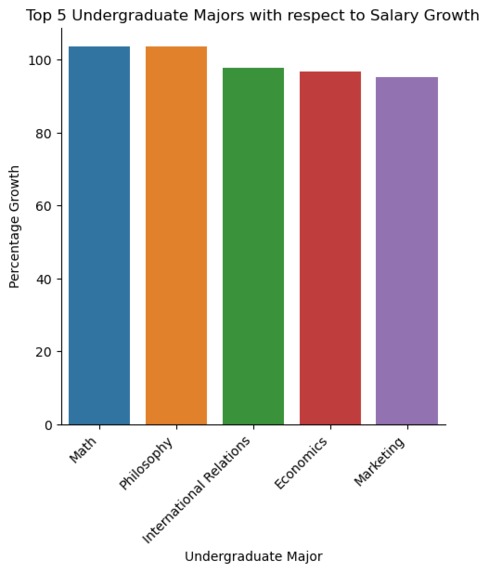
Top 5 Undergraduate Majors with respect to Salary Growth
-
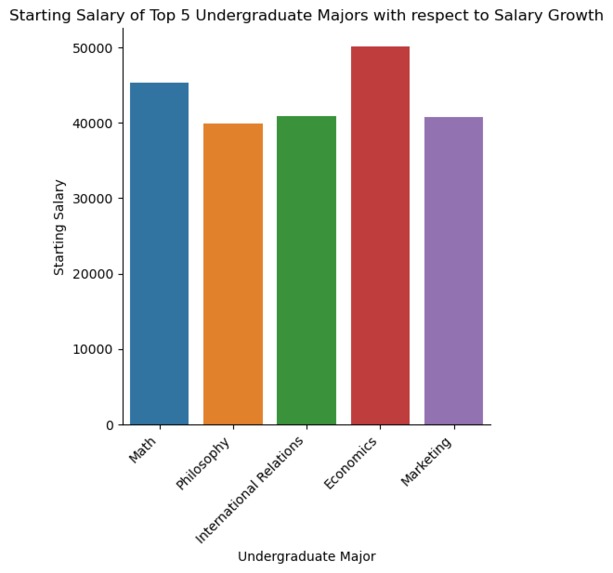
Starting Salary of Top 5 Undergraduate Majors with respect to Salary Growth
-
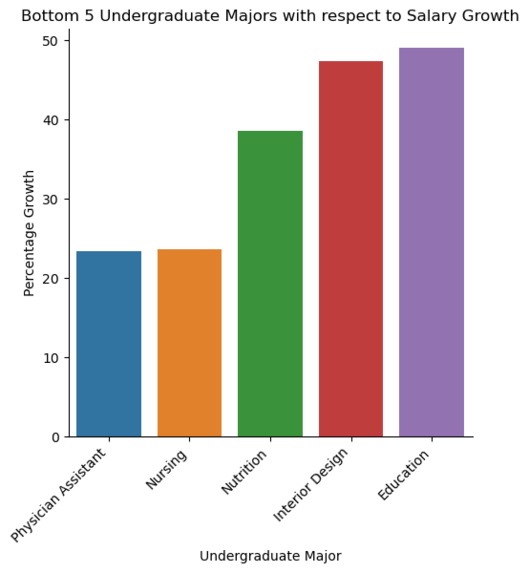
Bottom 5 Undergraduate Majors with respect to Salary Growth
-

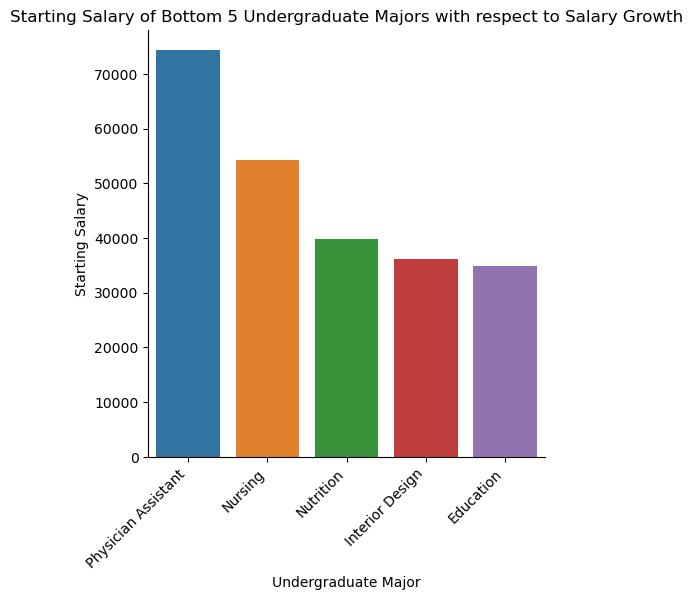
Starting Salary of Bottom 5 Undergraduate Majors with respect to Salary Growth
-

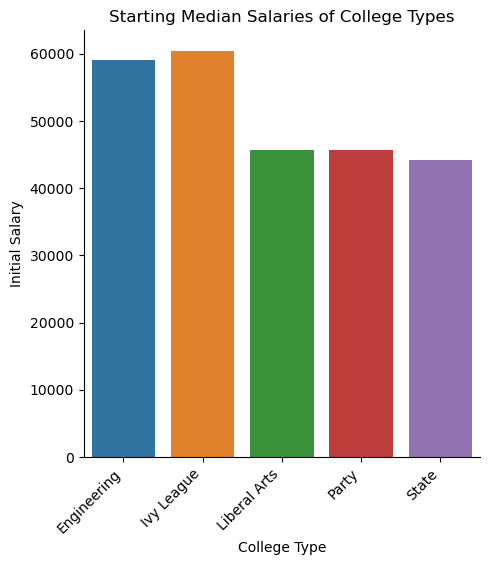
Starting Median Salary of College Types
-

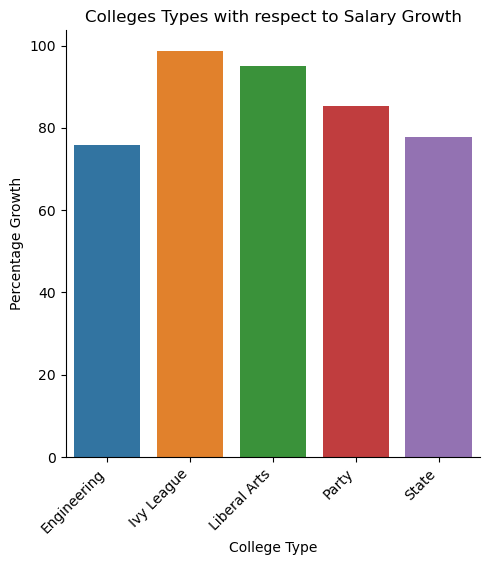
College Types with respect to Salary Growth
-
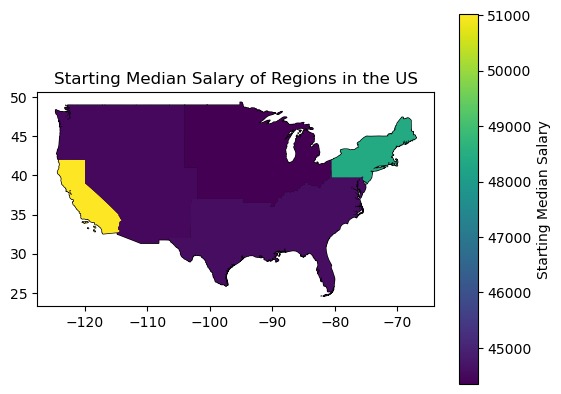
Starting Median Salary of Regions in the US
-

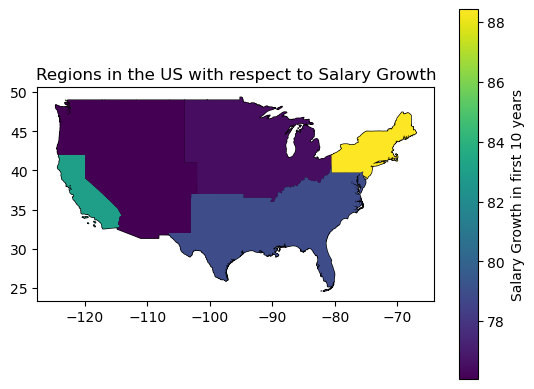
Regions in the US with respect to Salary Growth
-

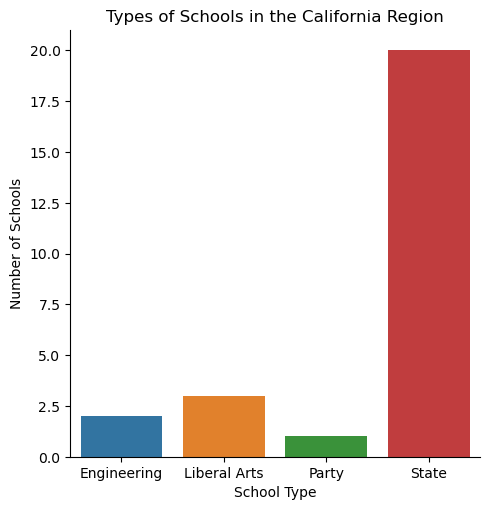
Types of School in the California Region
-
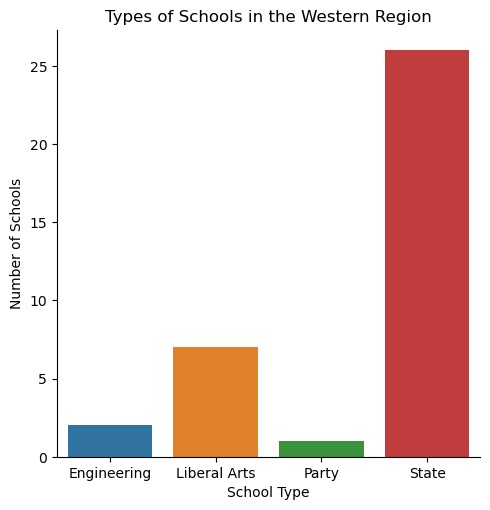
Types of School in the Western Region
-
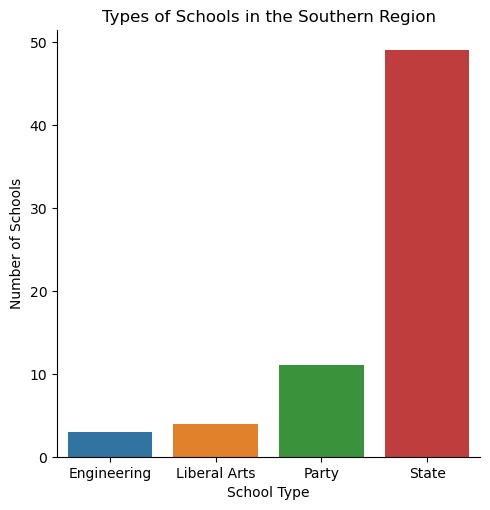
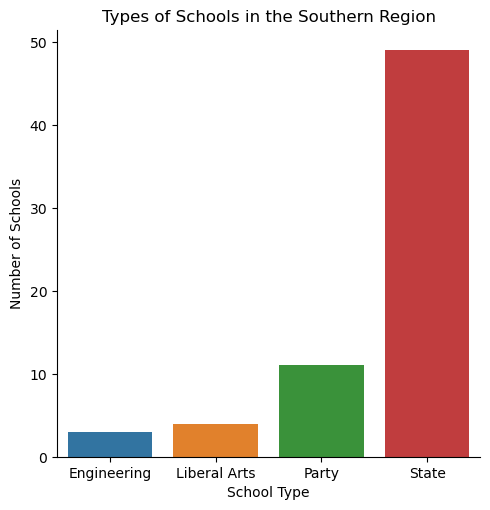
Types of School in the Southern Region
-
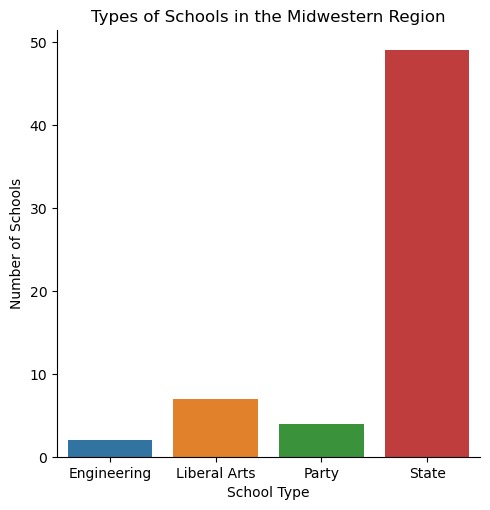
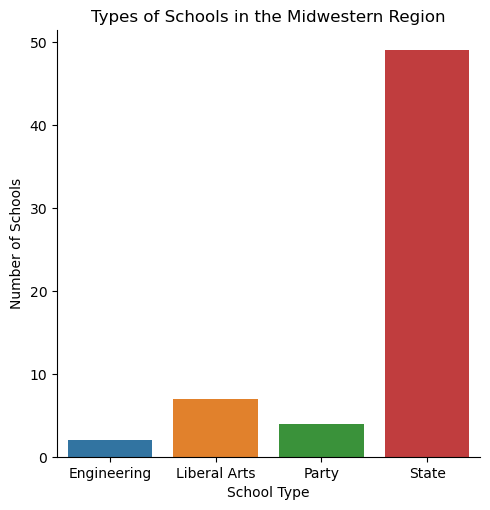
Types of School in the Midwestern Region
-
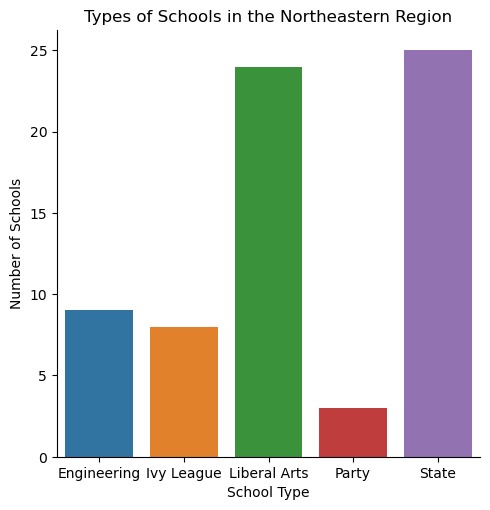
Types of School in the Northeastern Region


Group Members
Parker Devereux.
Inspiration
As a college student myself pursuing higher education, I have always been interested in looking into the worth of the degree you are actually receiving. With myself being a mathematician going into the education field, these numbers are something I definitely considered before making certain decisions about my future career. Especially with job growth in America evolving everyday along with the advancement in technology, knowing the answers to these research questions can reflect what specific careers, regions, and topics are growing in importance, and which are becoming obsolete.
What it does
This project analyzes how undergraduate majors, regions, and types of colleges influence students' starting median salaries and salary growth over the first 10 years of working.
How we built it
I built this using the datasets found here: https://www.kaggle.com/wsj/college-salaries?select=salaries-by-region.csv. By using python, along with the modules pandas, geopandas, seaborn, and matplitlib.pyplot, I first processed and cleaned up the three main datasets I found so that they were usable. With these usable datasets, given the starting median salary and mid-career median salary after 10 years, I was able to calculate the percent growth for each factor, and then using these numbers, I sorted and filtered these datasets with respect to the research question I was answering. Finally, I could plot and interpret the results.
Challenges we ran into
The biggest challenge I ran in to was processing the data, and constructing the plot which utilizes GeoDataFrames. After looking through a multitude of shape files and other geospatial datasets, I found that the dataset provided in the lesson 18 of our lectures which includes the geometry for each state in the United States was the most convenient to download and work with. However, this file only has the states, and was not divided by regions. So by hard coding in a list of lists with each US state as the first entry in the list, spelled identically as in the “Name” column of the geospatial dataset, and the second entry of each list being the corresponding region, I used the DataFrame method to create a DataFrame of this list and then merged it with the GeoDataFrame of the US States. Then, only keeping the “geometry” and “Region” columns, I used dissolve by region to result in a GeoDataFrame with each “Region” and the respective union of polygons of each US state. Finally, merging this GeoDataFrame together with the DataFrame which describes the average starting median salary, mid-career median salary, and percent growth for each region in the US by region, I was able to plot this matplotlib, giving me the conclusion to my third research question.
Accomplishments that we're proud of
I am proud of the problem solving that was done when working on this project. In most of the bugs I ran into, I feel like the resources and skills I have learned in this class previously allowed me to think of alternate solutions which solved these issues.
What we learned
I learned a lot during this project, not just in the analysis that was done, but in putting together a coding project. There were a lot of different moving parts, so I think it was important to keep everything organized, especially the code. If I could go back and give my past self advice, I would tell him to start the project earlier so he had more time.
What's next for Where it Pays to Attend College
When moving forward with this project, I think it is helpful to point out that there appears to be some biases within the data that could have impacted the results. The biggest issue I see is the size of the data set. The datasets only examine 320 different colleges within the US. With a small sample size, it is hard to come to a confident conclusion in the results we have obtained. Moreover, this small size begs the question “how were these specific colleges picked?” If they were not randomly selected, there could be a bias in their selection, leading to inaccurate results.
With all this said, to improve the accuracy of this project, I would suggest collecting a larger dataset of randomly selected colleges around the US. After this, the same analysis can be done, and with more data, we can further look into the relationships of different factors, like comparing the most popular undergraduate majors within a certain type of college.

Log in or sign up for Devpost to join the conversation.