-
-
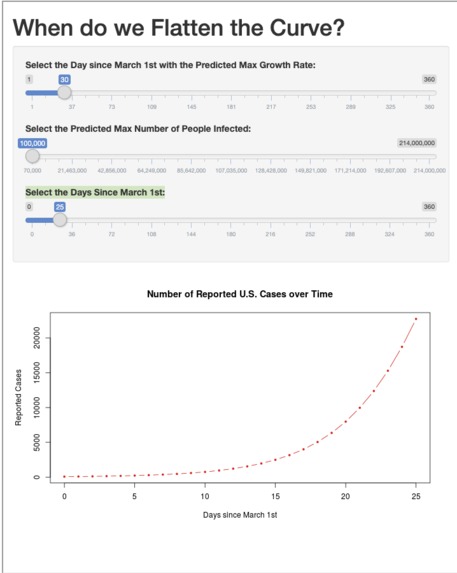
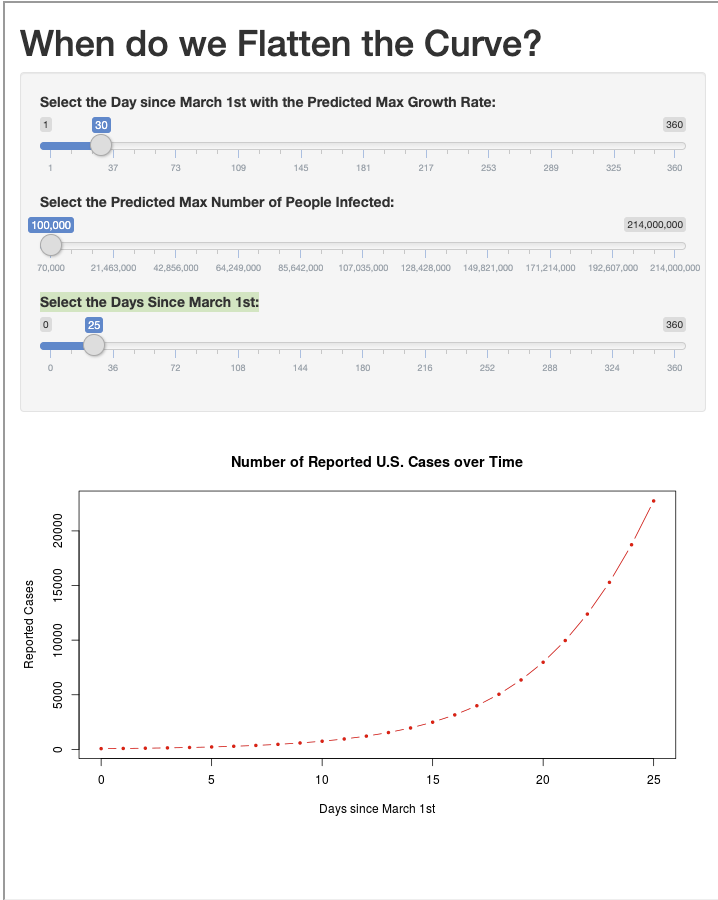
A screen shot of the model
Inspiration
This program was inspired by the uncertainty in Dr. Anthony Fauci about not knowing exactly how to predict when we can say we are effectively flattening the coronavirus infection curve. This app helps users understand how manipulating and changing certain parameters can change the way we visualize the curve.
What it does
This app takes in three parameters that can be modified by the user:
- The day since March 1st with the Predicted Max Growth Rate
- The Predicted Max Number of People Infected
- The Days since March 1st
It then inputs these dynamic variables into a logistic growth function to model how the infection curve initially grows exponentially and then flattens out as the predicted max number of infected people is reached.
How I built it
This app was built with RShiny
Challenges I ran into
It was difficult understanding exactly what other external factors, like a shelter in place order, and social distancing measures, have on the shape of the curve.
Accomplishments that I'm proud of
I learned to use RShiny and was able to successfully embed to web-app into another website!
What I learned
What's next for When will we flatten the curve?
Incorporating a more sophisticated equation that other important factors like a term for the impact of social distancing/shelter in place measures.
Built With
- hugo
- rshiny


Log in or sign up for Devpost to join the conversation.