-
-
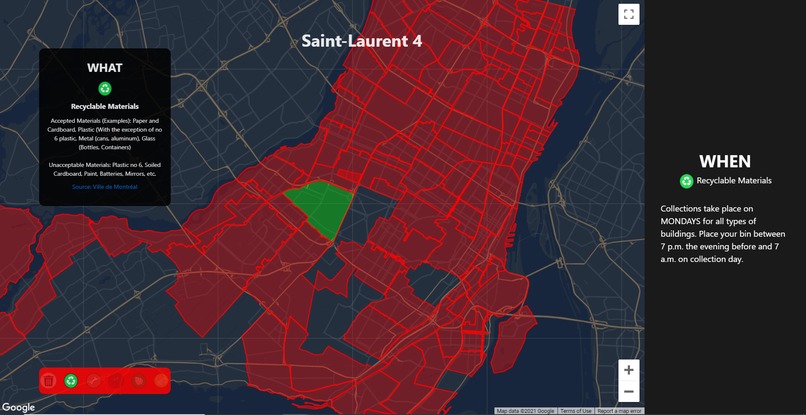
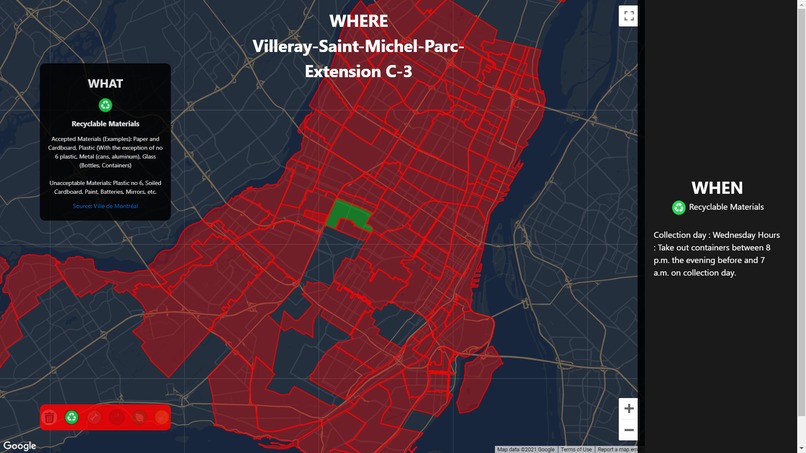
Screenshot of the UI
-
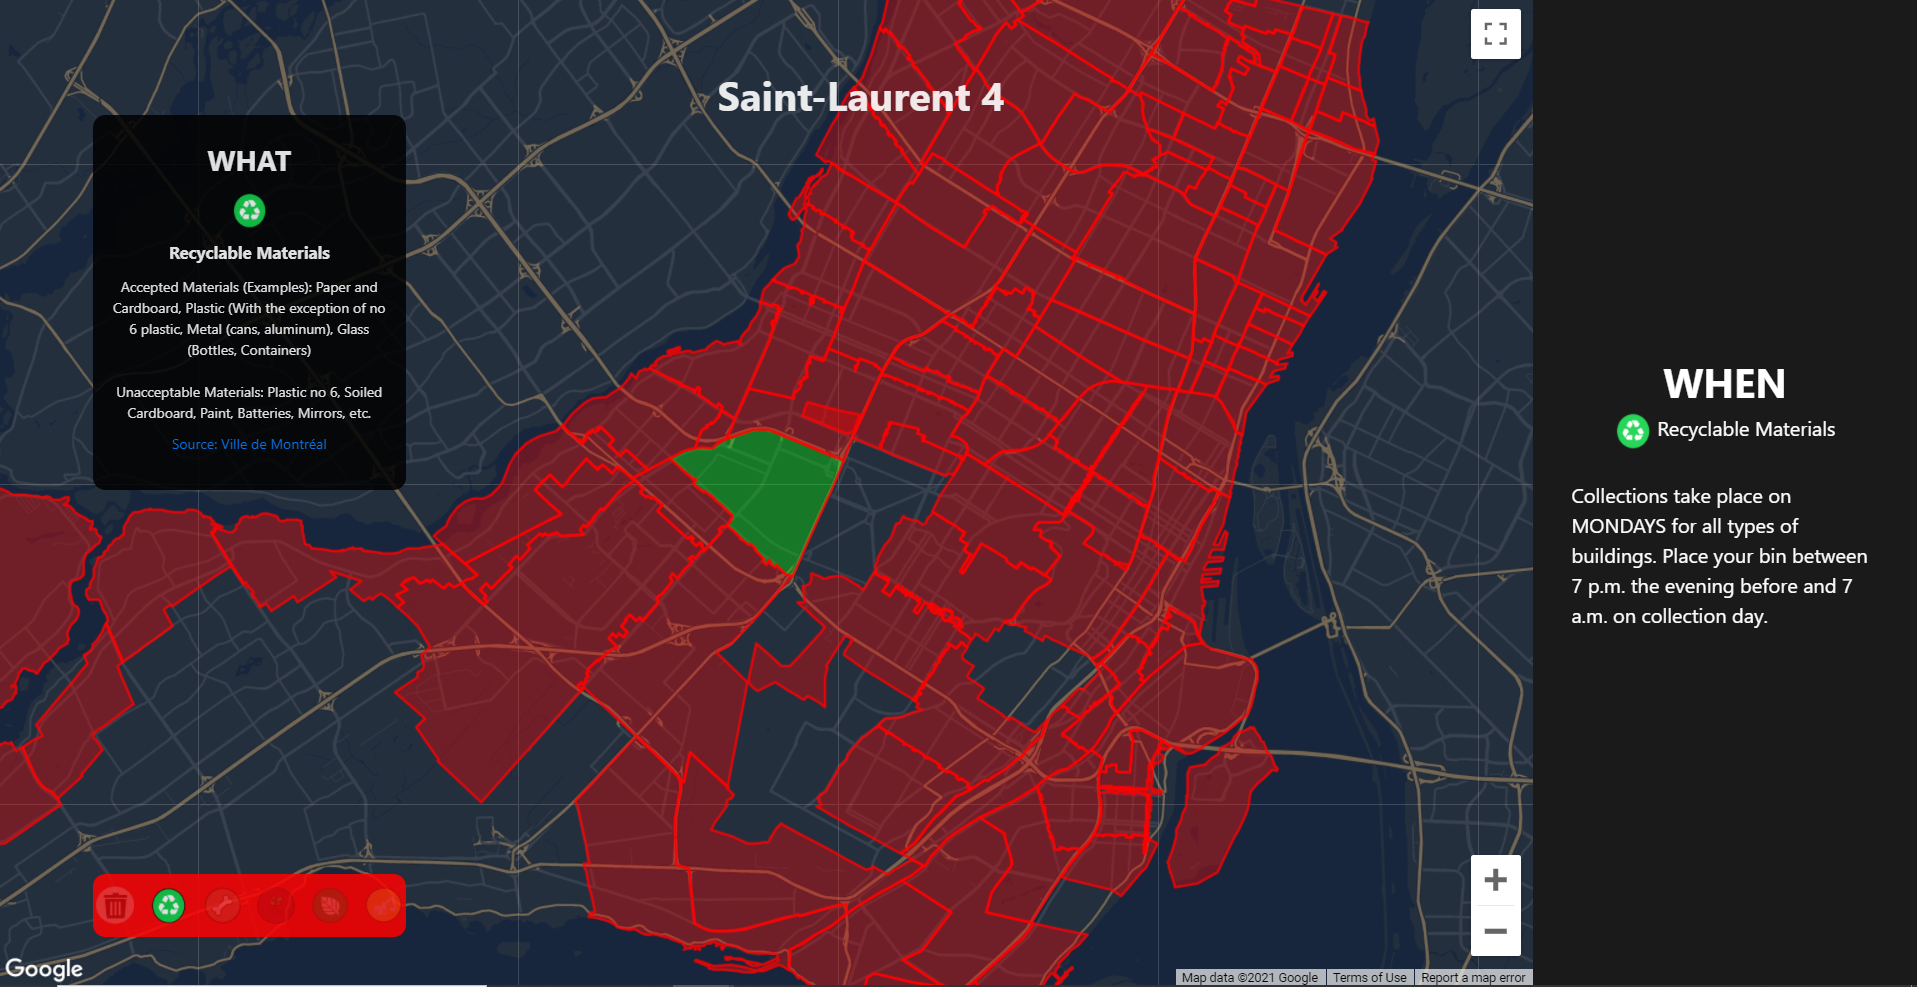
Screenshot of the current UI

Inspiration
Similar Map/Infrastructure Visualizations are common and useful.
What it does
Explains WHAT to recycle, WHEN to recycle, WHERE to recycle in MTL.
How we built it
Google Maps API, Data from https://donnees.montreal.ca/, Simple HTML, JavaScript.
Challenges we ran into
Cleaning the data, creating a key-value dictionary for all the keycodes to translate into neighborhood names. Creating the polygons/multi-polygons to display on the map based on latitude and longitude bounds. Having to hardcode data. Adding many event listeners to increase interactiveness.
Accomplishments that we're proud of
Something Visually Pleasing, Interactive and Functional.
What we learned
Creating constructors that process complex JSON objects that outputs Polygon objects.
What's next for WhatWhereWhenIsTrashInMTL
Adding more features. Open for suggestions.


Log in or sign up for Devpost to join the conversation.