-
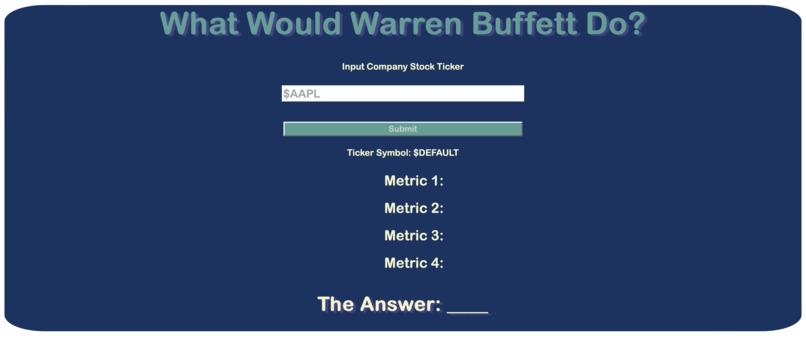
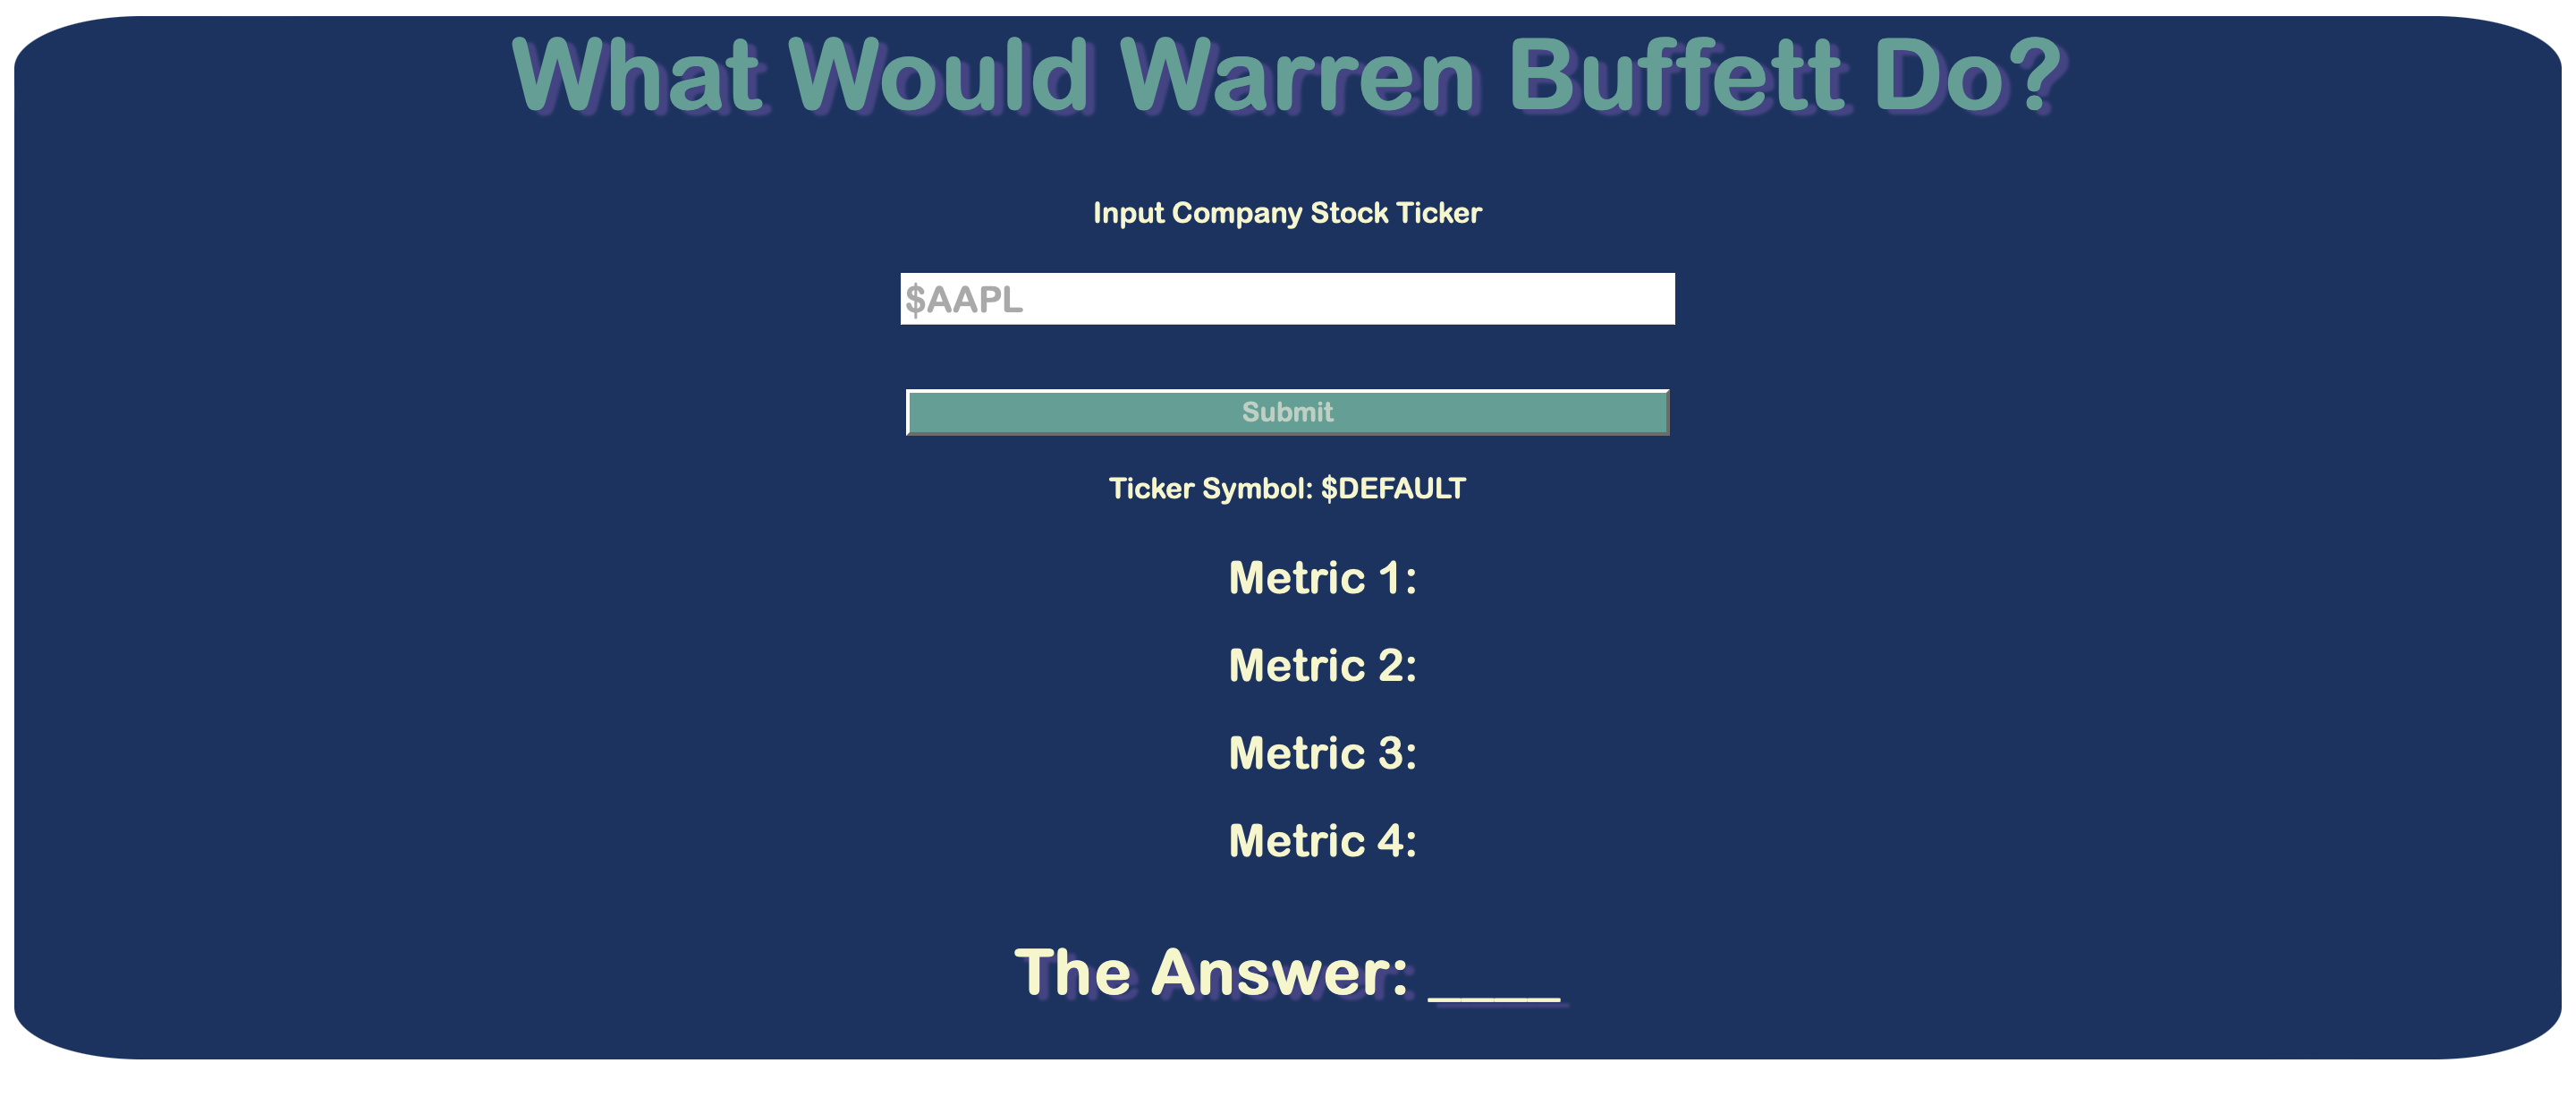
Pre User Input
-
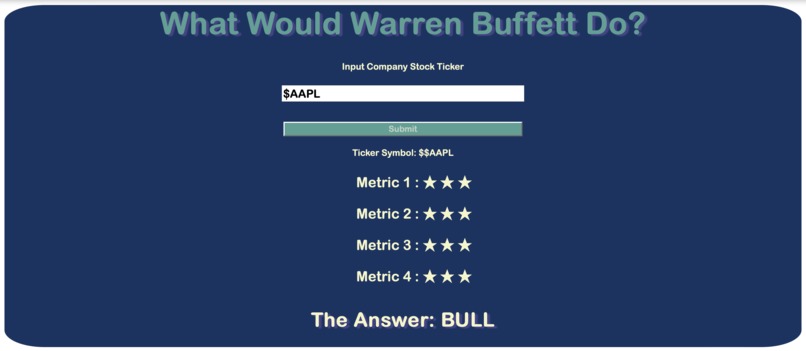
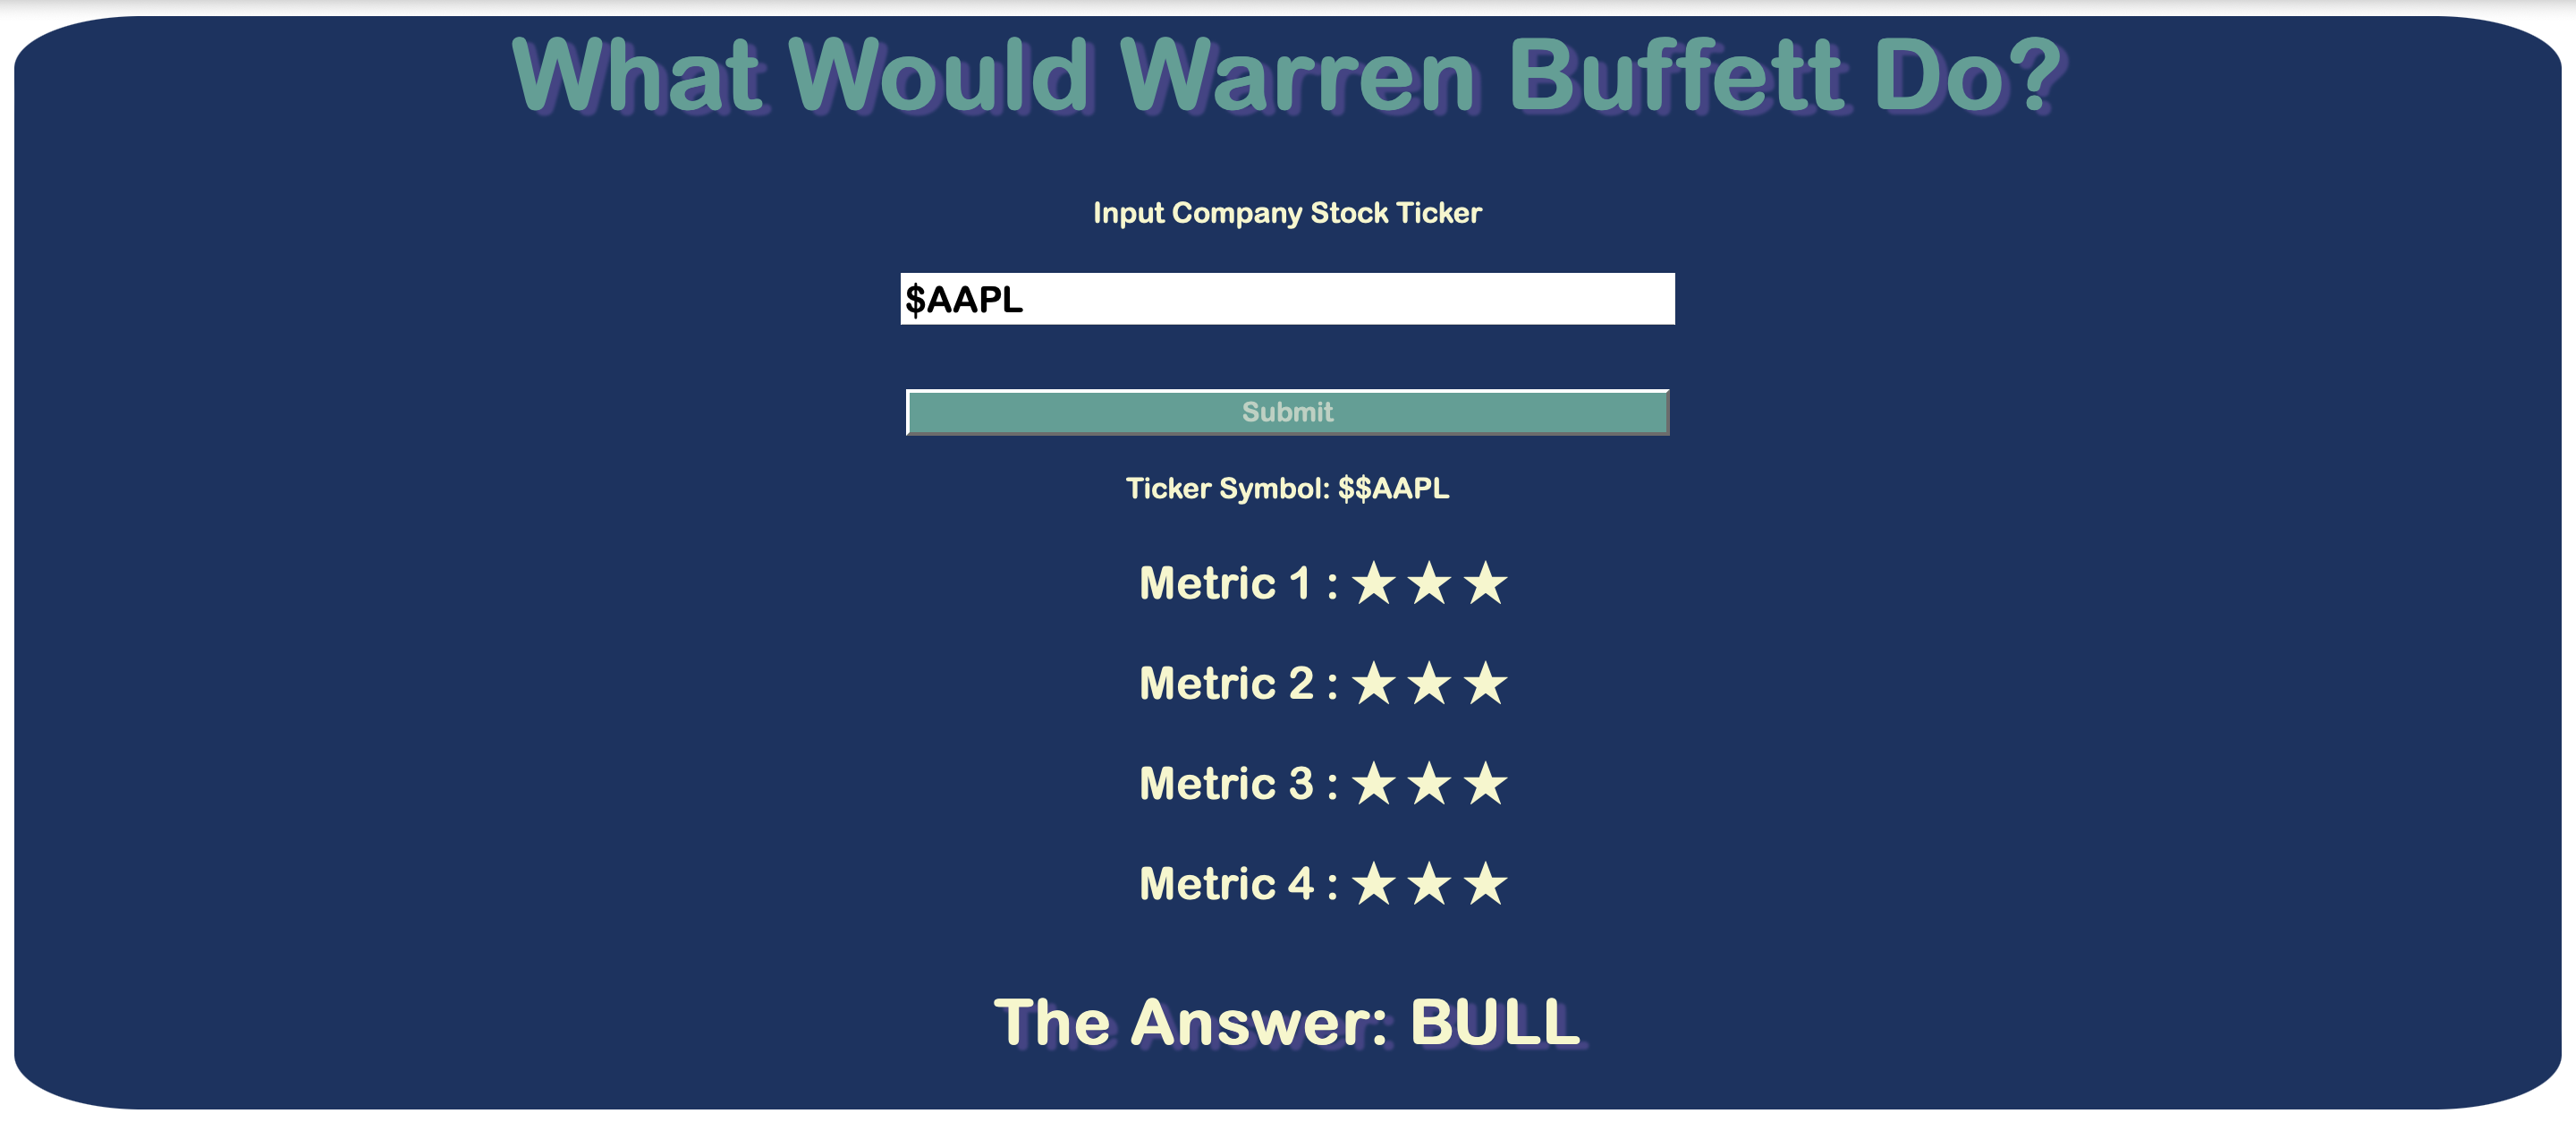
Post User Input
Inspiration
Inspired by the current crypto movement and the high volatility that accompanies it to the financial landscape, our team sought to provide a solution to evaluating the risk of stocks in hopes of encouraging more long-term traders and hopefully less money lost. As a timeless success story of long-term trading and business decisions, Warren Buffett has shared some of his stock trading metrics in picking long-term value stocks which we wanted to condense into a more digestible form.
What it does
The web application uses the user input to fetch company financial data about a certain stock and performs four calculations outlined in a methodology of a Warren Buffett book on the companies revenue, net income, gross profit, operating expenses, income expenses, and SG&A expenses. The web app then classifies each metric result on a scale of 1 to 3 stars and condenses the opinion to a BULL or a BEAR statement.
How we built it
Using raw HTML, CSS, and Javascript, we built the site from
Challenges we ran into
One of the initial challenges we ran into was what type of application to build. Initially we were attracted to creating an extension for the user however we re-evaluated after analyzing the benefits of each medium. While an extension would certainly be possible to create, being an extension would only be a novelty feature in the end with what we wanted our app to do and so decided to choose the best version of our application in a web app. Additionally, the most major challenge was the paywall that many financial API's keep around historical data, as opposed to their limited free data. Finding the API with the data we wanted and that provided free historical access was a struggle that we eventually could not work around. However, in the process of digging through these API, we discovered more complete and accurate data-sets that could fit other metrics we wanted to use in our project and provide a more comprehensive risk analysis.
Accomplishments that we're proud of
We're proud that we were able to successfully connect our user to financial data of their specified company and summarize it in a more digestible format.
What we learned
We, as a team, learned a lot about full-stack development and how to collaborate and work concurrently on different tasks to complete our project.
What's next for What Would Warren Buffett Do? (WWWBD)
In the future, we would like to add historical data in our analysis in order to add two important metrics of 10-year compounded annual growth rate of a company's net income and revenue. Additionally, providing the option for the user to view more of the background processes along with explanations of why we used the calculations we did in order to create more informed users that will make smarter decisions.
Built With
- css
- financial-modeling-prep-data
- html
- javascript

Log in or sign up for Devpost to join the conversation.