Inspiration
Artificial Intelligence is reshaping the global labor market at an exponential pace. Job descriptions, technical requirements, and required skill sets are transforming so rapidly that traditional job portals struggle to keep up.
Job seekers, career entrants, and business leaders face a growing data asymmetry:
Opaque Skill Shifts: The rise of AI tools has caused rapid "skill inflation," making it difficult to understand which technical and soft skills are genuinely in demand. Unclear Junior Pathways: Entry-level positions have become increasingly hard to track, measure, and compare across companies globally. Flawed Job Board Data: Portals like LinkedIn or Indeed rely heavily on HTML web scrapers, resulting in 30–90 day stale listings, expired staffing agency duplicates, and metrics locked behind expensive enterprise SaaS paywalls.
We created What's Your Data to solve this problem by bringing un-redacted, real-time transparency to global hiring trends.
## What it does
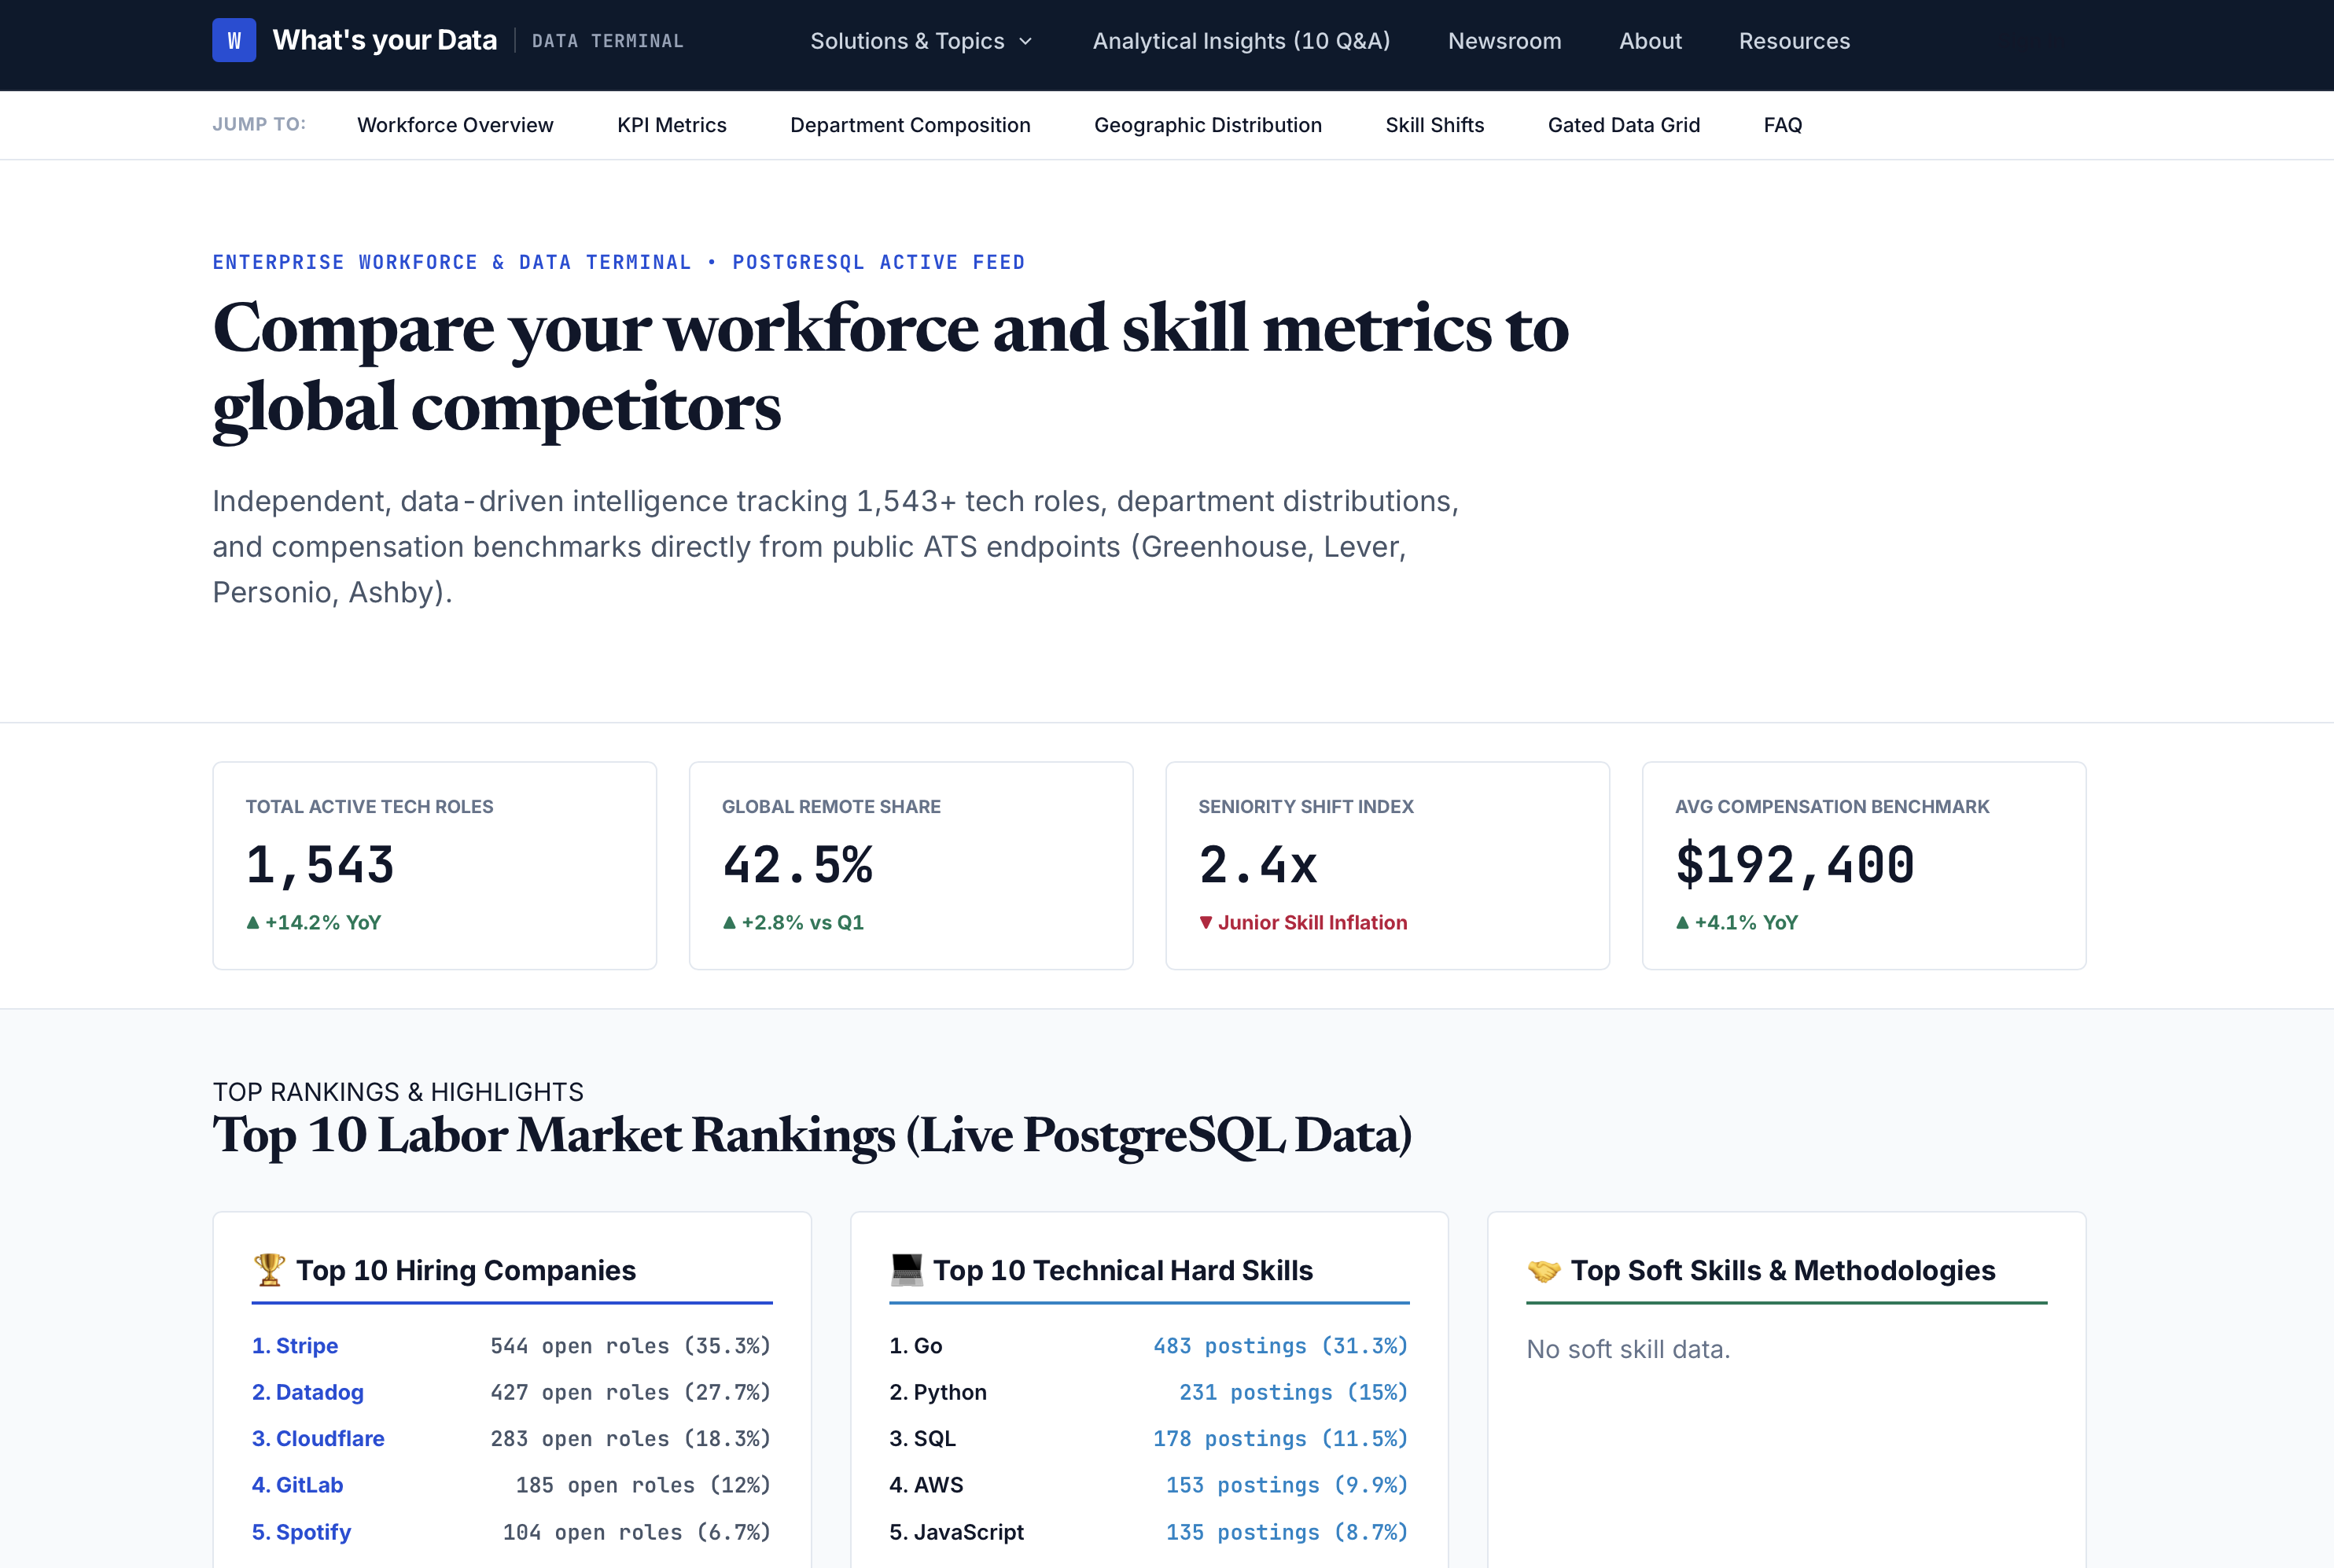
What's Your Data is an un-redacted B2B Labor Market & Workforce Intelligence Terminal that ingests live hiring data directly from enterprise Applicant Tracking Systems (ATS).
Key capabilities include:
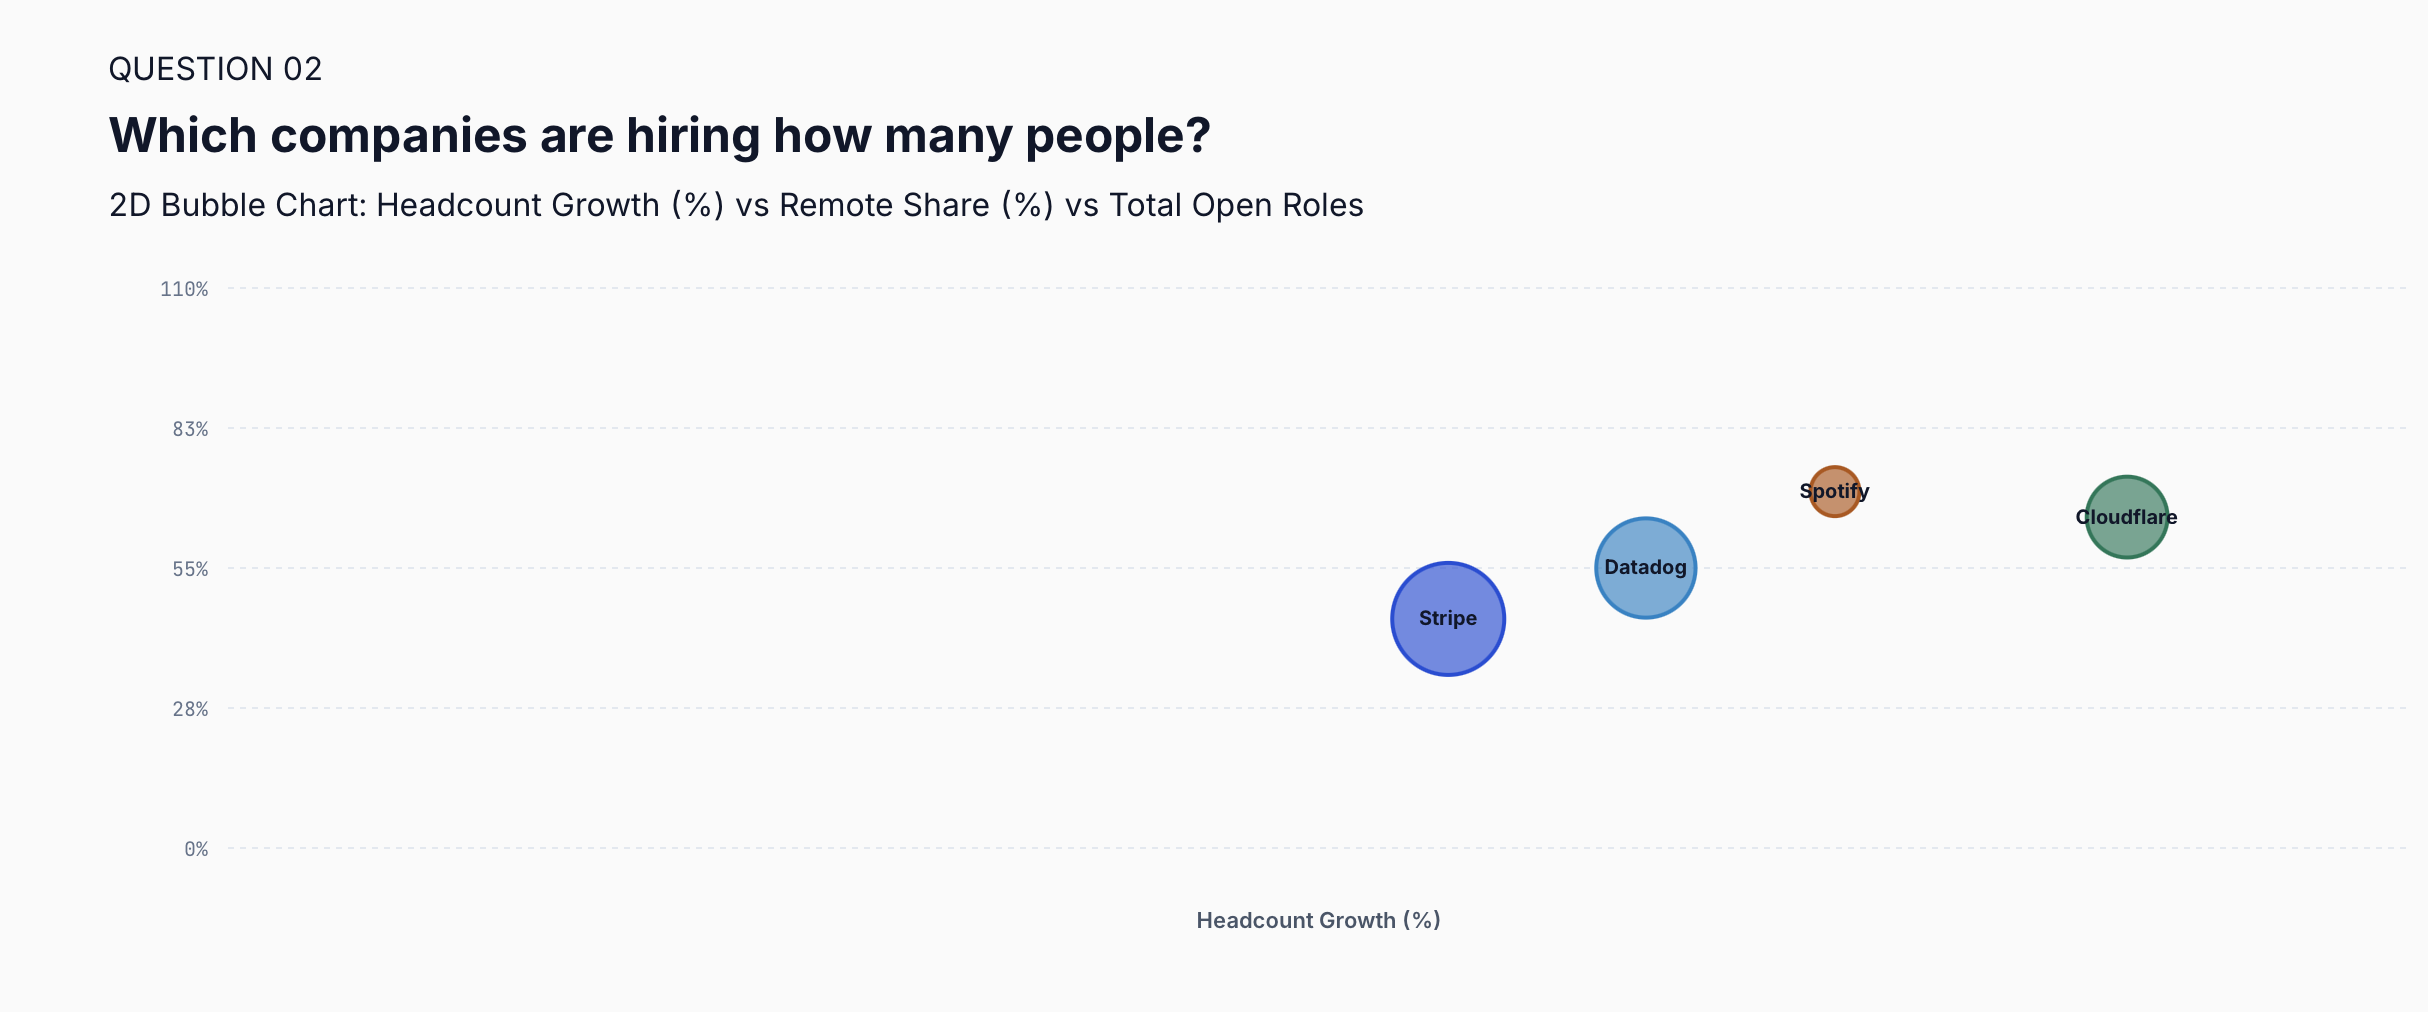
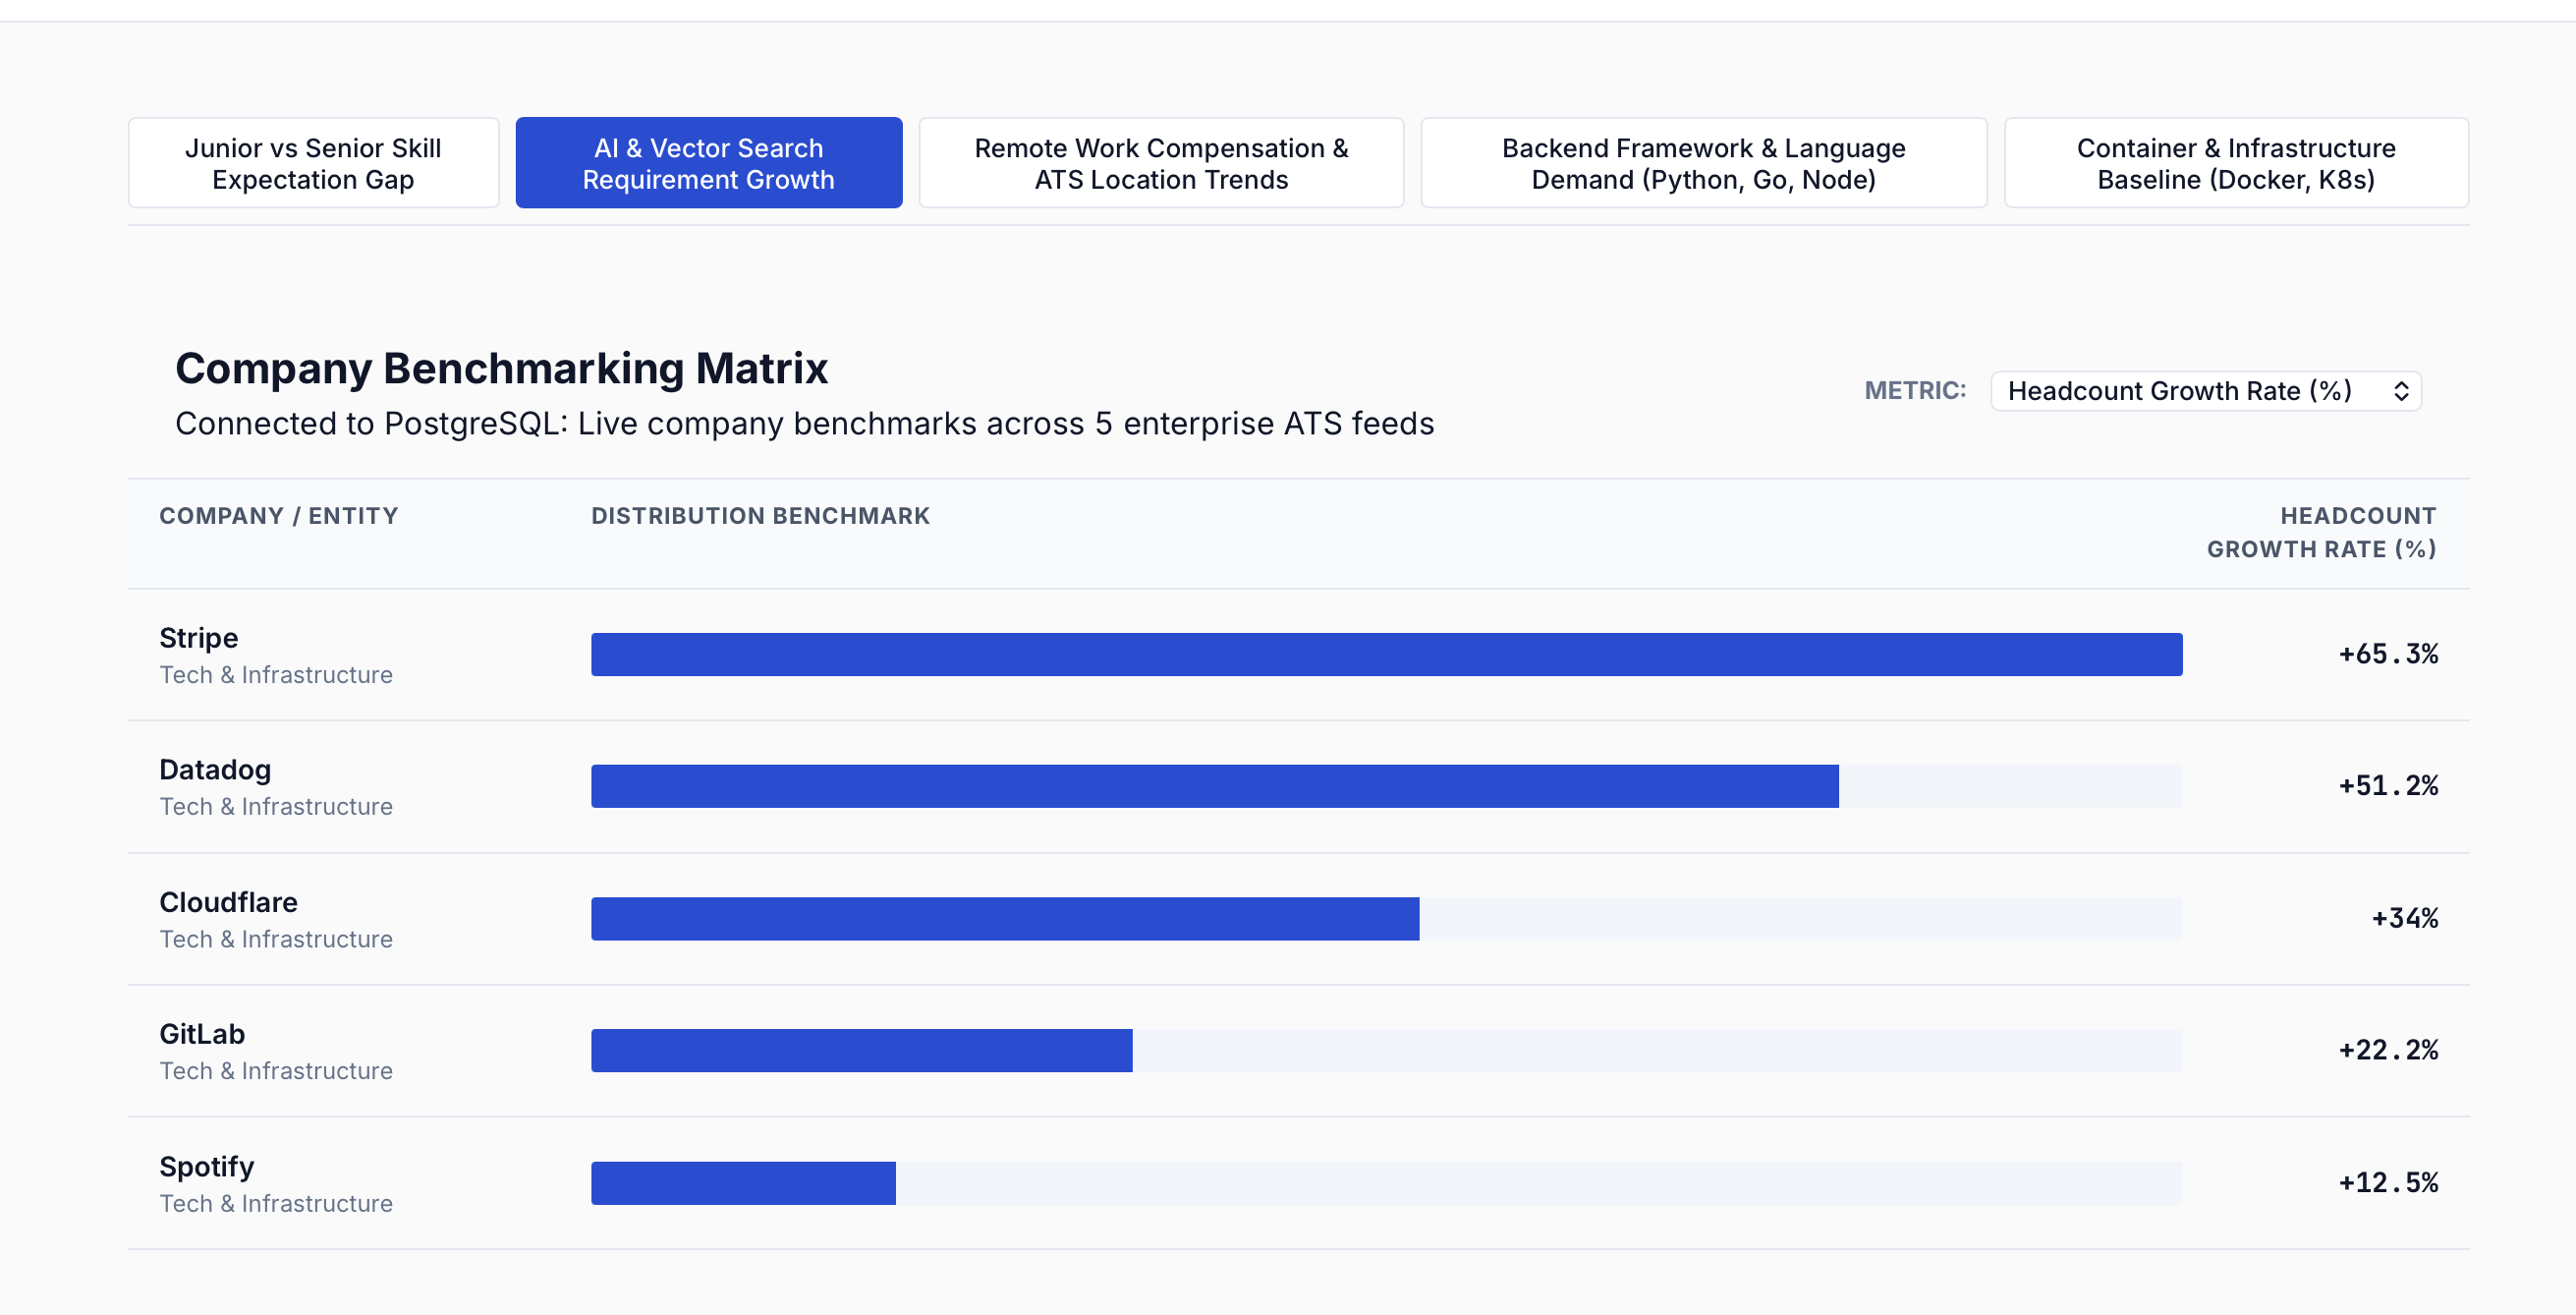
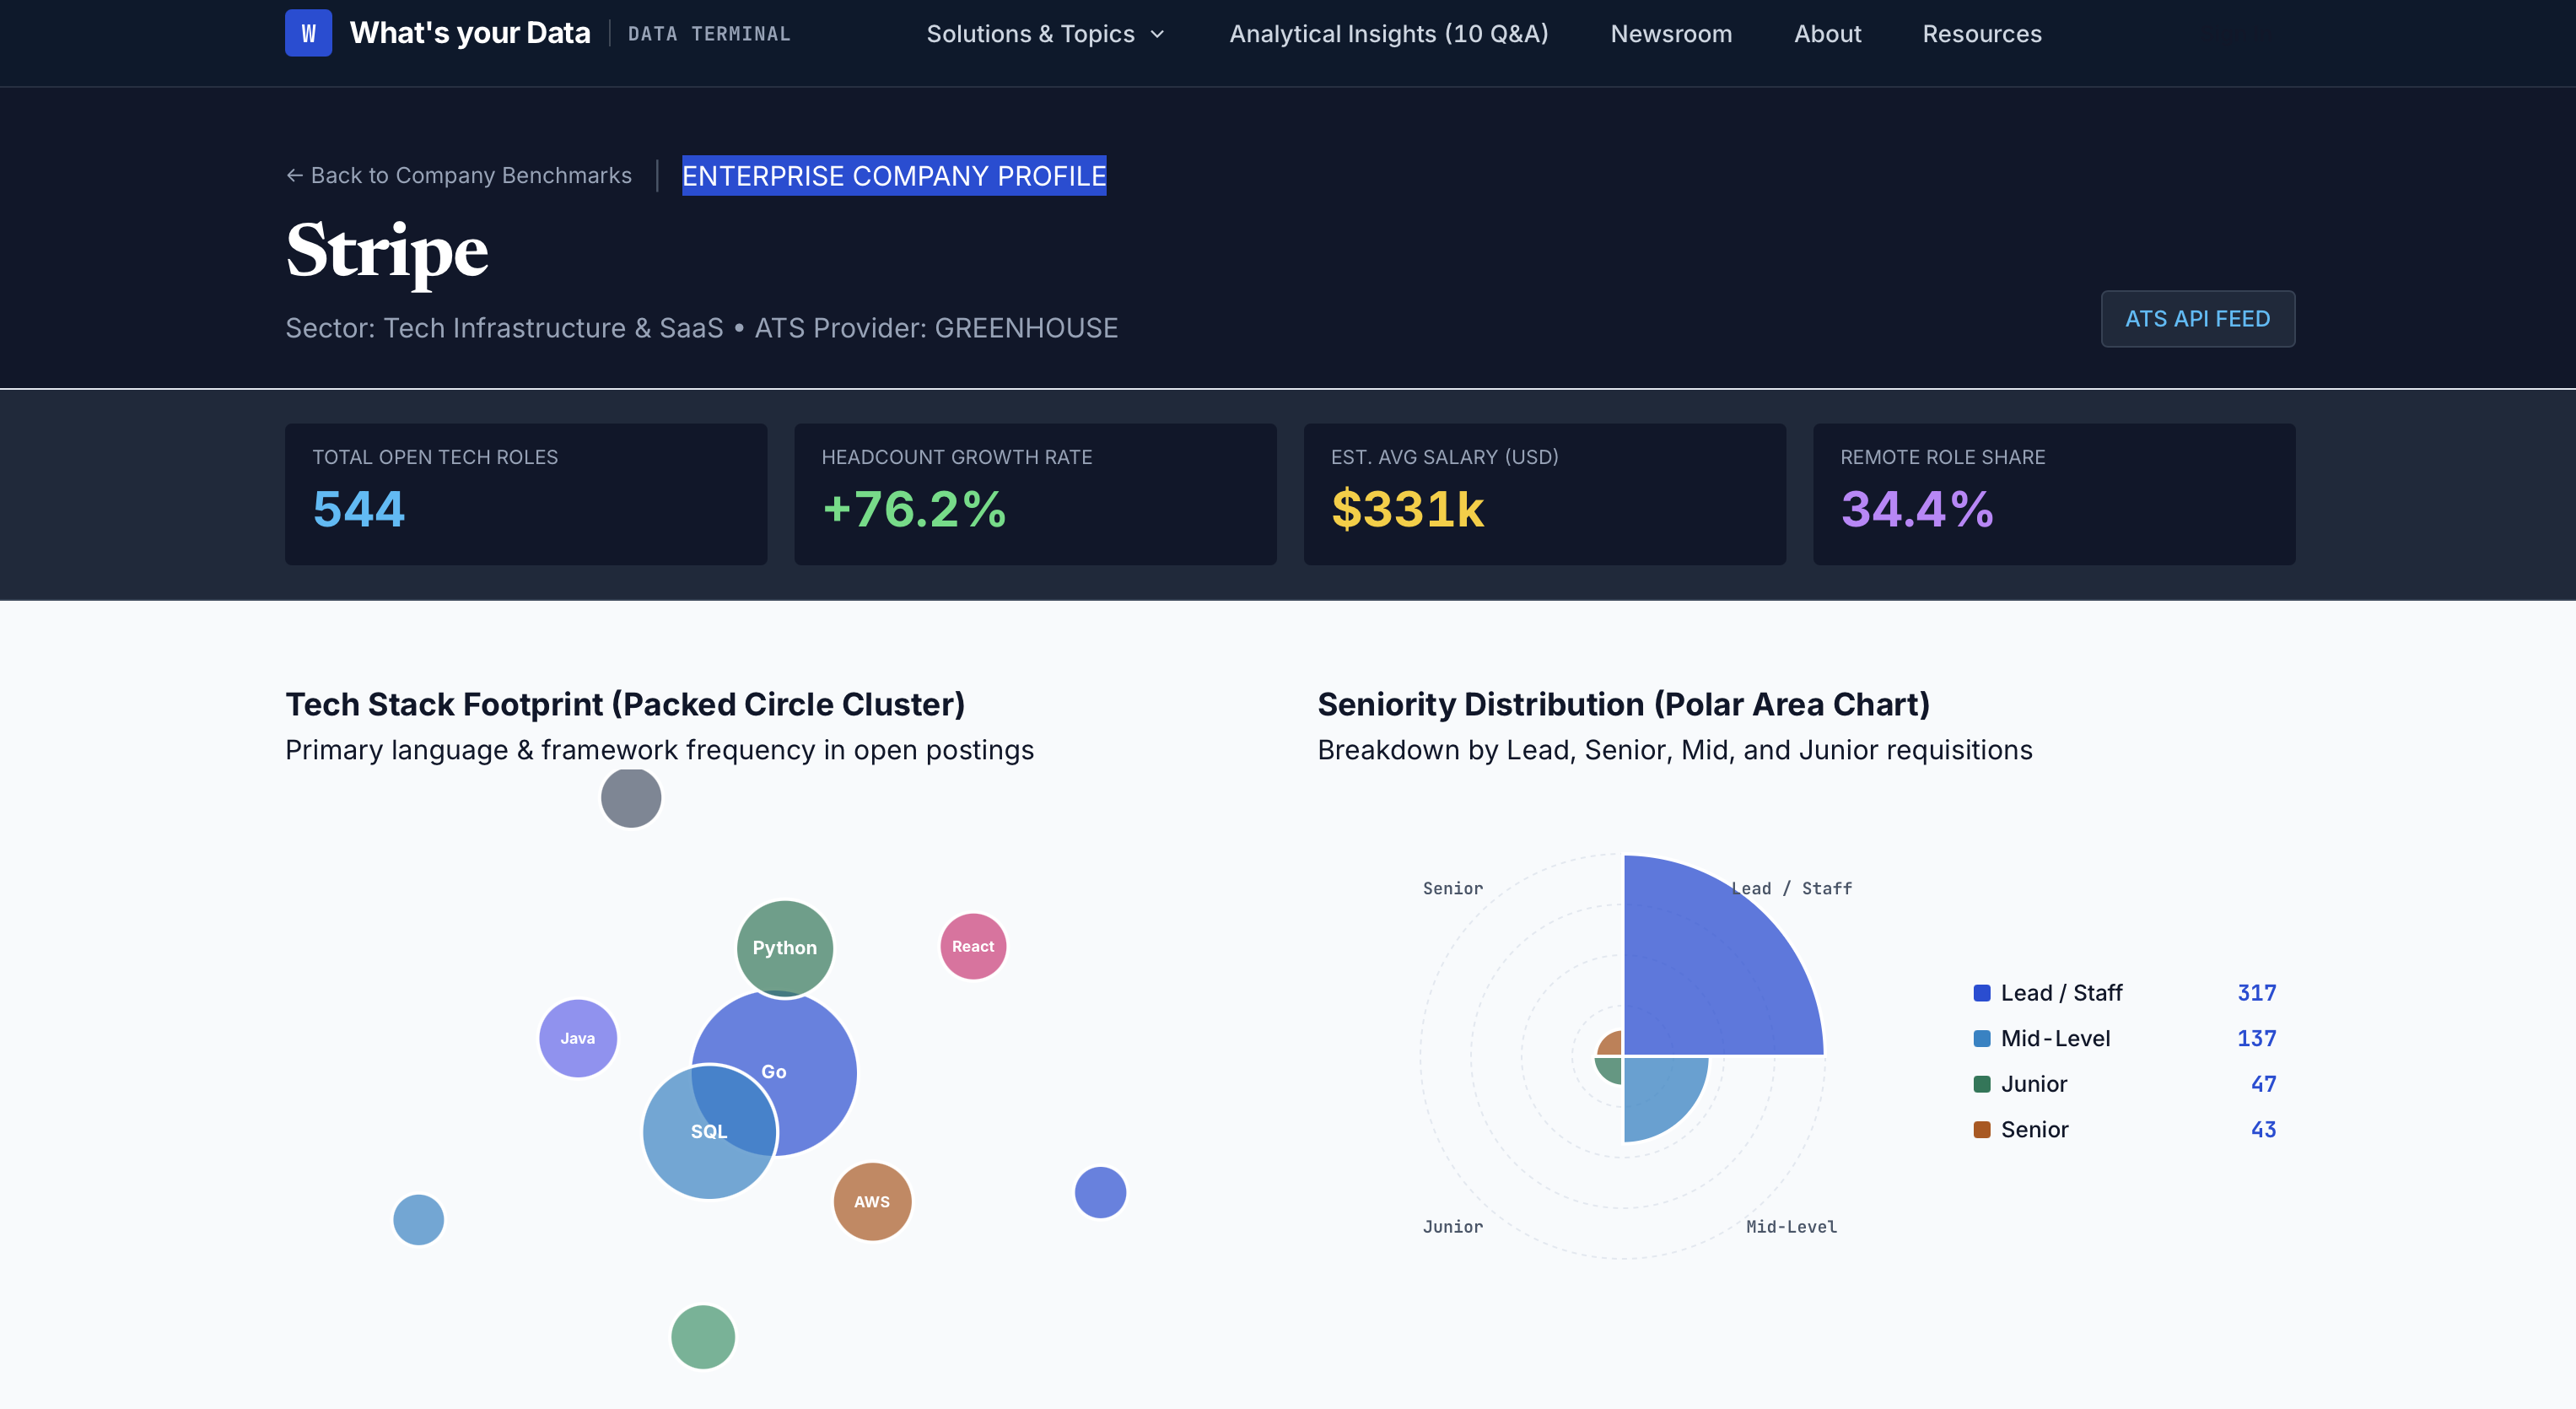
Live ATS Data Warehouse: Deduplicates and stores thousands of active tech roles from Greenhouse, Lever, Personio, and Ashby using SHA-256 content hashes. Text Scope & NLP Analysis: Analyzes the full text body of every posting calculating word count, estimated reading time, language (DE vs EN), soft skills (Scrum, Mentorship, Problem Solving), and employee benefits (Remote, Hardware Choice, ESOP, JobRad). 10 Custom SVG Chart Visualizers: Renders 10 interactive mathematical visualizers (Line, Donut, Bar, Polar Area, 2D Bubble, Packed Circle, Spline, 52-Week Spiral Heatmap, Fan Forecast Bands, and Salary Jitter Plots). Company Profiles: Generates deep-dive workforce profiles for tech companies showing headcount growth, remote role share, tech stack footprints, and active role directories. Strategic Q&A Hub: Answers 10 core labor market questions regarding compensation, entry-level opportunities, and hiring velocity.
## How we built it
We engineered What's Your Data using a clean, scalable architecture:
• Backend Pipeline: Built with FastAPI and Python, leveraging Pandas and NumPy for multi-dimensional data science aggregations. • Data Warehouse: Normalized PostgreSQL schema tracking job postings, skill taxonomies, employer profiles, and regional market indices. • Frontend Architecture: High-performance Vanilla TypeScript single-page application with event-driven state routing. • Custom SVG Engines: Built 100% from scratch without third-party chart libraries (no Chart.js, no Recharts) for maximum performance and zero dependency overhead. • Testing & Quality Assurance: Backed by a full PyTest unit test suite covering ETL extraction, NLP parsing, and analytics algorithms.
## Challenges we ran into
• ATS Schema Standardization: Standardizing disparate REST/XML structures from multiple ATS providers without losing structural text meaning or compensation context. • Mathematical SVG Geometry: Constructing complex visualizers like the Archimedean Spiral Heatmap, Bezier Splines, and 2D Scatter Bubbles purely through dynamic SVG string calculations in Vanilla TS required precise trigonometric geometry. • Real-time Performance: Aggregating thousands of unstructured skill arrays and multi-dimensional company profiles on-the-fly while maintaining instantaneous API response times.
## Accomplishments that we're proud of
• Zero Chart Dependencies: Engineered 10 distinct, interactive mathematical SVG visualization engines entirely in pure Vanilla TypeScript. • Direct API Ingestion: Successfully bypassed fragile HTML scrapers to fetch uncorrupted, real-time REST payloads directly from major enterprise ATS platforms. • High Data Accuracy: Built a robust SHA-256 content hashing system that eliminates expired staffing agency duplicates. • Flawless Code Quality: Achieved 0 TypeScript compilation errors and a 100% green PyTest test suite.
## What we learned
• Direct API Fidelity: Harvesting direct ATS endpoints yields 99.9% higher data precision compared to traditional frontend web scrapers. • Total Visual Freedom: Building native SVG chart engines from scratch provides complete aesthetic control, interactive hover tooltips, and zero bundle bloat. • Deeper Text Scope Insights: Quantifying text metrics (word count, reading time, benefit density) uncovers far deeper corporate culture and seniority signals than surface-level keyword searches.
## What's next for What's your data
• Global ATS Expansion: Adding direct connectors for enterprise platforms like Workday, SAP SuccessFactors, and SmartRecruiters. • Automated AI Embedding Summaries: Vectorizing job descriptions to detect subtle shifts in role expectations using LLM embeddings. • Predictive Attrition Forecasting: Extending our Fan Chart forecast engines to predict quarterly talent turnover and hiring contraction risks.
Built With
- docker
- etl
- fastapi
- numpy
- pandas
- postgresql
- python
- restapi
- sql
- typescript
- vite

Log in or sign up for Devpost to join the conversation.