-
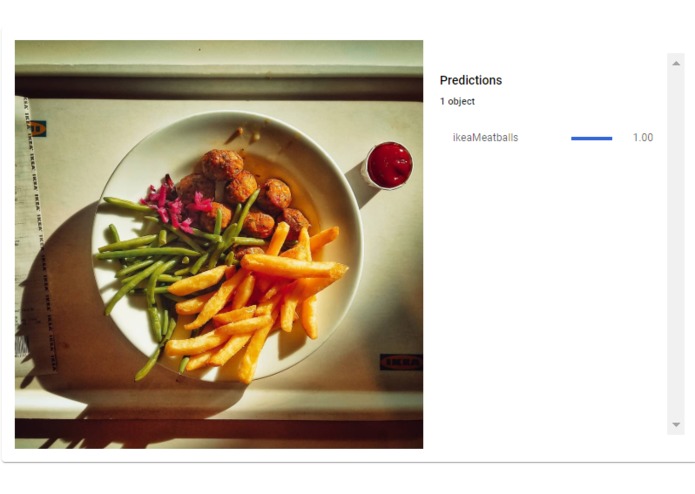
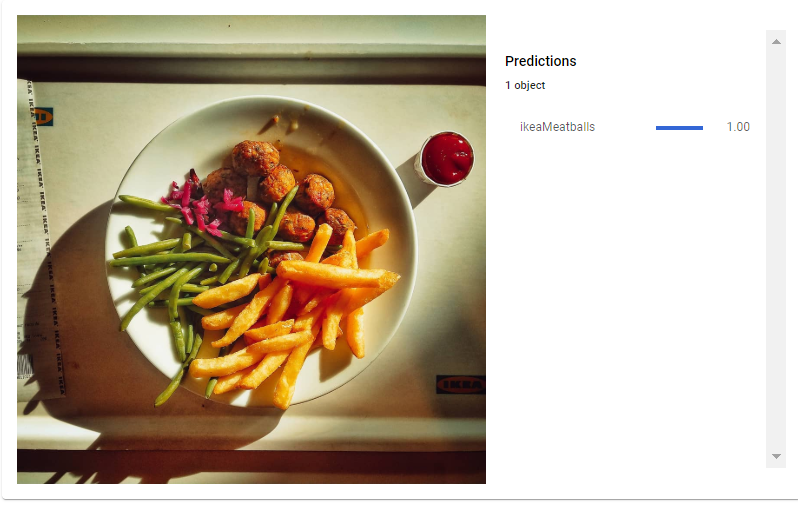
meatball accuracy from an actual instagram post
-
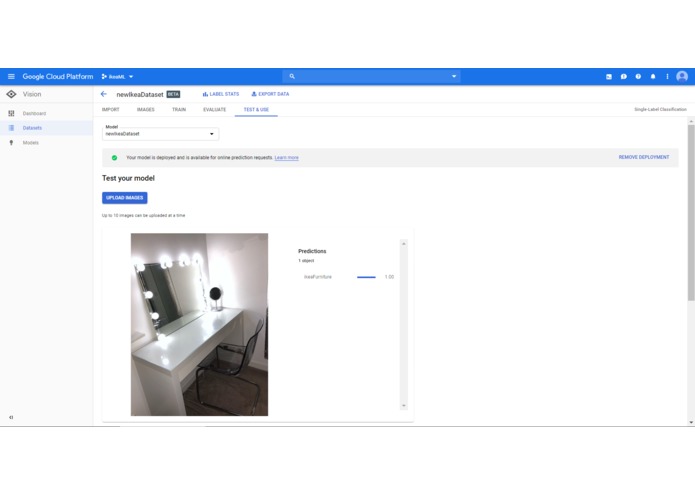
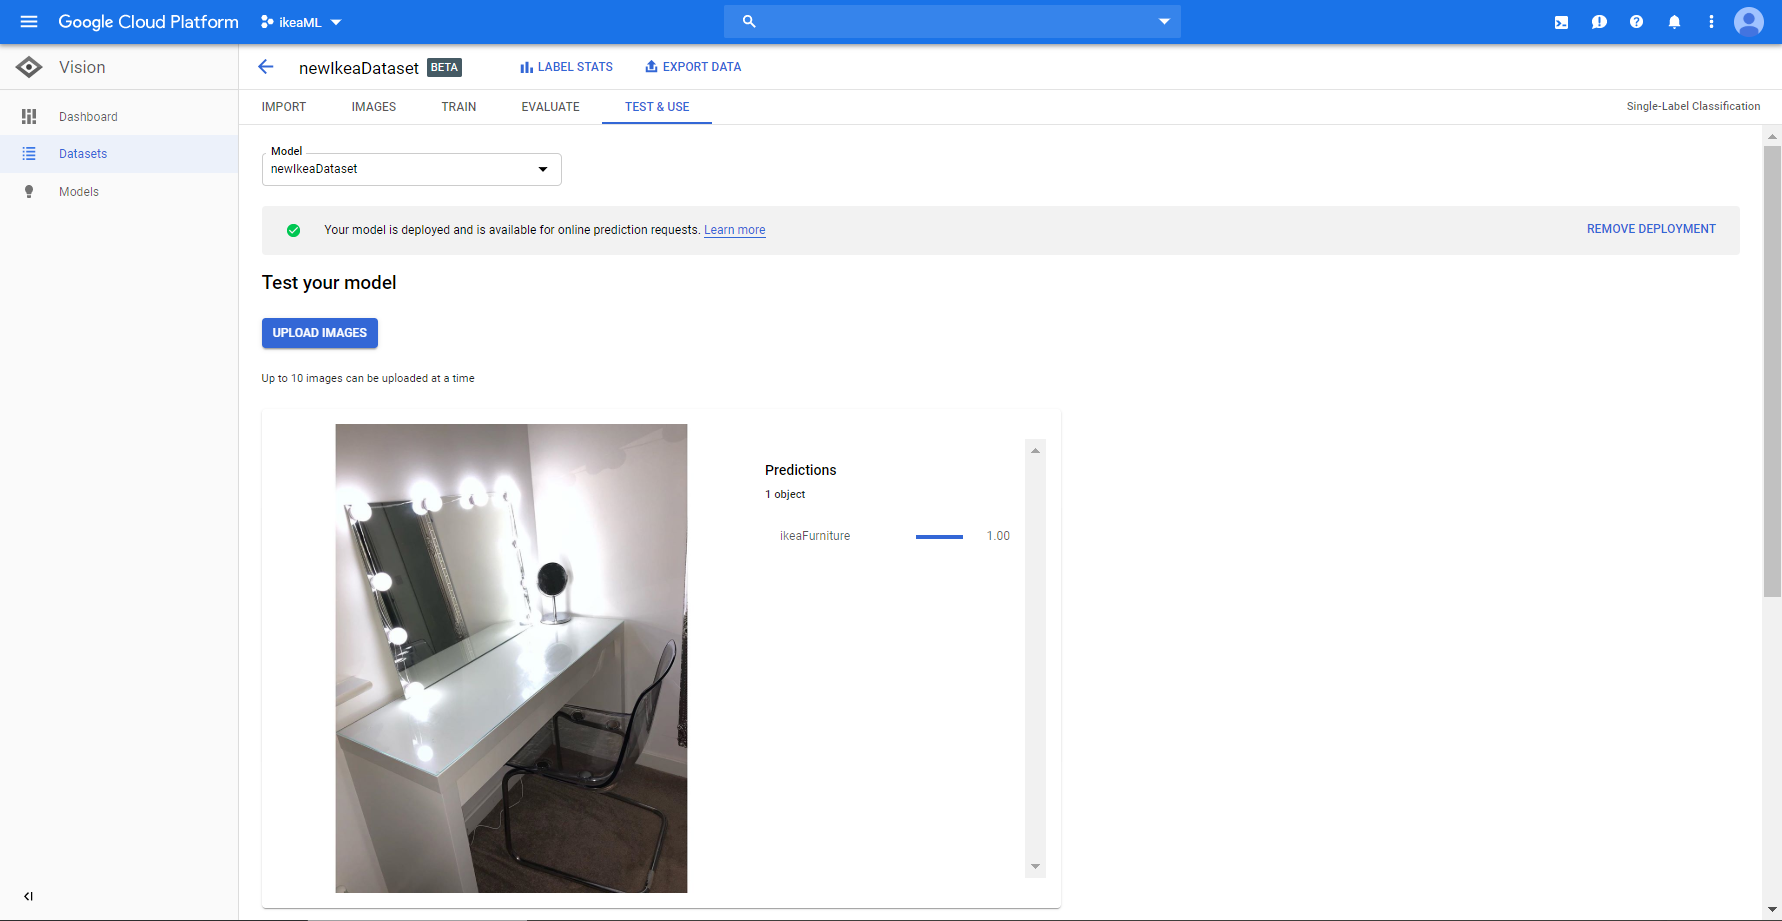
furniture accuracy from an actual instagram post
Companies spend a lot of money on advertisement and analytics can sometimes be difficult to assess.
How this would be used: Let's say Ikea wants to put out this huge ad campaign for their meatballs. They would use the _ What's my Status _ website to grab today's instagram images for the hastag #ikea - the backend would feed this to my model and it would spit out the percentage of users that have ikea meatballs in their posts. They would put out their campaign and monitor the percentage of users posting about meatballs using this website!
My idea is to train a model on different products a company offers then feed that model user images to assess engagement.
I gathered user images from instagram using a python library called instaloader. I grabbed hundred of images tagged "#ikea"
I then scraped images off google for two queries "ikea meatballs" && "ikea furniture" using another library called googleimagesdownload
I hosted these images on google cloud storage then created a csv with the uri and tag (ikeaMeatball/ikeaFurniture)
I used Google Vision AutoML to train a model on about 600 images 300 for each tag
I wrote up a quick Dash website (dash is a python library for building web apps) to show how this might look once we connect all the pieces.
Challenges I ran into
Downloading and working with all the tooling
Accomplishments that I'm proud of
how much I learned!
What I learned
How to tag images for machine learning, using the google vision API, more about the Dash library, how to debug python package bugs ( had a chromedriver issue with the google image downloader)
What's next for What's the Stats
Really build it out, its all about connecting the different pieces and adding more images and tags for the model. I would also love to see text being used as a part of this as well, maybe gather twitter posts and sentiment toward the products.
Log in or sign up for Devpost to join the conversation.