-
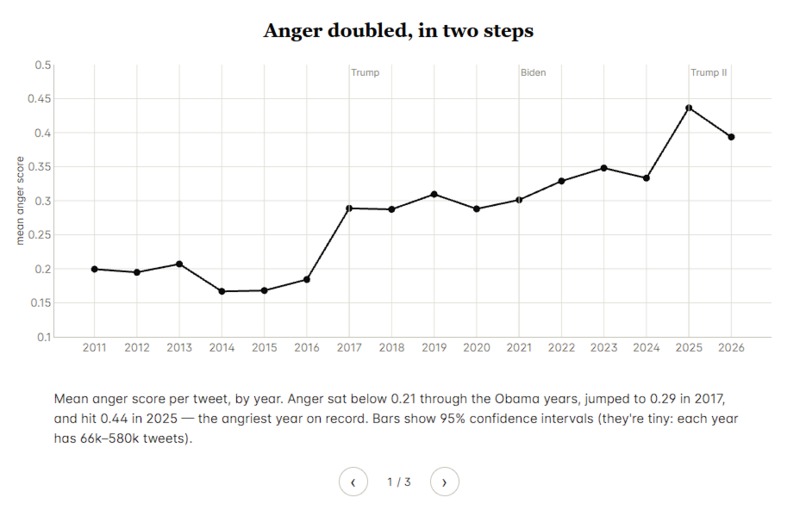
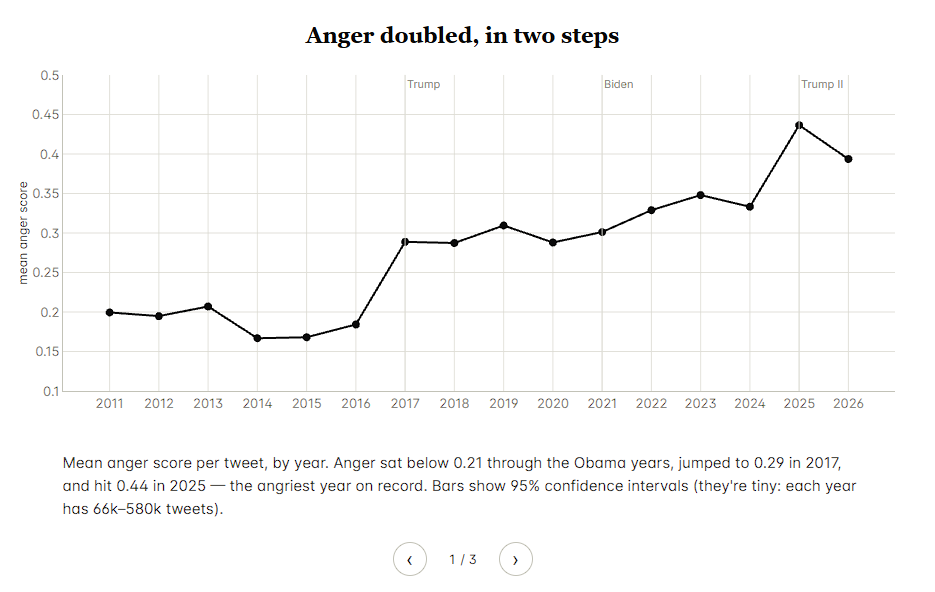
Change over time
-
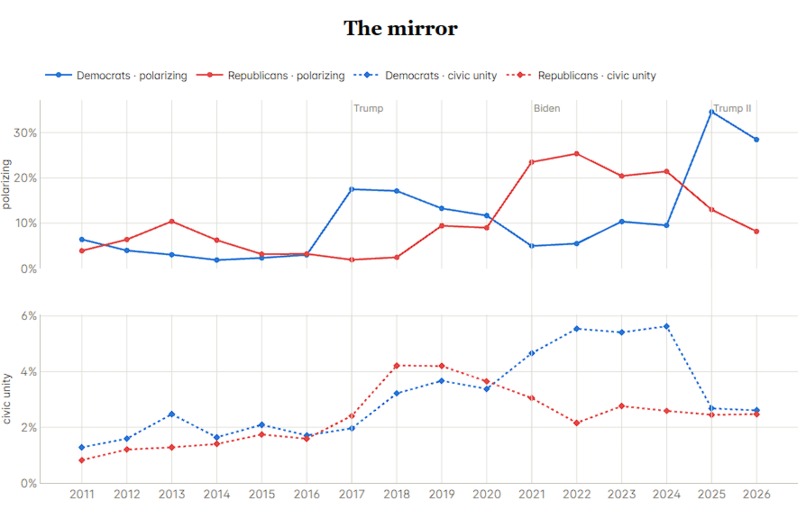
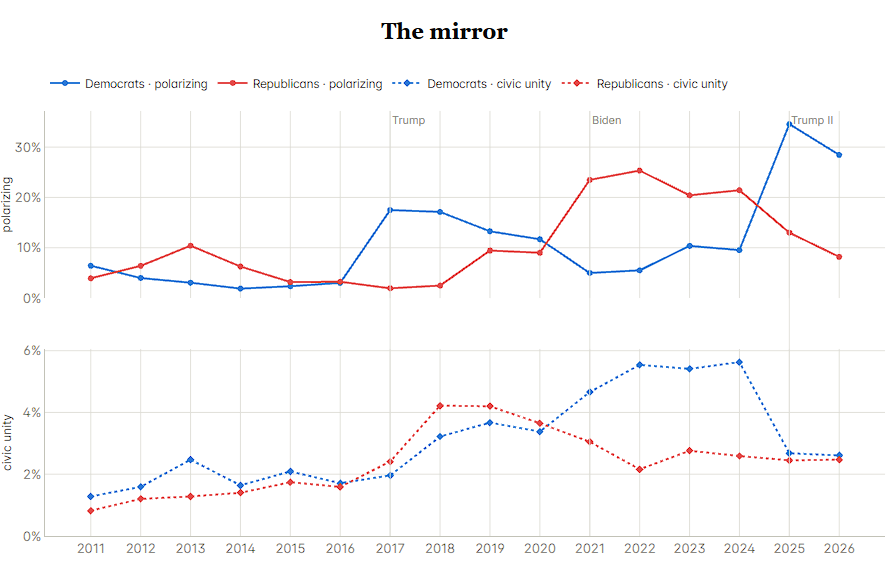
The mirror effect
-
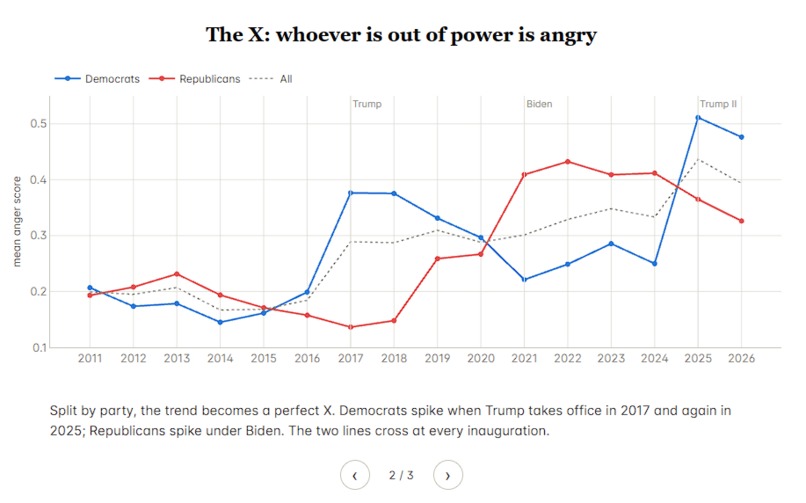
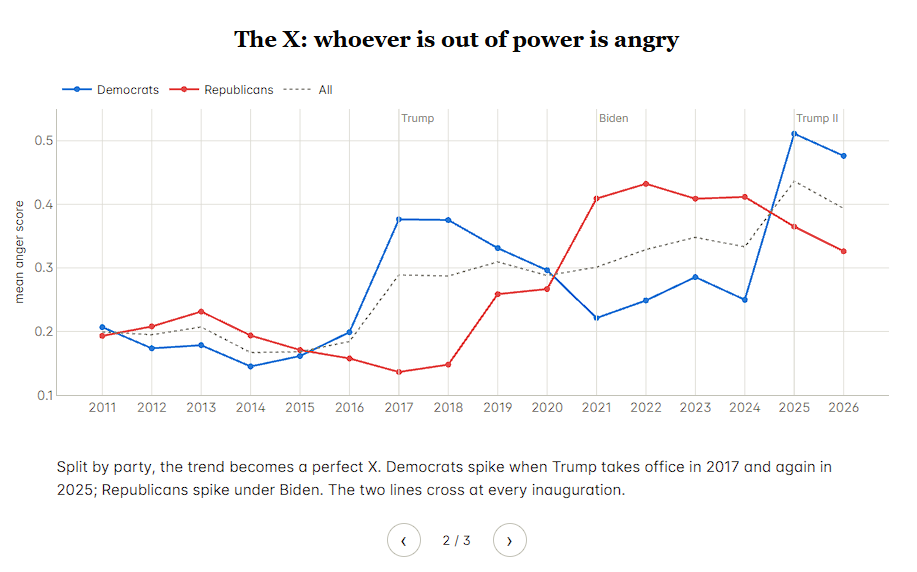
Change over time - per party
-
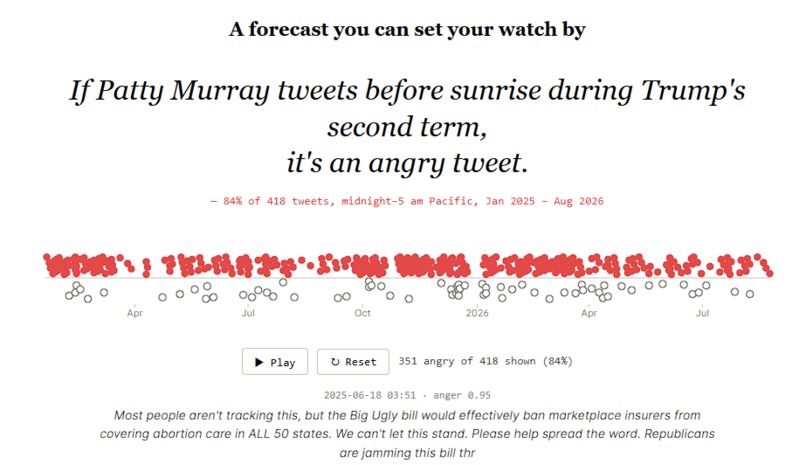
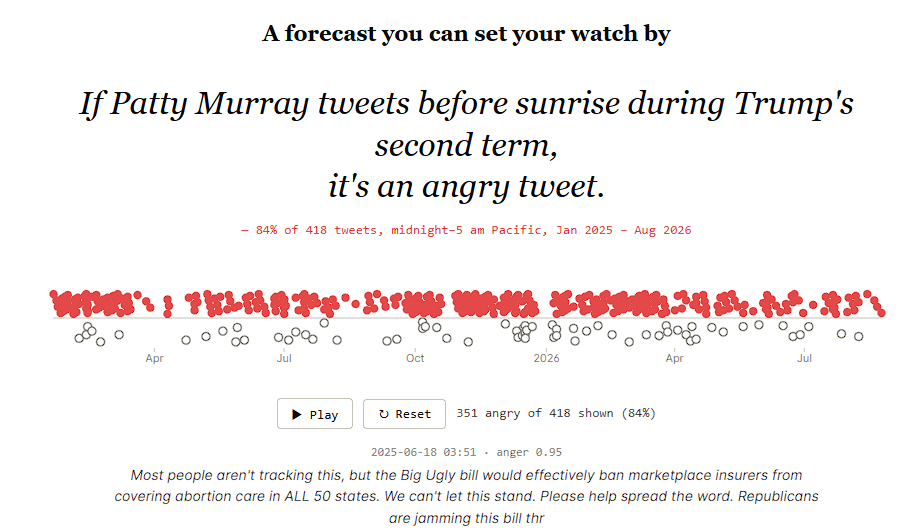
Case study - 1
-
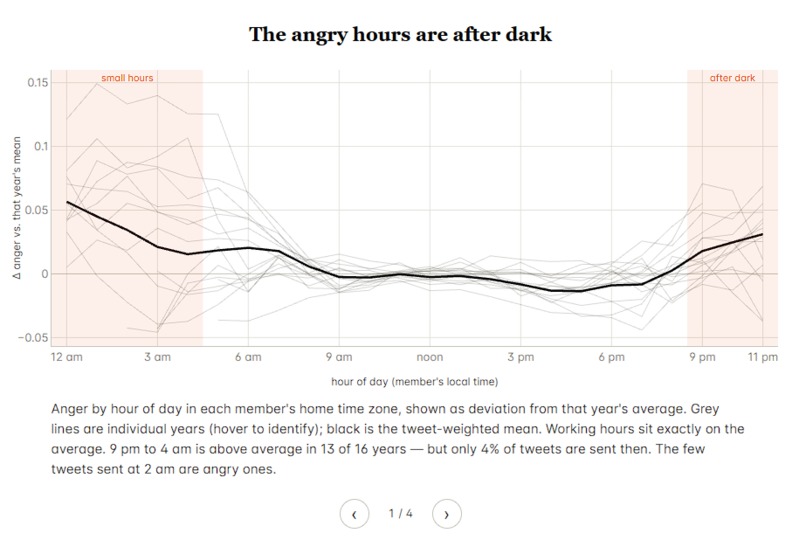
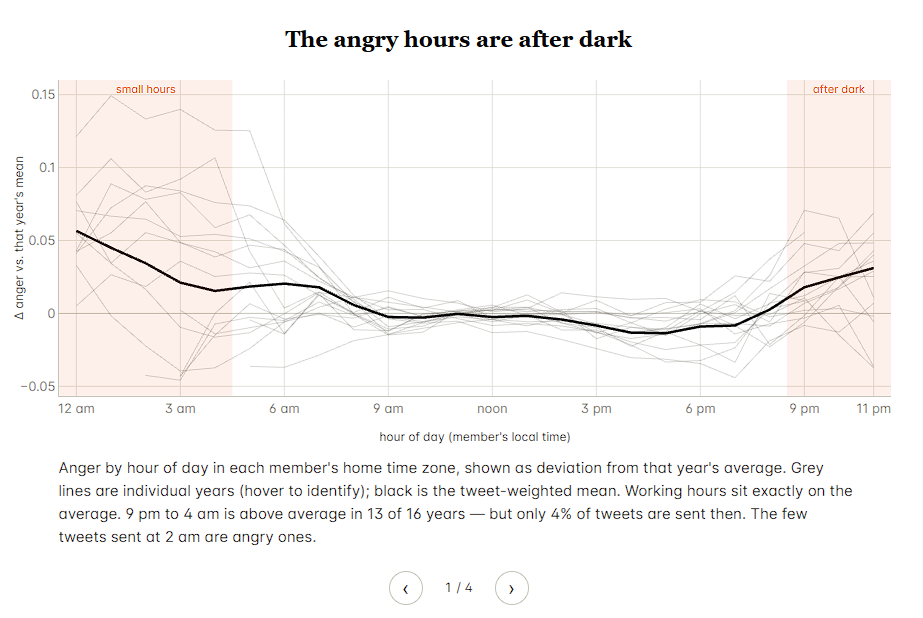
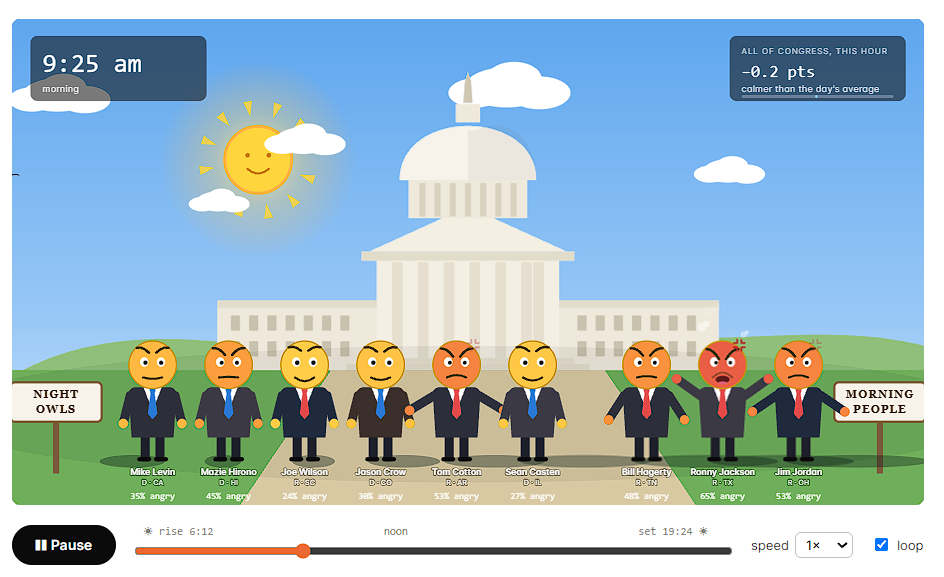
The effect of time of the day
-
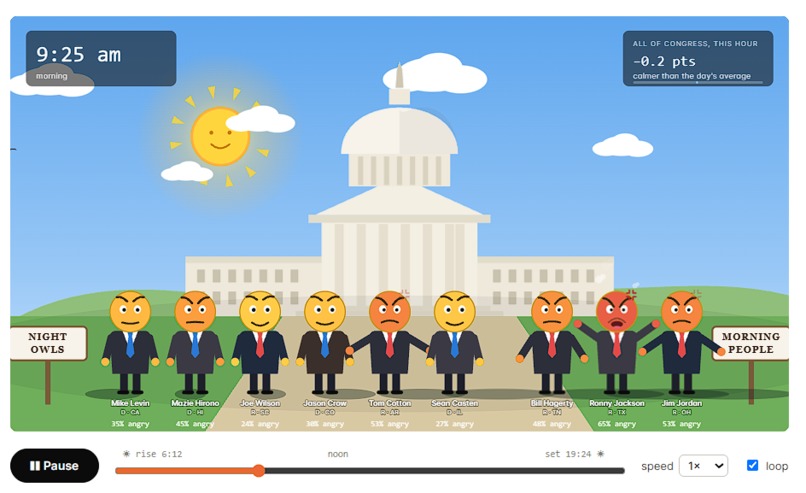
Story time - A life in a day
-
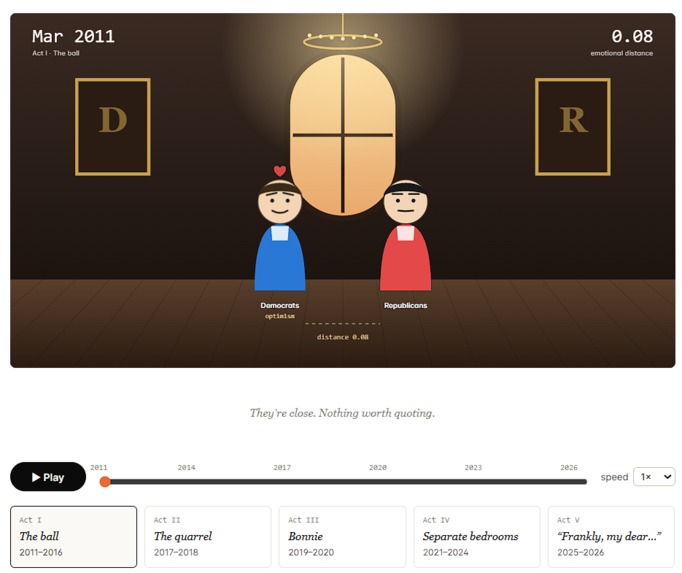
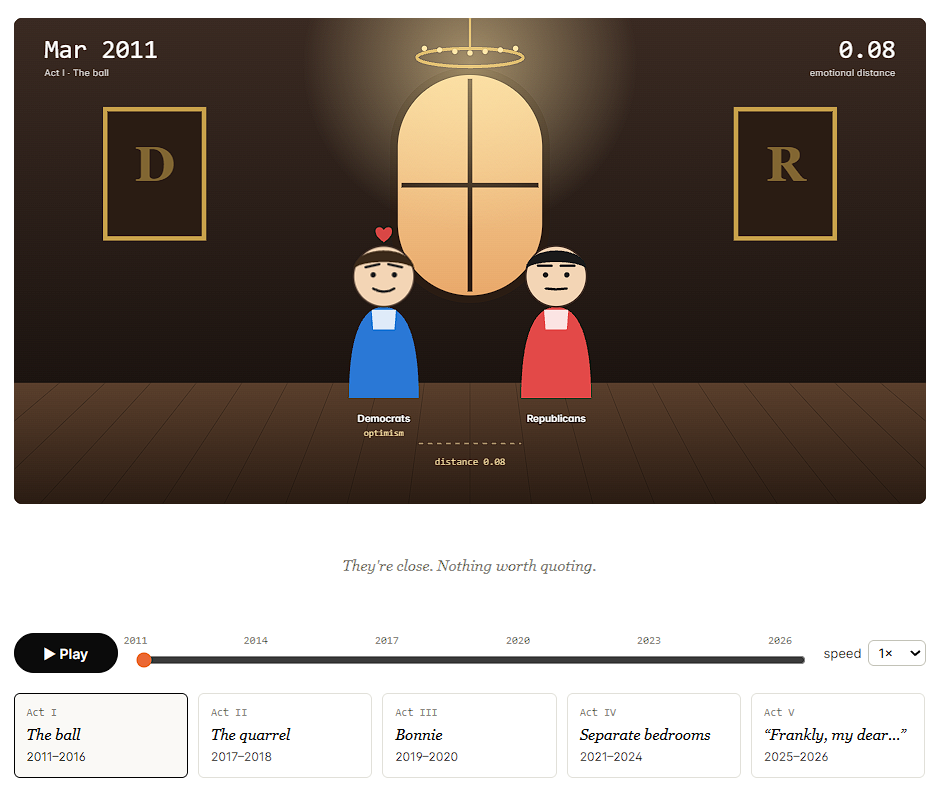
Story time - Love story
-
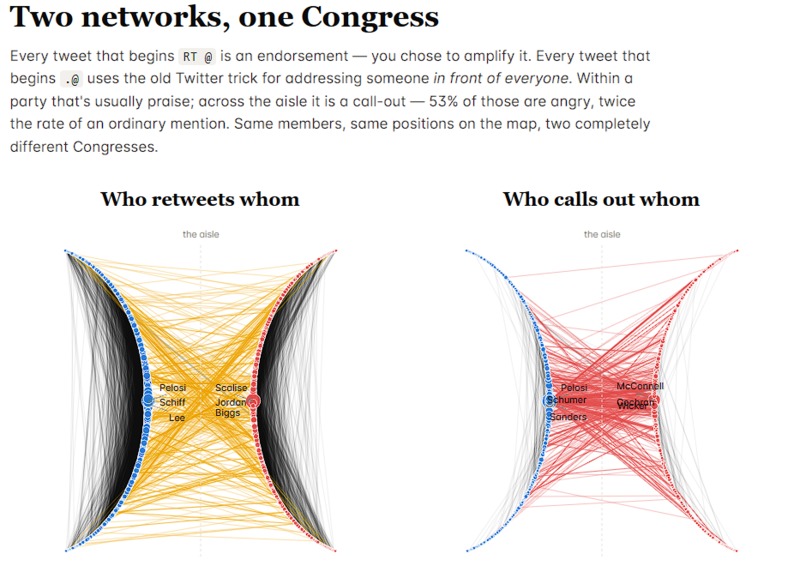
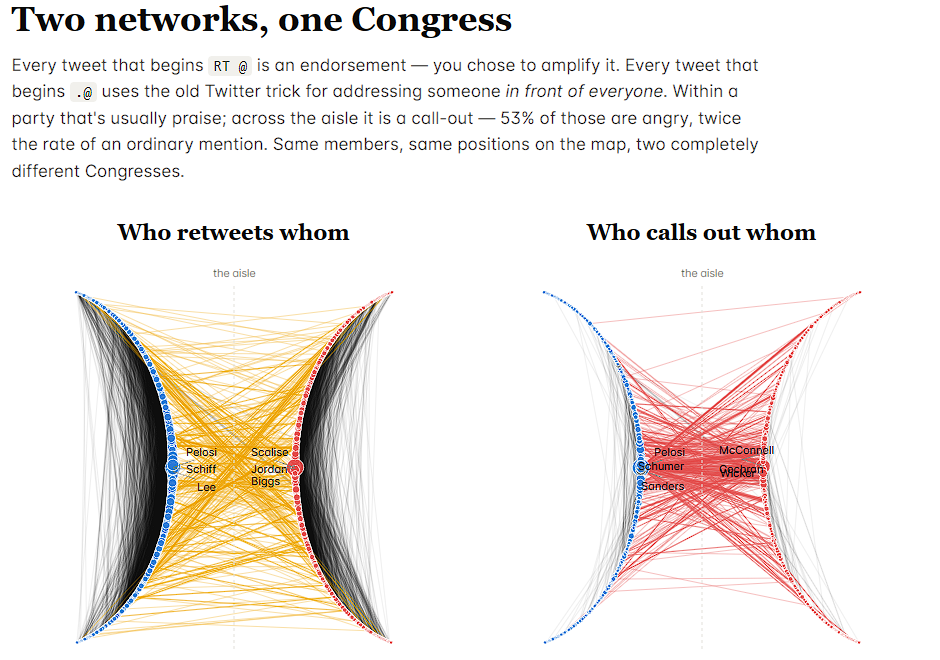
Reposts (Retweets) and Mentions
Inspiration
Inspired by the Memetic session given on Friday about the propagation of information in the current day, and understanding how sentiment changes depending on different factors, and if there are patterns that are not obvious that could help us understand how people of power interact "online".
What it does
Visualization of the emotion reflected in tweets by US congress from 2011 to 2025. We show how the sentiment changes through time, and what part of the aisle is bitter at times.
How we built it
We downloaded tweet data shared from the Memetic track challenge. That data consisted basic information about the tweet including the tweet id, time, author identifier, party and the tweet text. Using the tweet text we generated a tweet sentiment data using the RoBERTa (a variation of BERT) model trained on tweets. Using these sentiment data we analyzed the pattens of congress member's tweet at different times. We also computed the age of each representative at each tweet for a part of analysis that takes the age of the representative into consideration.
Challenges we ran into
The biggest challenge during the development was waiting for my computer to finish labeling the semantics of each tweet.
Accomplishments that we're proud of
The biggest accomplishments are the patterns and insights we've gained from the additional sentimental classification we've applied to the data.
What we learned
People are more predictable than we think. Especially people of power.
What's next for What's making US angry?
Not making US angry.
Built With
- javascript
- marimo
- molab
- python

Log in or sign up for Devpost to join the conversation.