Skopós
Inspiration
Understanding the profound economic consequences of armed conflict is critical for policymakers, NGOs, and humanitarian organizations. Traditional economic models often struggle to quantify these impacts dynamically or visually. We built Skopós to bridge this gap, providing an accessible tool that estimates how conflict affects a nation's prosperity and well-being, specifically focusing on GDP per capita, Foreign Direct Investment (FDI), and poverty levels.
What it does
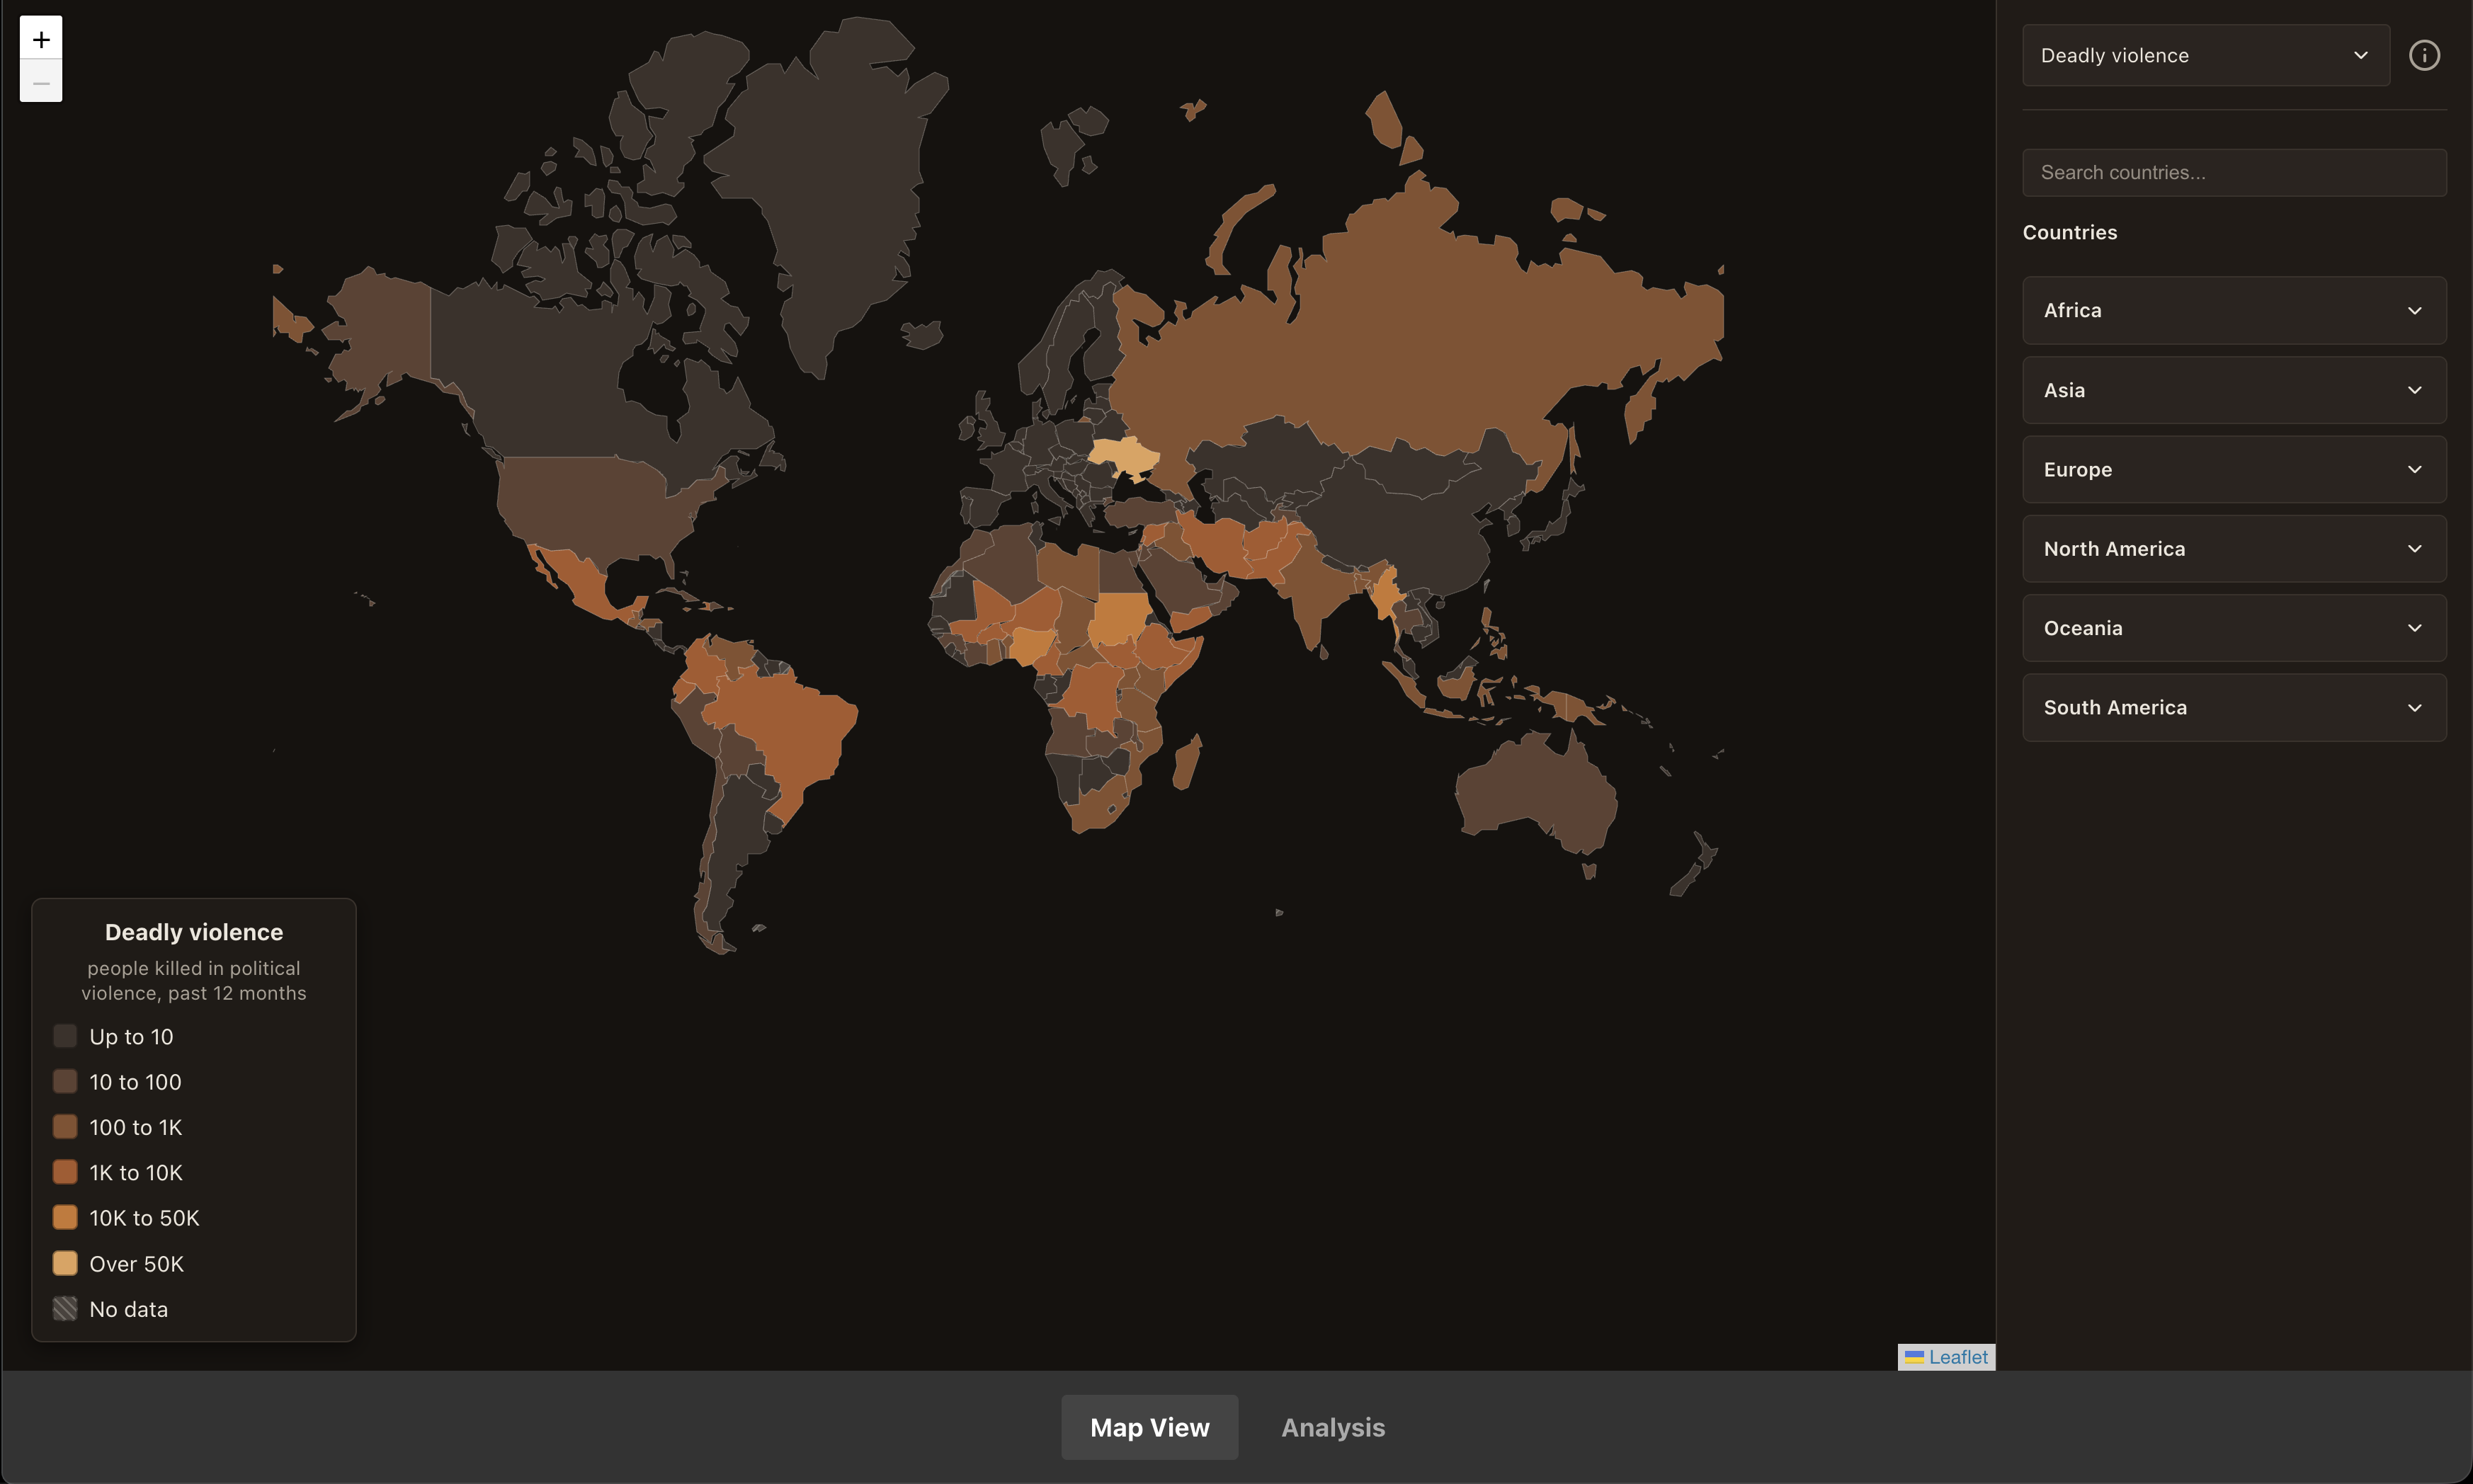
Skopós is an interactive, data-driven web application and geospatial intelligence dashboard. It allows users to explore historical data and estimate the economic toll of armed conflicts worldwide. Users can simulate custom scenarios—adjusting the onset year, duration, and intensity of a conflict—and the tool uses two-way fixed-effects local projections to project the resulting bands of impact on GDP, FDI, and poverty over time.
How we built it
Skopós features a separated backend and frontend architecture:
- Backend: Built with Python and FastAPI, creating a robust API layer. The heavy lifting for the modeling engine is powered by Pandas, NumPy, and linearmodels, which estimate the associational effects from long-format Parquet files (validated via Pandera). The simulations are generated via a hybrid ARIMAX and LSTM time-series model methods, outputting statistical confidence intervals (p5 to p95 bands) and headline projections.
- Frontend: A responsive web application built with React and Vite. We used React Router for navigation and Leaflet (react-leaflet) for interactive geospatial data visualizations, allowing users to select countries and see their history and projections seamlessly.
Challenges we ran into
- Statistical Modeling: Ensuring the two-way fixed-effects local projections correctly represented associational effects without making flawed causal claims required rigorous testing.
- Performance: Running Monte Carlo simulations dynamically on the fly is computationally intensive. We had to optimize the Python engine with vectorized Pandas and NumPy operations to return simulation results rapidly over HTTP.
- Data Quality: Dealing with sparse historical data, such as missing poverty metrics or unreported battle deaths prior to 1989, meant we had to build robust handling for null values and pre-trend warnings (e.g.,
PRETREND_SIGNIFICANT,NO_POVERTY_DATA).
Accomplishments that we're proud of
- Successfully building a real-time, interactive time-series forecasting model accessible directly from a browser.
- Establishing a clear API contract between the statistical modeling engine and the frontend.
- Integrating complex economic indicators into a user-friendly, visually engaging mapping interface.
What we learned
We deepened our knowledge of spatial-temporal data visualization, advanced statistical methods like local projections, and full-stack performance optimization. We also learned how crucial data validation (using Pandera and Pydantic) is when bridging the gap between raw data ingestion and a live web service.
What's next for Skopós
In the future, we plan to incorporate more robust causal inference methods, expand the indicators to include metrics like education and healthcare access, and allow for regional spillover effects (how conflict in one country affects its neighbors).


Log in or sign up for Devpost to join the conversation.