-
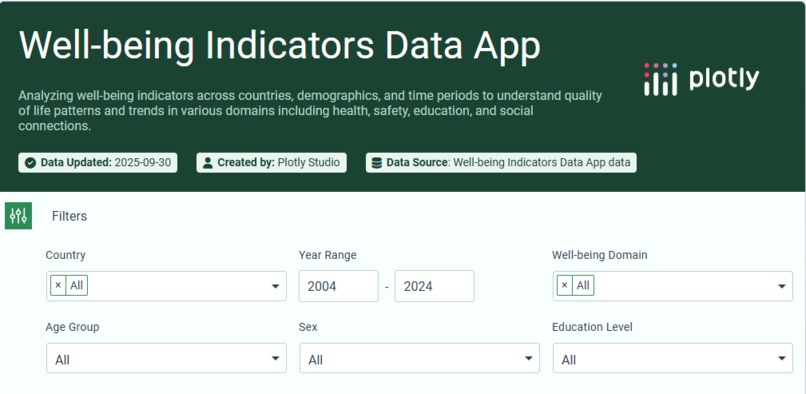
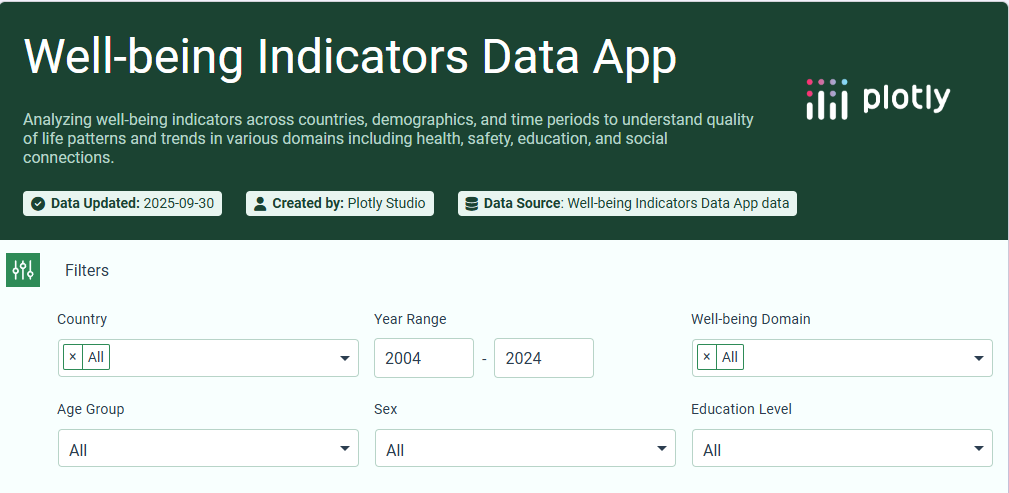
Homepage of the website
-
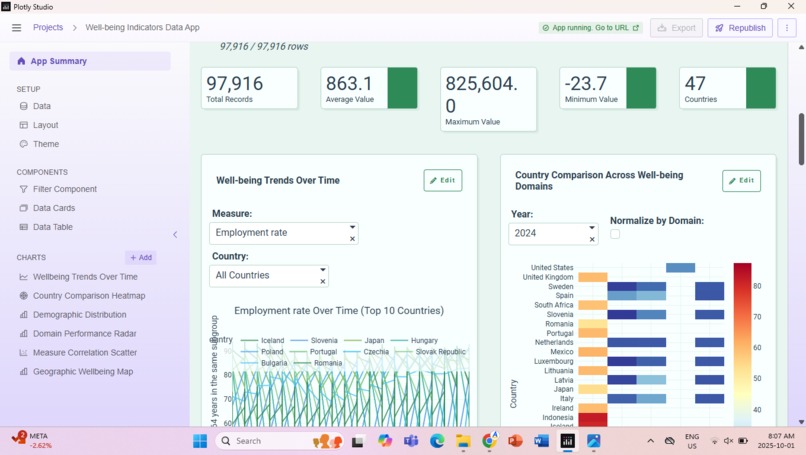
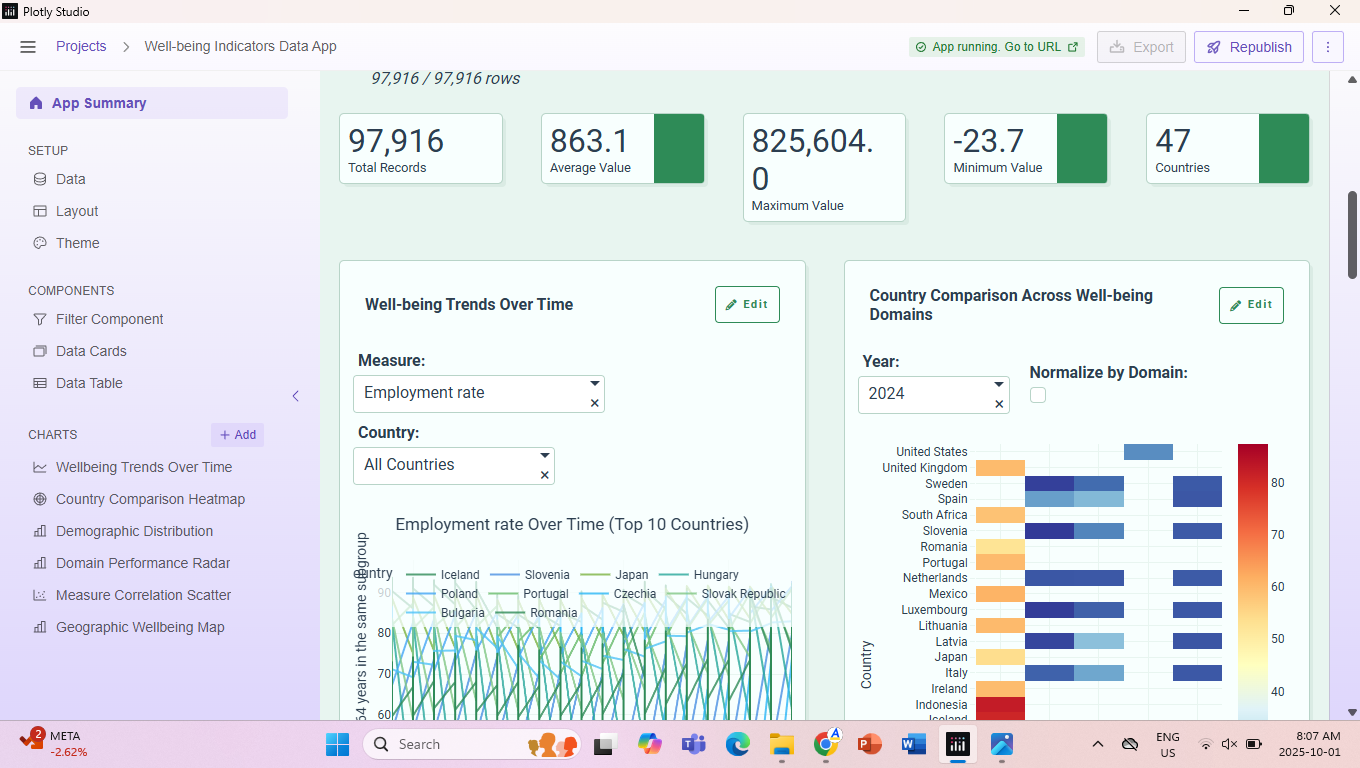
Wellbeing trends and Country comparisons
-
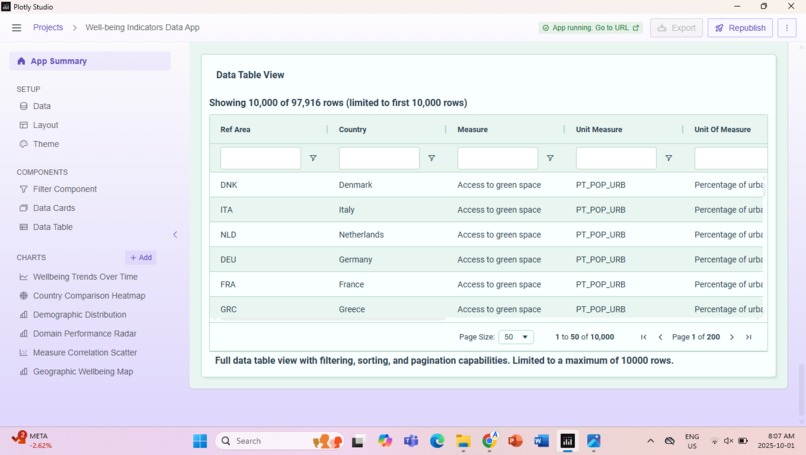
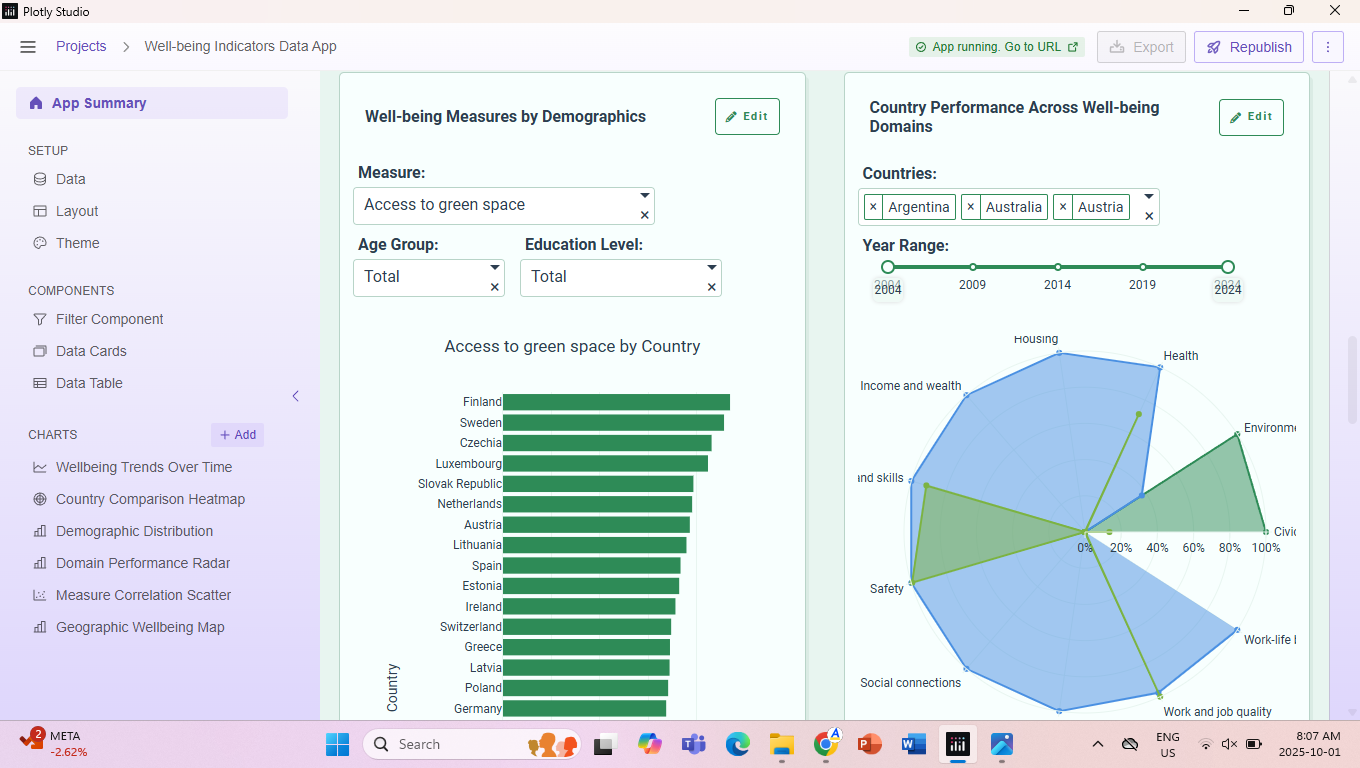
Wellbeing data of various countries
-

Bar graph and Pie Chart of wellbeing data

Inspiration:
I was inspired to work on this project due to the rise of mental health issues around the world. I created this website to show users the significant impact wellbeing.
What it does
It provides various data on wellbeing using data from the csv file.
How I built it
I used Plotly Studio to analyze the csv file and create a website from it.
Challenges I ran into
Changing the user interface was a challenge as I had to determine the importance of each set of graph. From there, I rearranged the data to provide the most essential information to users.
Accomplishments that I'm proud of
I am proud of creating a platform that helps users understand the impact of wellbeing around the world.
What I learned
I learned the importance of clean user interface as it is essential in providing users a clear roadmap of how to use a website. Without structure and design that guide users, an individual will not be able to reap the benefits of the website.
What's next for Well-being Indicators Dashboard
I aim to focus on a Calgarian demographic, providing surveys for people to determine their well-being, with their consent. Using this data, I would provide links to companies that provide solution, such as therapy and addiction support, to their most important problem. By making the website more engaging for users, I aspire to improve the wellbeing of people around the city.
Built With
- oecd-wellbeing.csv
- plotly-studio