-
A webb
Inspiration
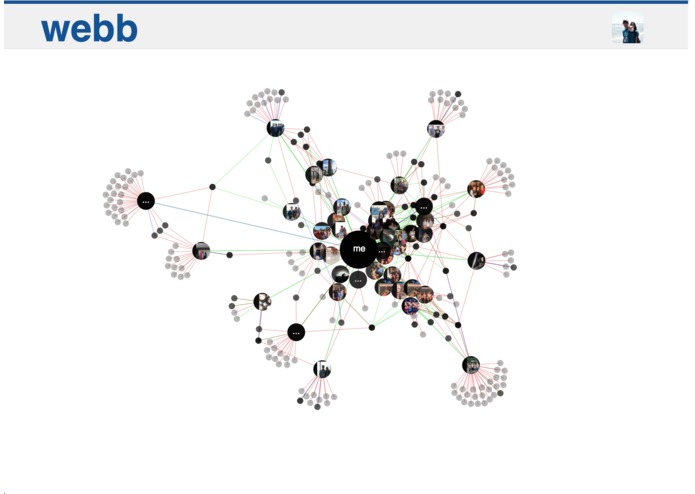
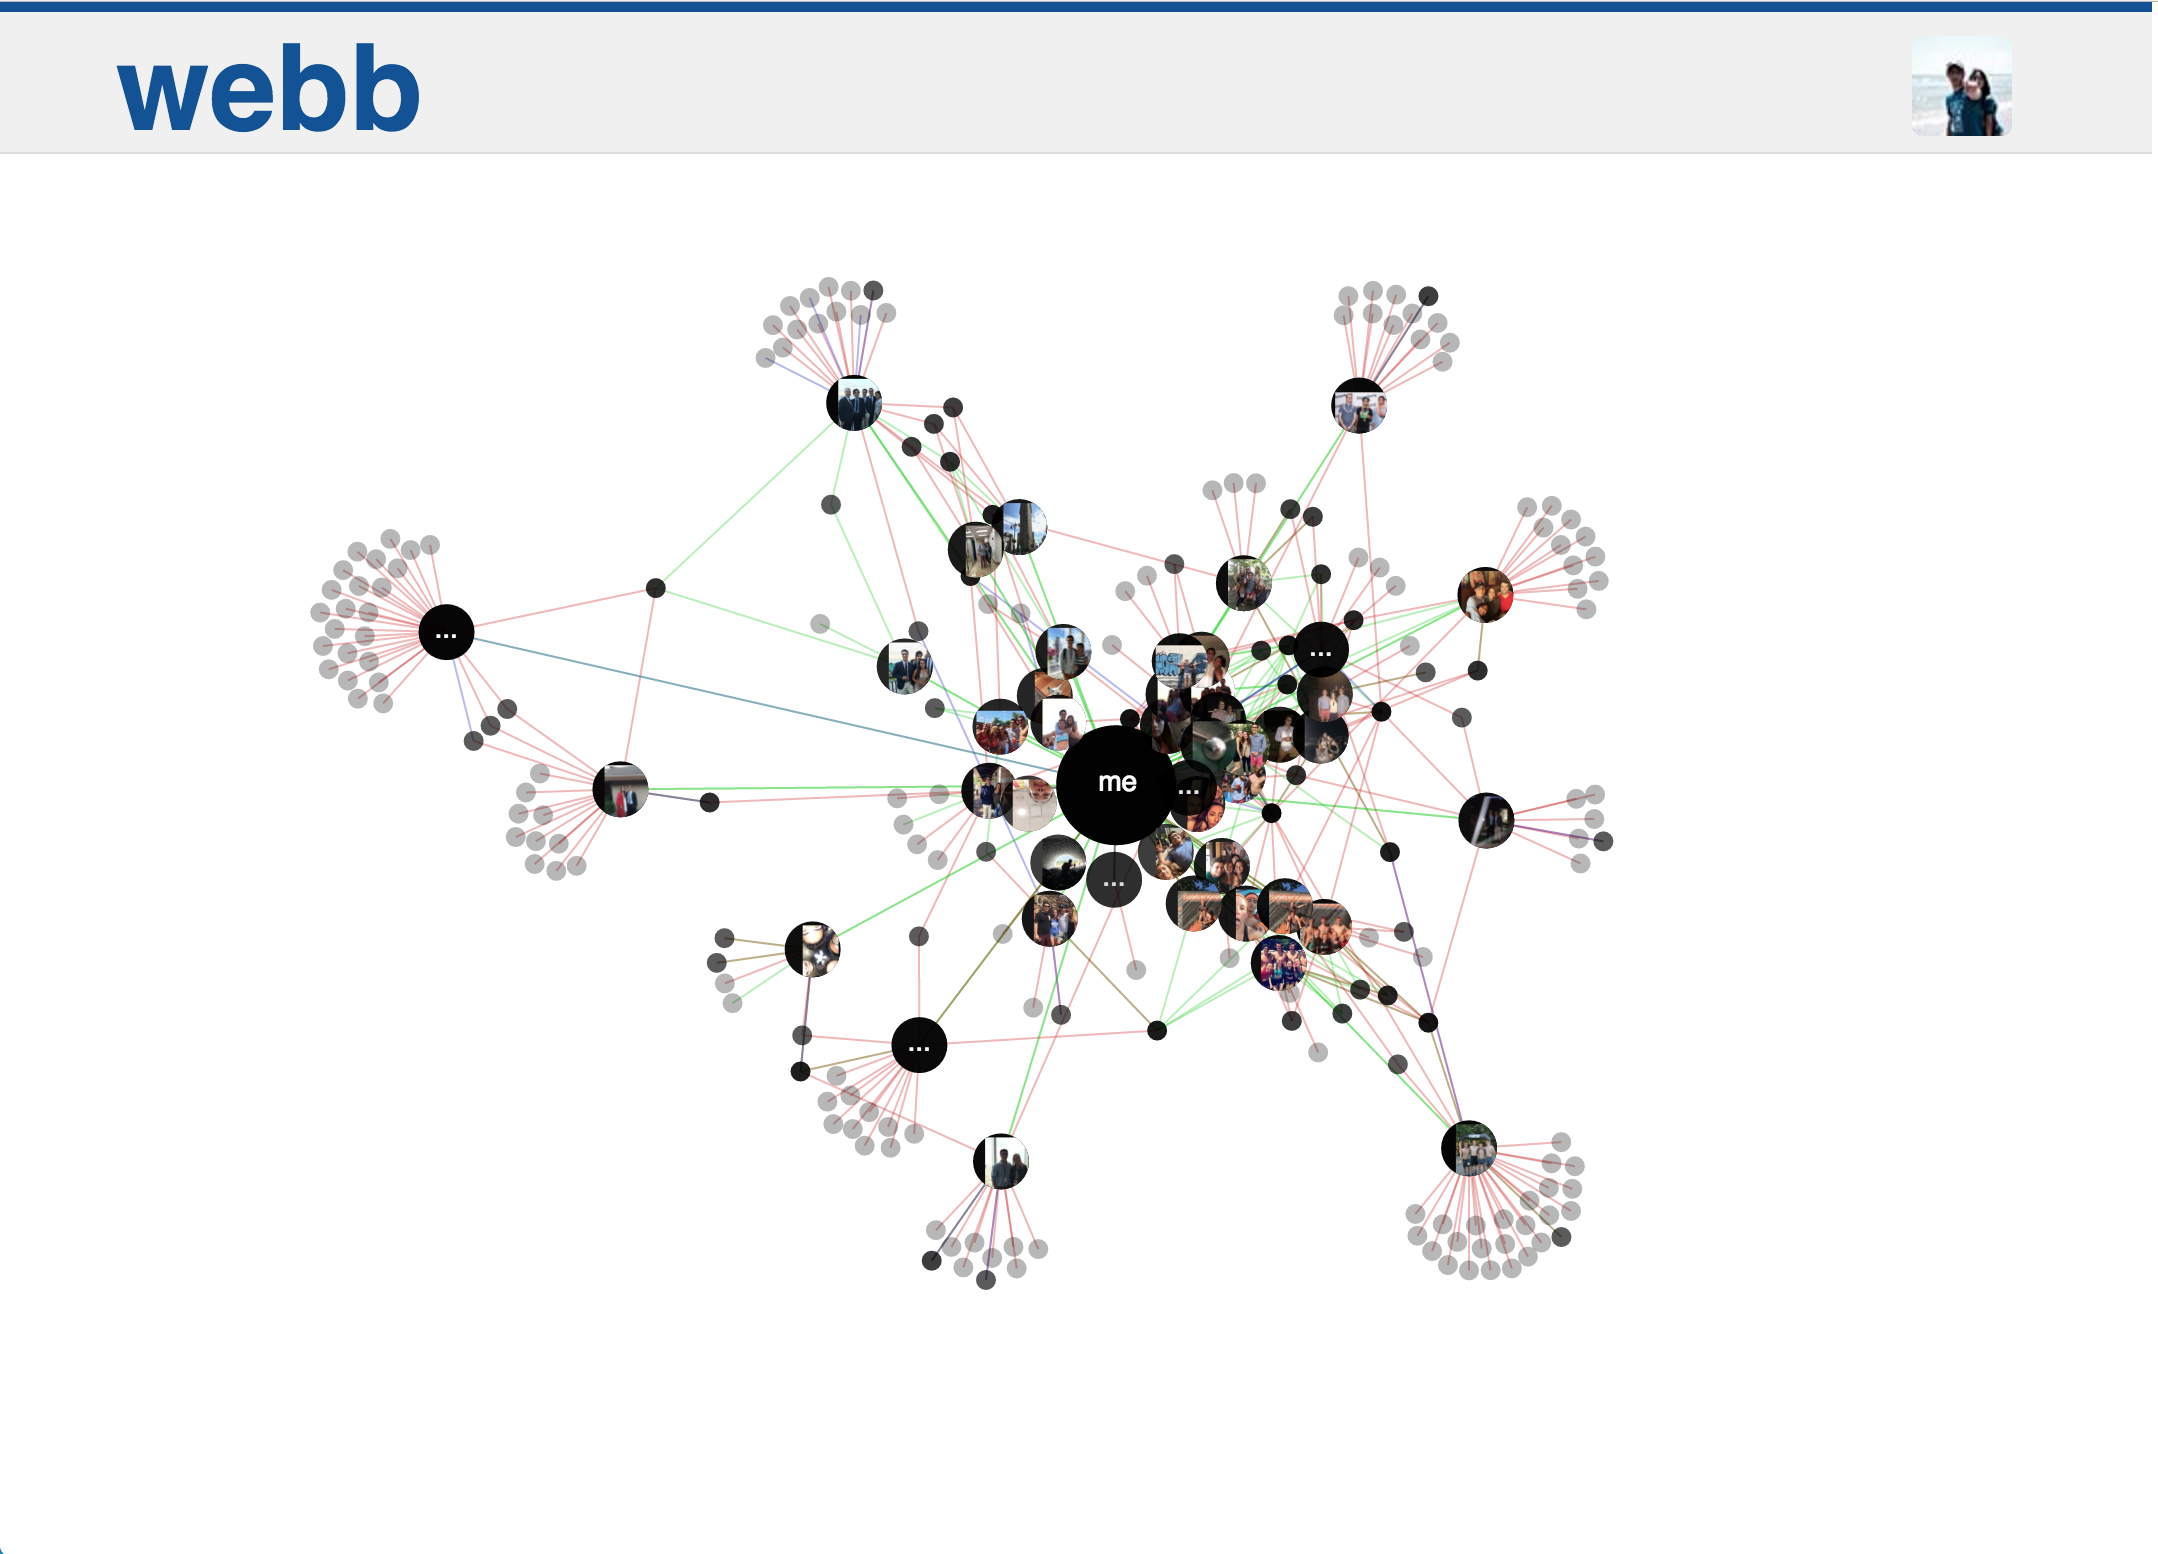
After using d3 for a summer position, I stumbled upon a force-driven graph of nodes and edges that moved as you dragged a vertex and adjusted accordingly - I seriously wondered what sort of data could possibly be visualized this way after viewing another web-like visualization of data, I imagined the same type of graphical representation of a Facebook account.
What it does
Sign in with your Facebook account and Webb will load your recent pictures and posts, adding them as nodes connected to "me" on a force-driven graph. Users who engage with you posts (likes, comments, tags) are also added to the graph, connected to each respective piece of media with which they engaged. This gives a completely new view of your social interactions, and using the force-driven graph, you can tug on nodes and see which ones are most connected to you and your social web.
How we built it
Facebook API, node.js, and d3.js
Challenges we ran into
Facebook API permissions, converting raw Facebook data to a valid set of vertices and edges
Accomplishments that we're proud of
Creating a fluid and interestingly unique design
What we learned
Principles of d3.js and the Facebook API
What's next for Webb
More filtering options and better graphical visualizations of nodes
NOTE
The navigating to the heroku link (https://sheltered-reef-39168.herokuapp.com) currently only works for Facebook profiles added as testers for Webb - retrieving some permissions requires approval that we didn't have time for during HackMIT, but are applying to after.


Log in or sign up for Devpost to join the conversation.