-
increase in homicide rates between 2014 and 2015
-- title: "Increasing Murder Counts in Cities Between 2014-2015" author: "Syeda Zainab Aqdas & Yi Wang"
date: "February 15th, 2017"
knitr::opts_chunk$set(echo = TRUE)
library(dplyr)
library(ggplot2)
library(oilabs)
data(murder_2015_final,package="fivethirtyeight")
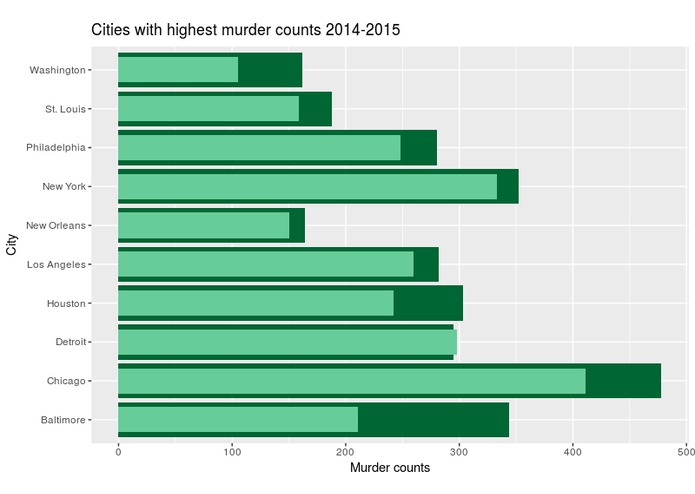
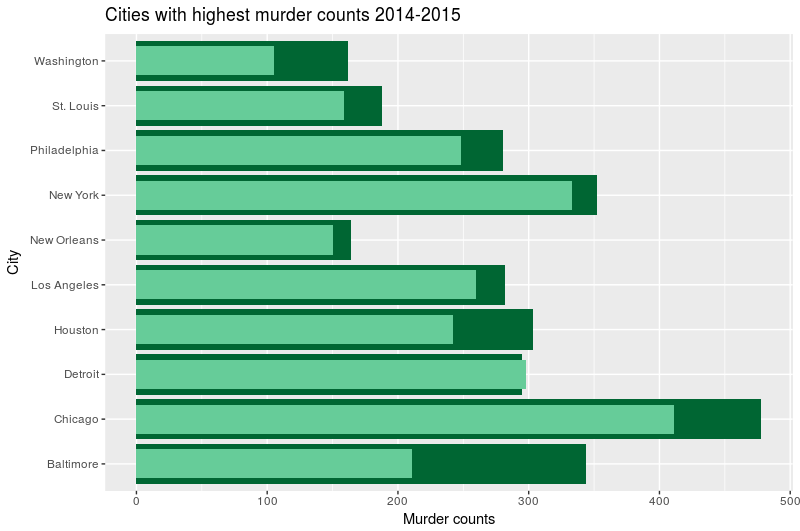
Our visualization is looking at the increase in homicide rates between 2014 and 2015. Our focus is on the 10 cities where the murder count was the highest in 2015. The dataset we acquired was from the fivethirtyeight package in R and contains 2014 and 2015 murder counts for 83 cities across the United States.
First we look at the cities with the highest murder counts in 2015 and store them into a subset called "top10". We then create a bullet graph to depict counts from both years on the same plot with the same axes.
top10 <- dplyr::top_n(murder_2015_final,10,murders_2015)
ggplot(top10,aes(x=city,y=murders_2015))+
  #change defalut position to identity
  geom_bar(stat="identity",fill="#006633")+
  #add another geom layer and adjust width
  geom_bar(stat="identity",aes(x=city,y=murders_2014),fill="#66CC99",width=0.65)+
  #swap the axes
  coord_flip()+
  labs(y = "Murder counts",x="City")+
  ggtitle("Increasing Murder Counts in Cities Between 2014-2015") +
  # legend
  geom_rect(fill="#66CC99", xmin = 9.5, xmax = 10, ymin = 395, ymax = 420) +
  geom_text(label = "2014 count", size = 3, x = 9.7, y = 462) +
  geom_rect(fill="#006633", xmin = 8.5, xmax = 9, ymin = 395, ymax = 420) +
  geom_text(label = "2015 count", size = 3, x = 8.7, y = 462)
Caption: Increase in murder counts between 2014 and 2015 in ten cities
The visualization is a bullet bar graph with the 2014 counts represented by the lighter shade of green and the 2015 counts represented by the darker shade of green. We decided to use a bullet plot because it depicts the change in these counts by plotting them on the same graph with the same axes. From the 10 cities we are looking at, Baltimore has the greatest absolute increase in homicides followed by Chicago. Detroit is the only city where the murder count went down. The overall trend is that murder counts increased in the ten cities where this problem is the worst.

Log in or sign up for Devpost to join the conversation.