-
Your study journey, visualized.
-
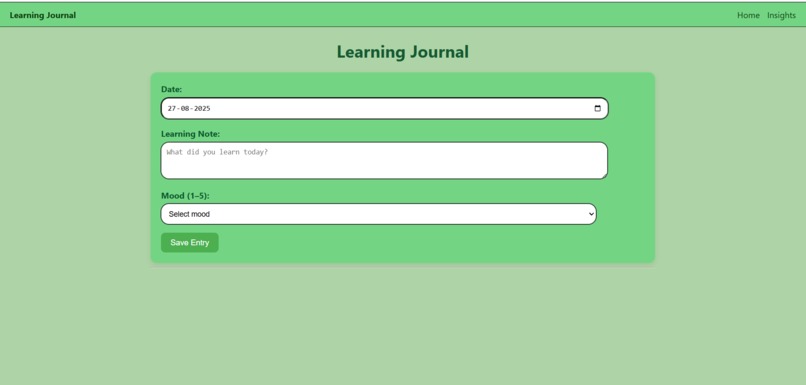
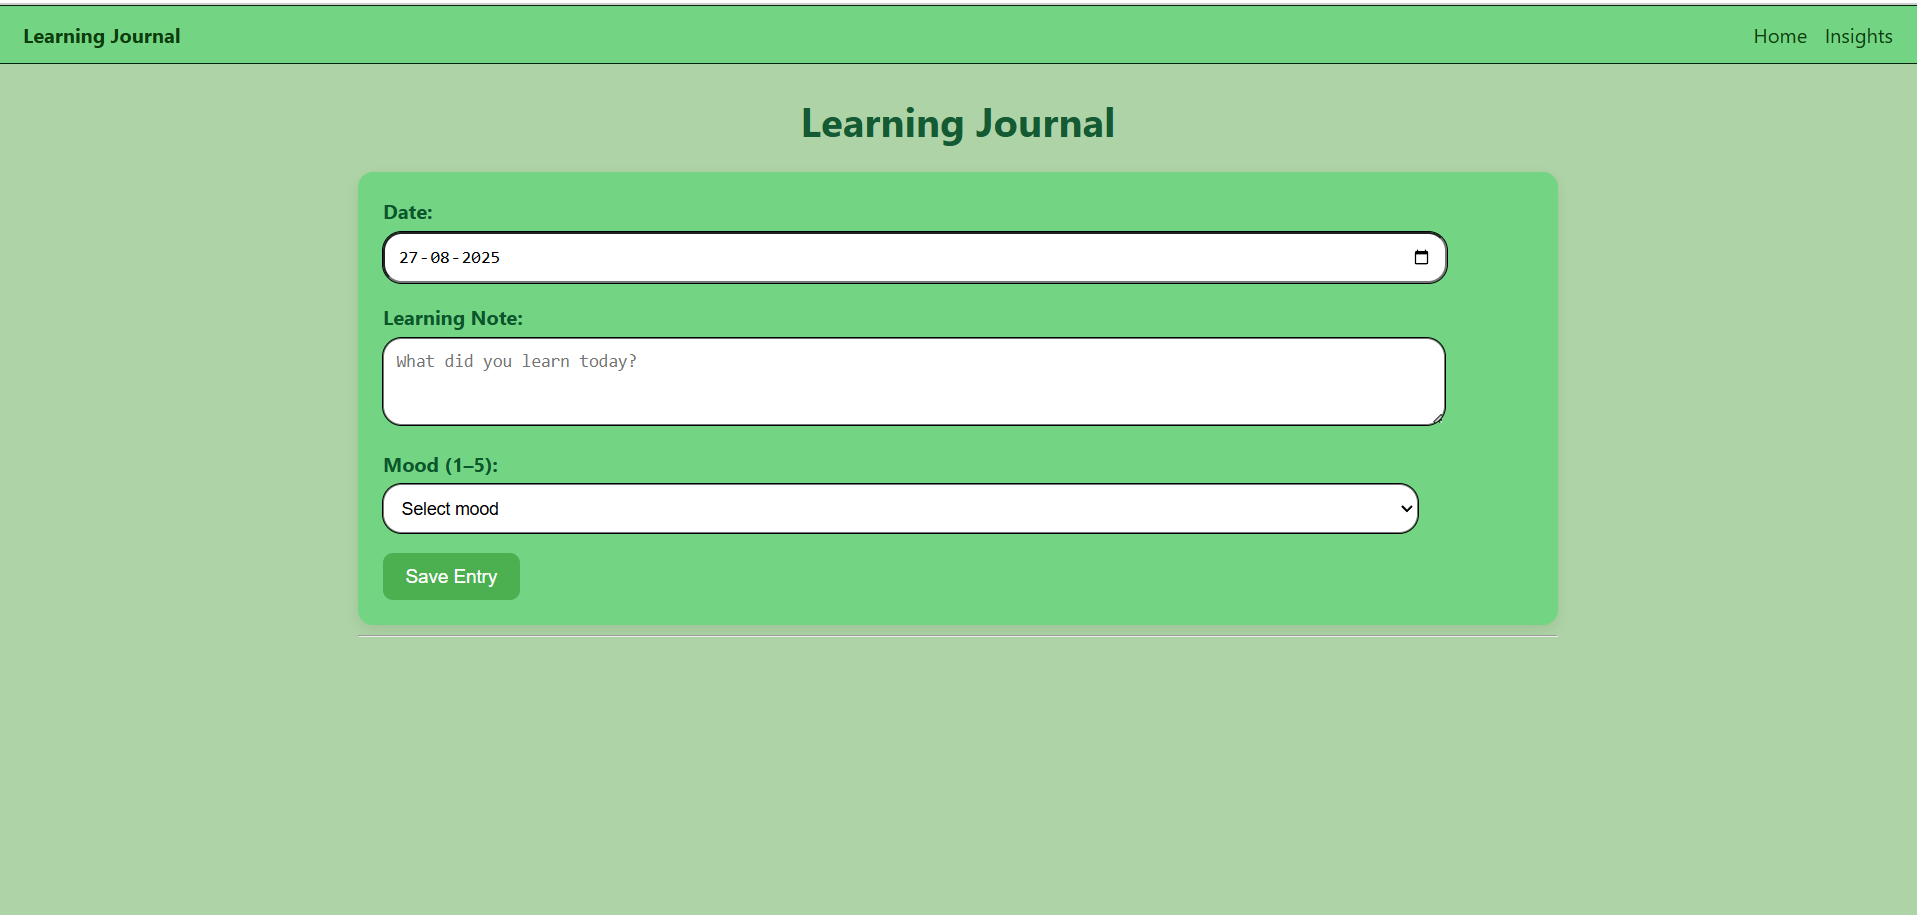
Log your study, track your mood.
-
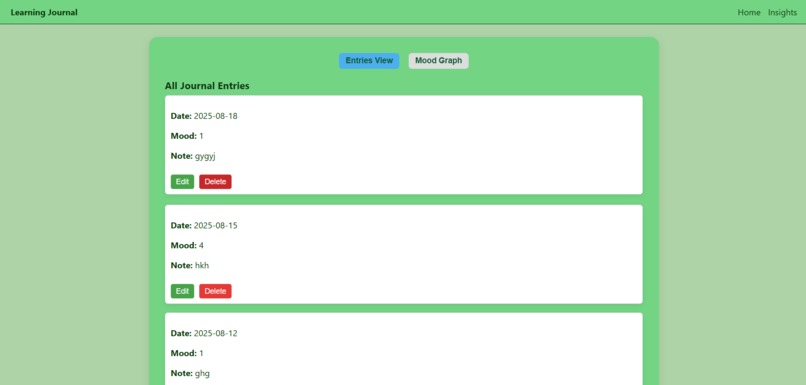
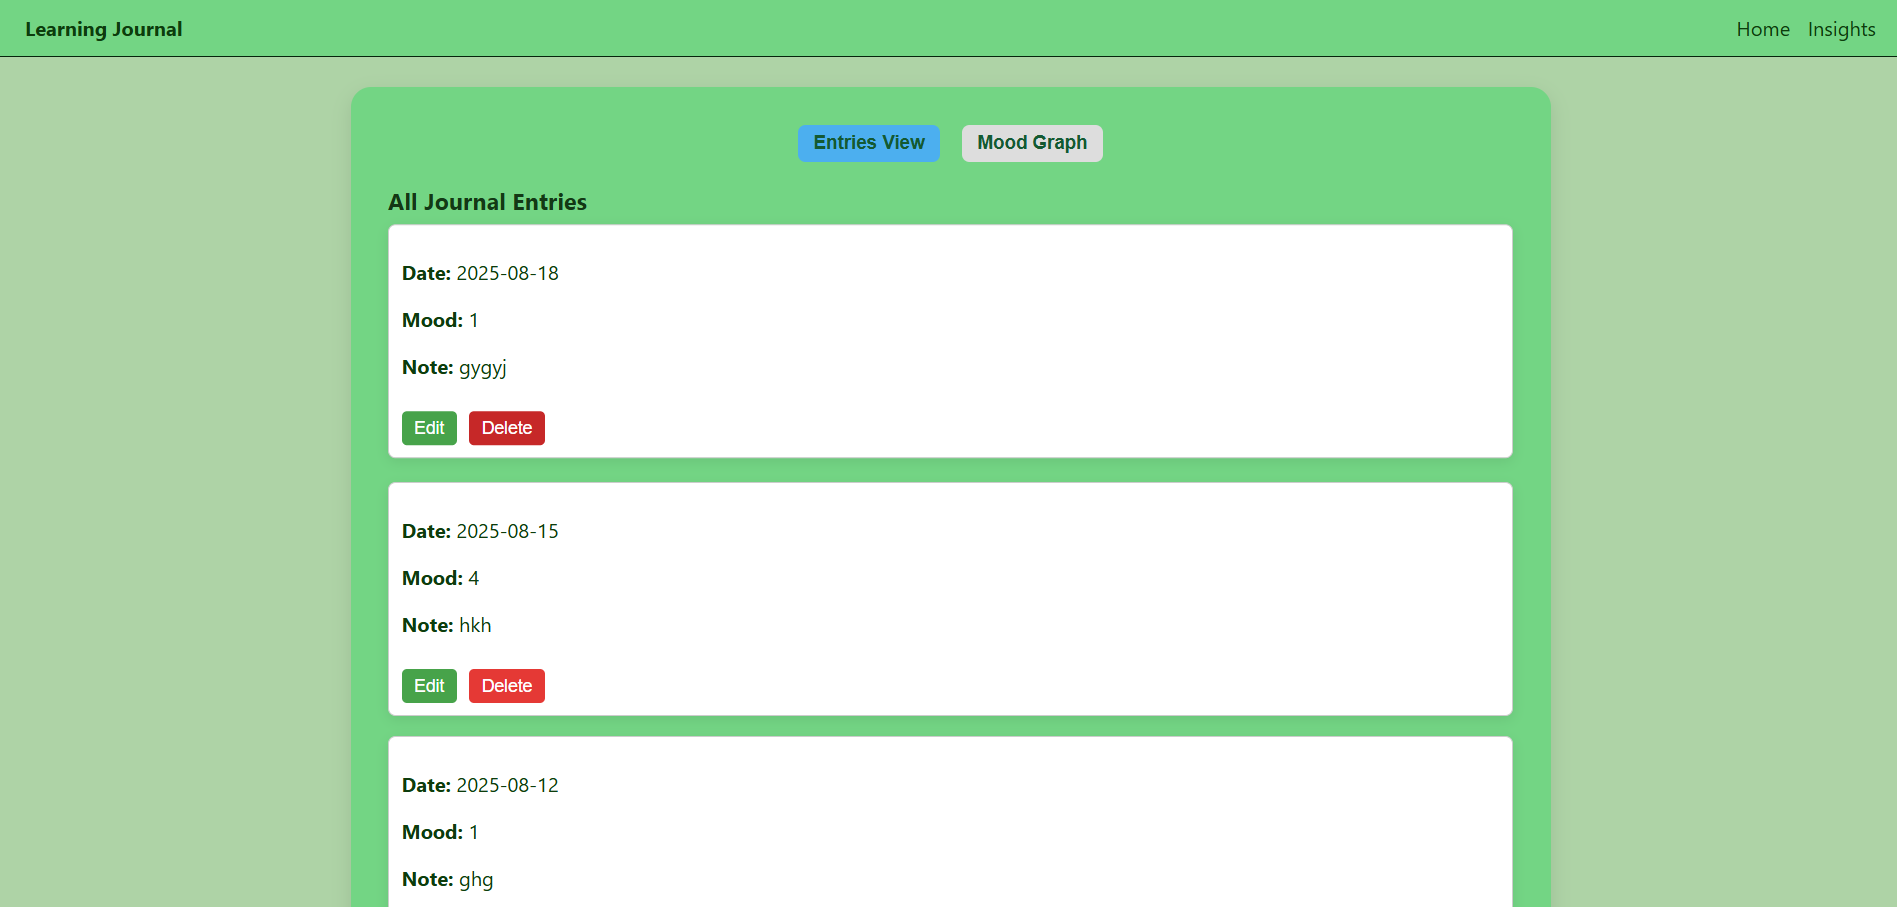
Mood and notes, all in one view.
Inspiration
While there are many tools for tracking tasks, notes, or habits, I wanted a simple way to log what I studied each day and how I felt about it, with visual insights to track progress over time. That’s how Learning-Journal was born — a personal tool for reflection and growth.
What it does
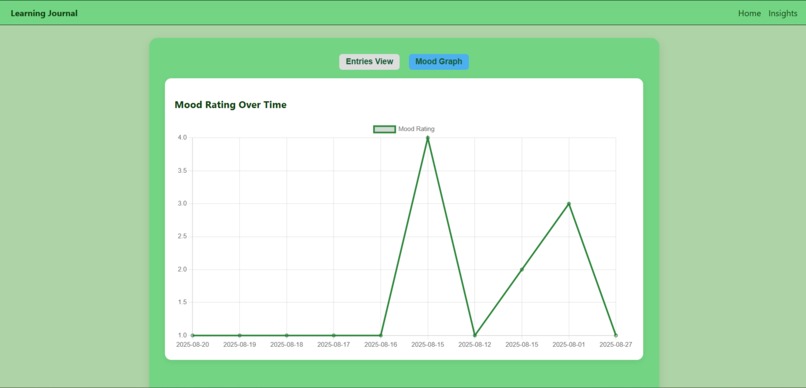
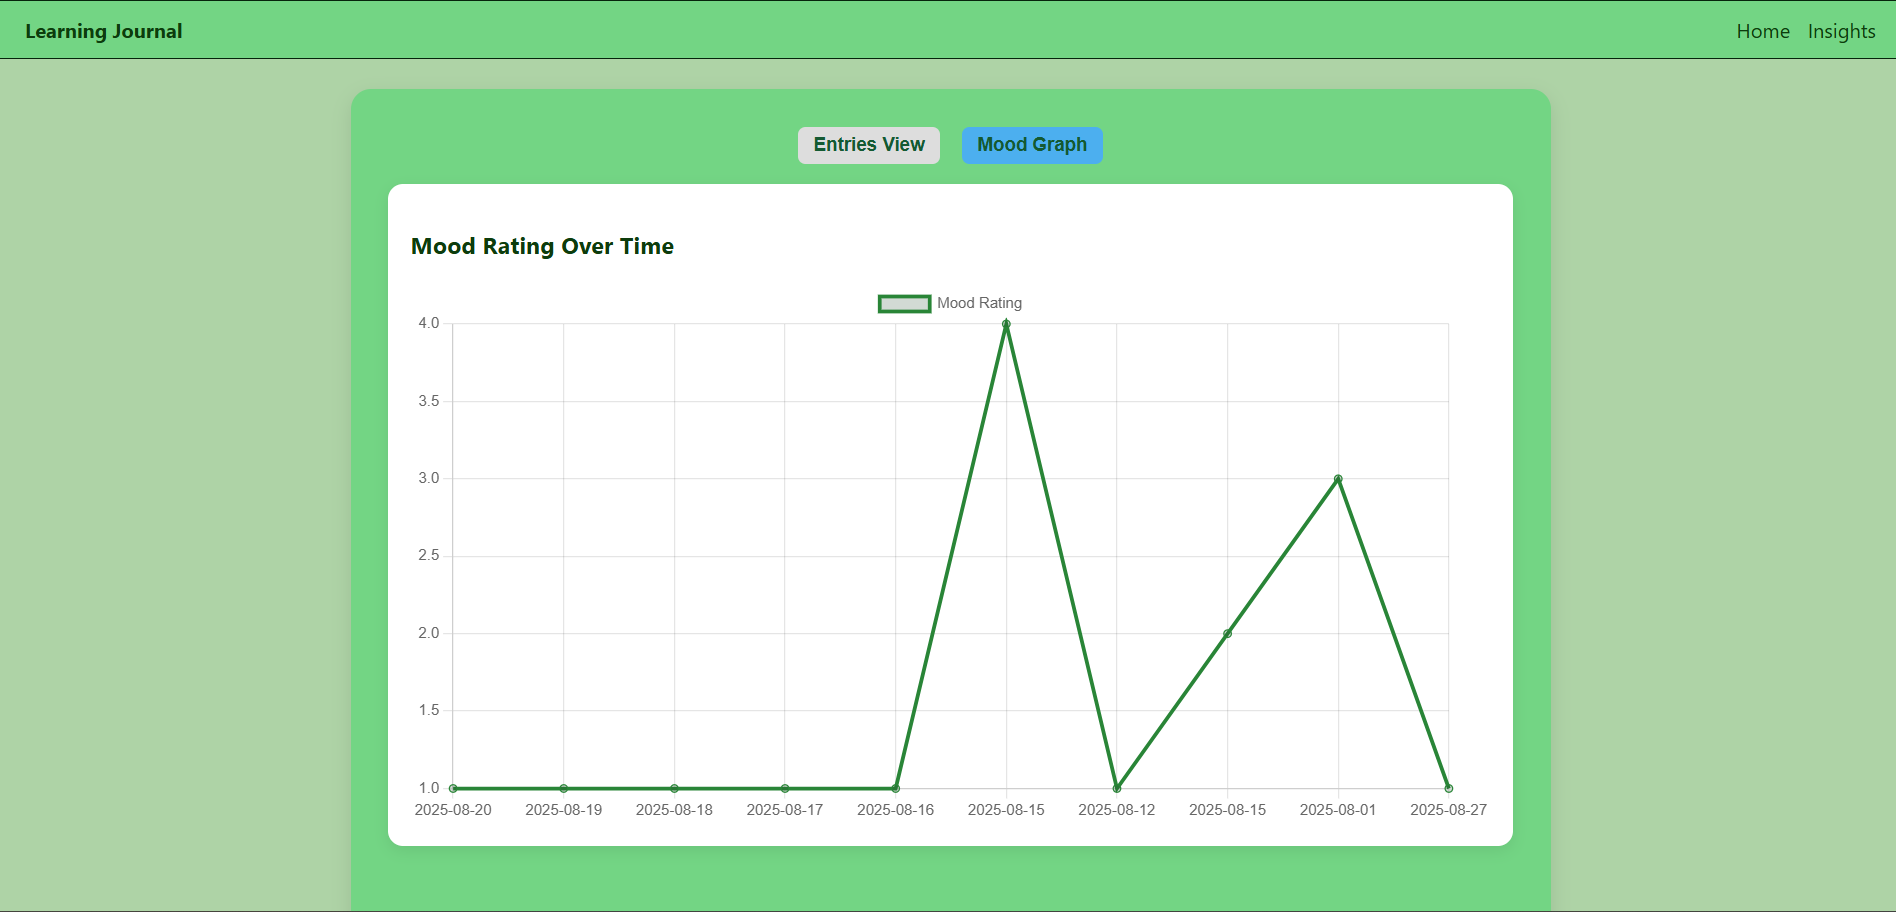
Learning-Journal allows me to log my daily learning with three key inputs: date, notes, and mood. Mood is captured using emojis (😞, 😐, 🙂, 😃, 🤩) to reflect how productive or enjoyable each study session was. On the Insights page, I can visualize trends through graphs. If a mood is recorded consistently for 5 days or more, helpful notes are displayed to provide reflection.
How we built it
I built the project using HTML, CSS, JavaScript, React, and Vite. For visualizing mood trends, I integrated Chart.js to create dynamic, interactive graphs.
Challenges we ran into
The biggest challenge was storing entries reliably. Initially, when refreshing the page, entries would disappear. I had to manage state and persistence carefully to ensure that all data remained intact.
Accomplishments that we're proud of
I’m proud of implementing Chart.js for the first time and seeing my mood trends visually represented. It made the project feel interactive and meaningful.
What we learned
I learned how to manage state in React and dynamically render data in charts. I also gained experience in creating a simple system that connects user input (notes and mood) to actionable insights.
What's next for Learning-Journal
I plan to expand Learning-Journal by adding features like to-do tasks, reminders, and even more personalized insights based on learning patterns, turning it into a full-fledged learning companion.
Built With
- chartjs
- chrome
- css
- frontend
- html
- javascript
- react
- vite

Log in or sign up for Devpost to join the conversation.