-
-
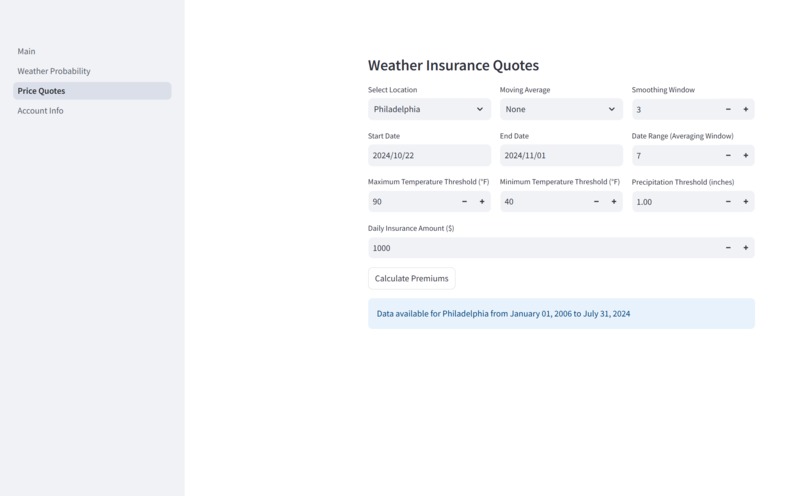
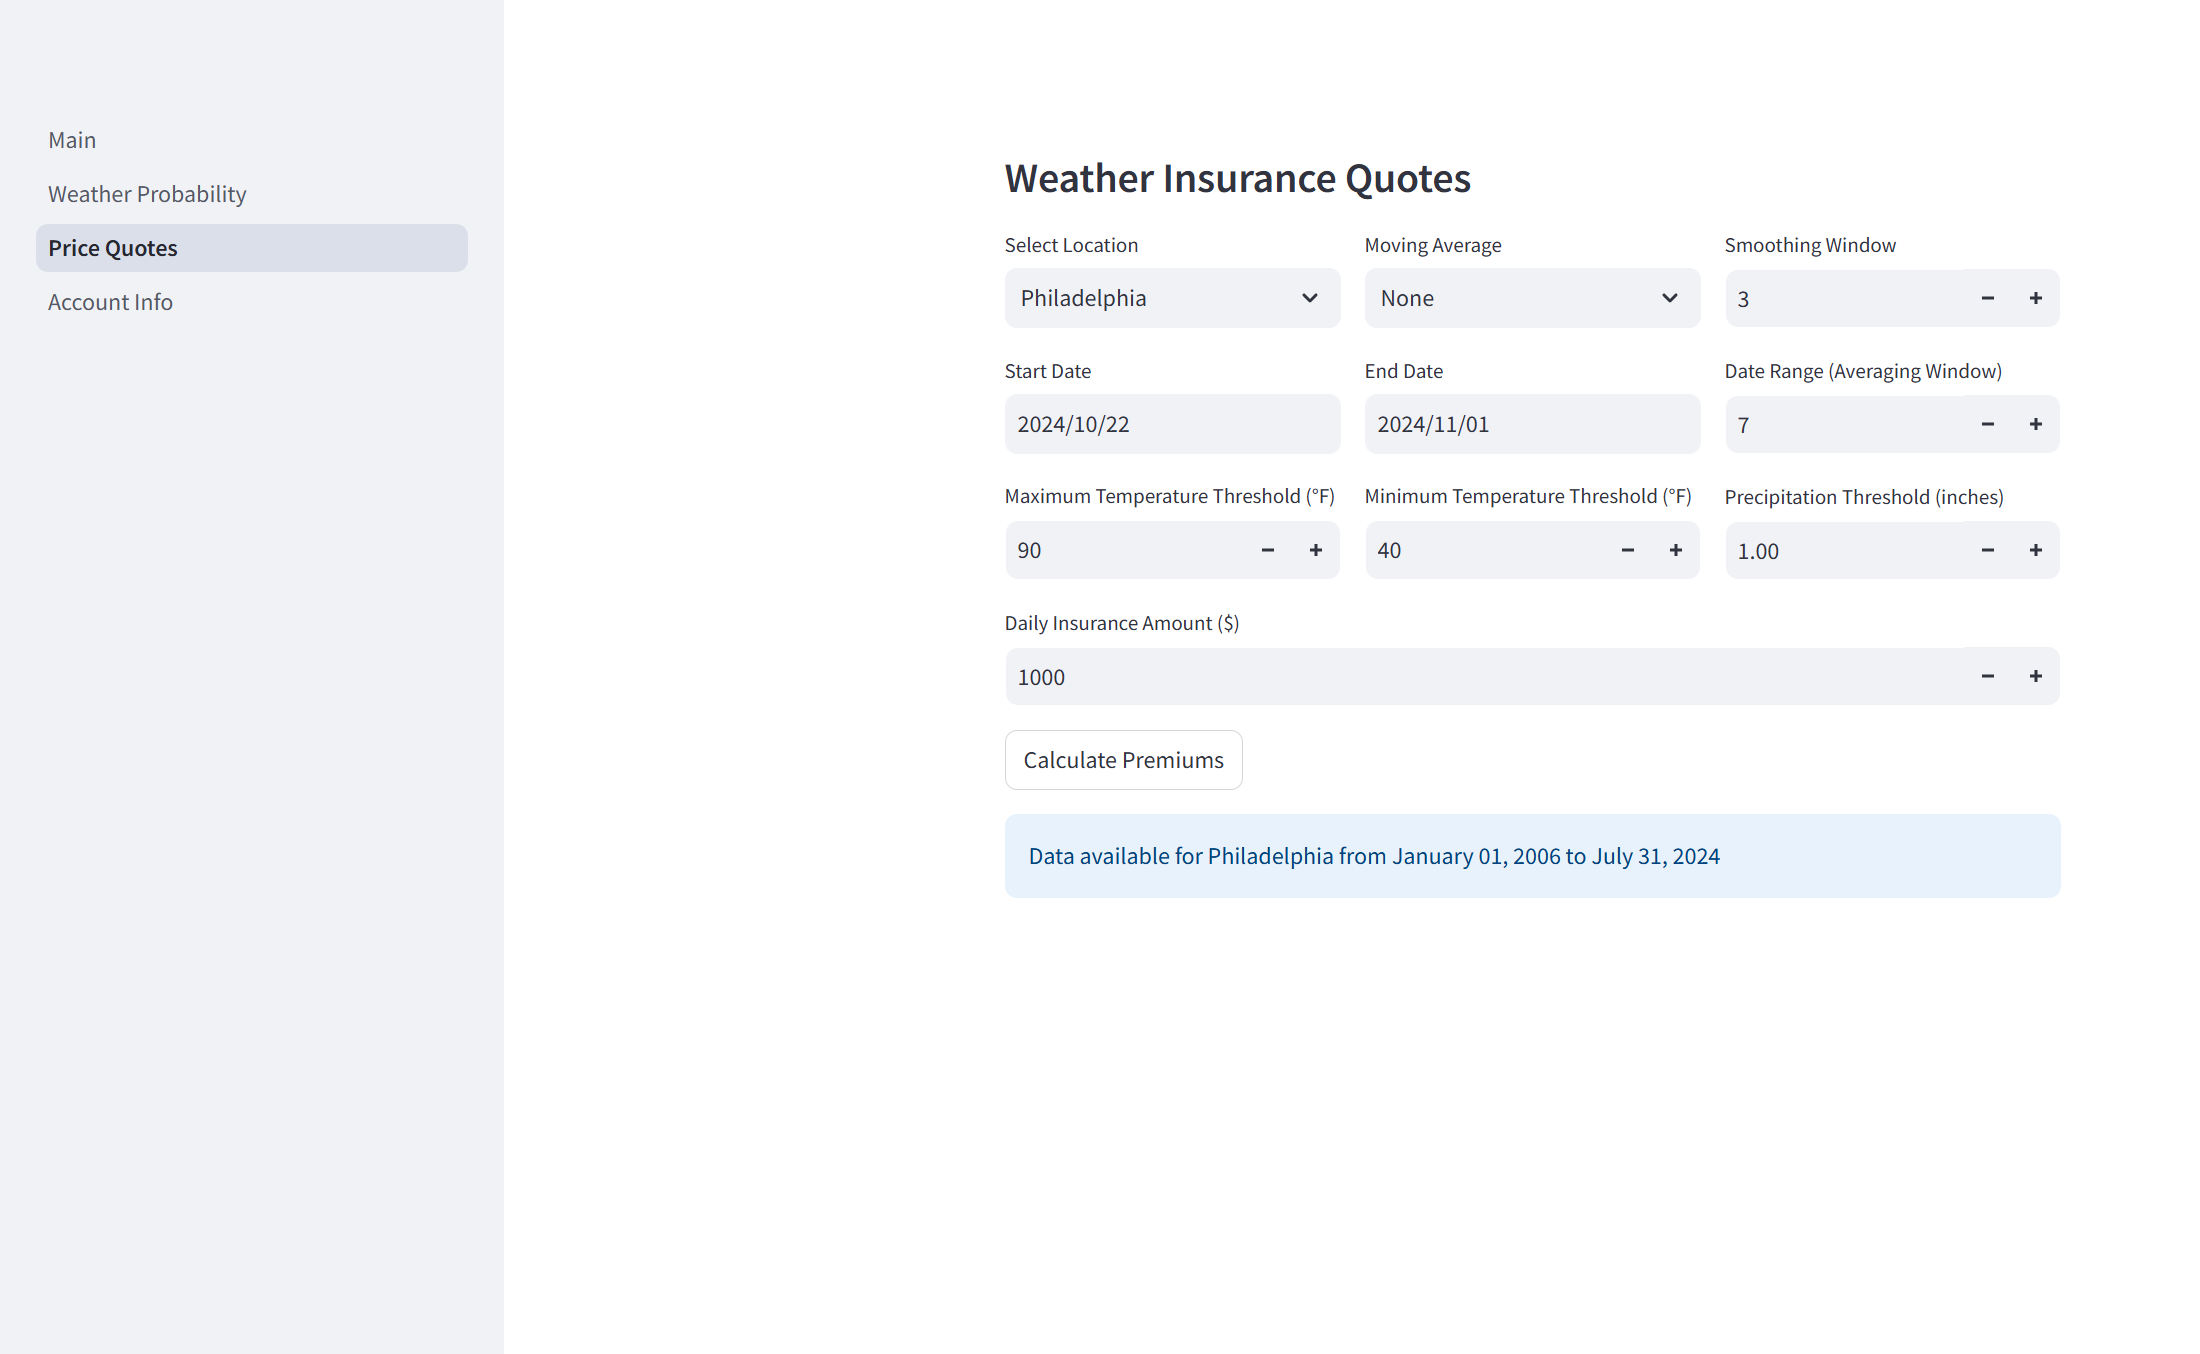
Weather Premium Calculator
-
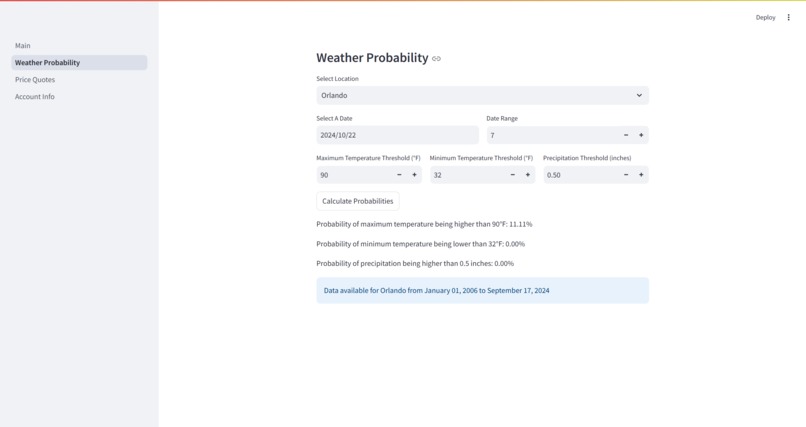
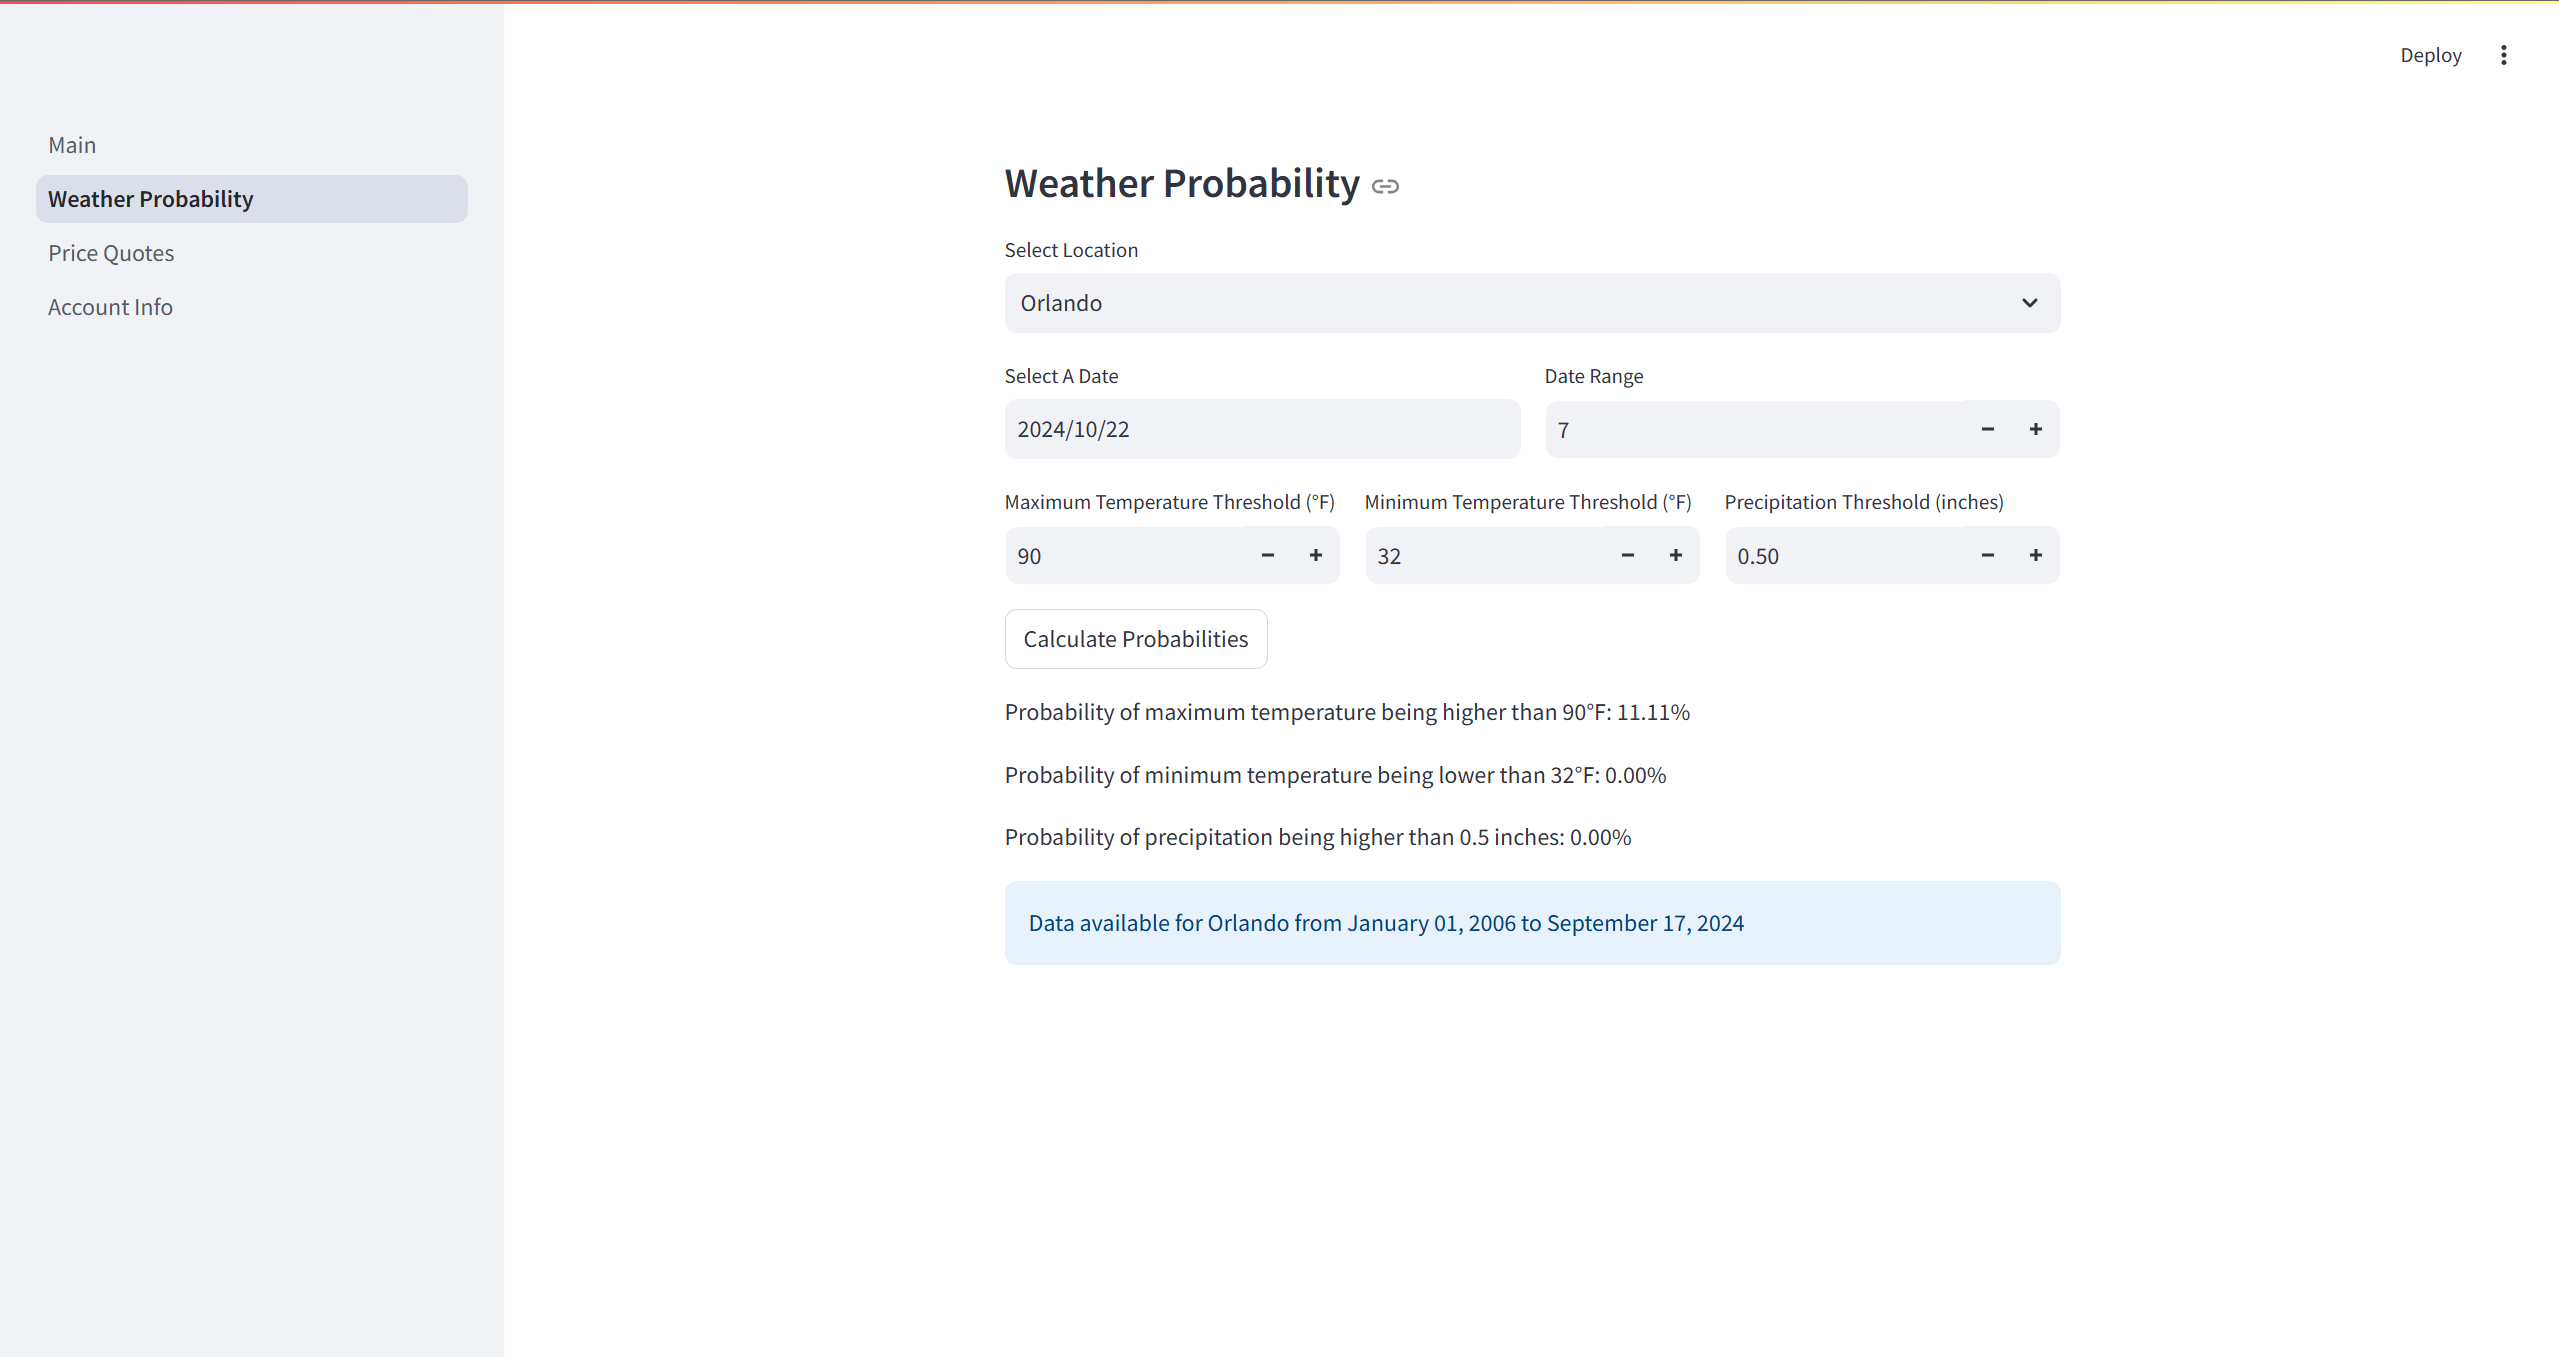
Weather Probability Calculator
-
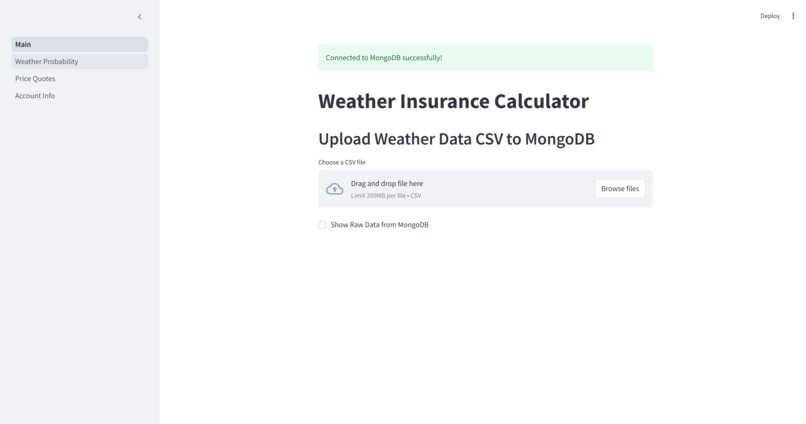
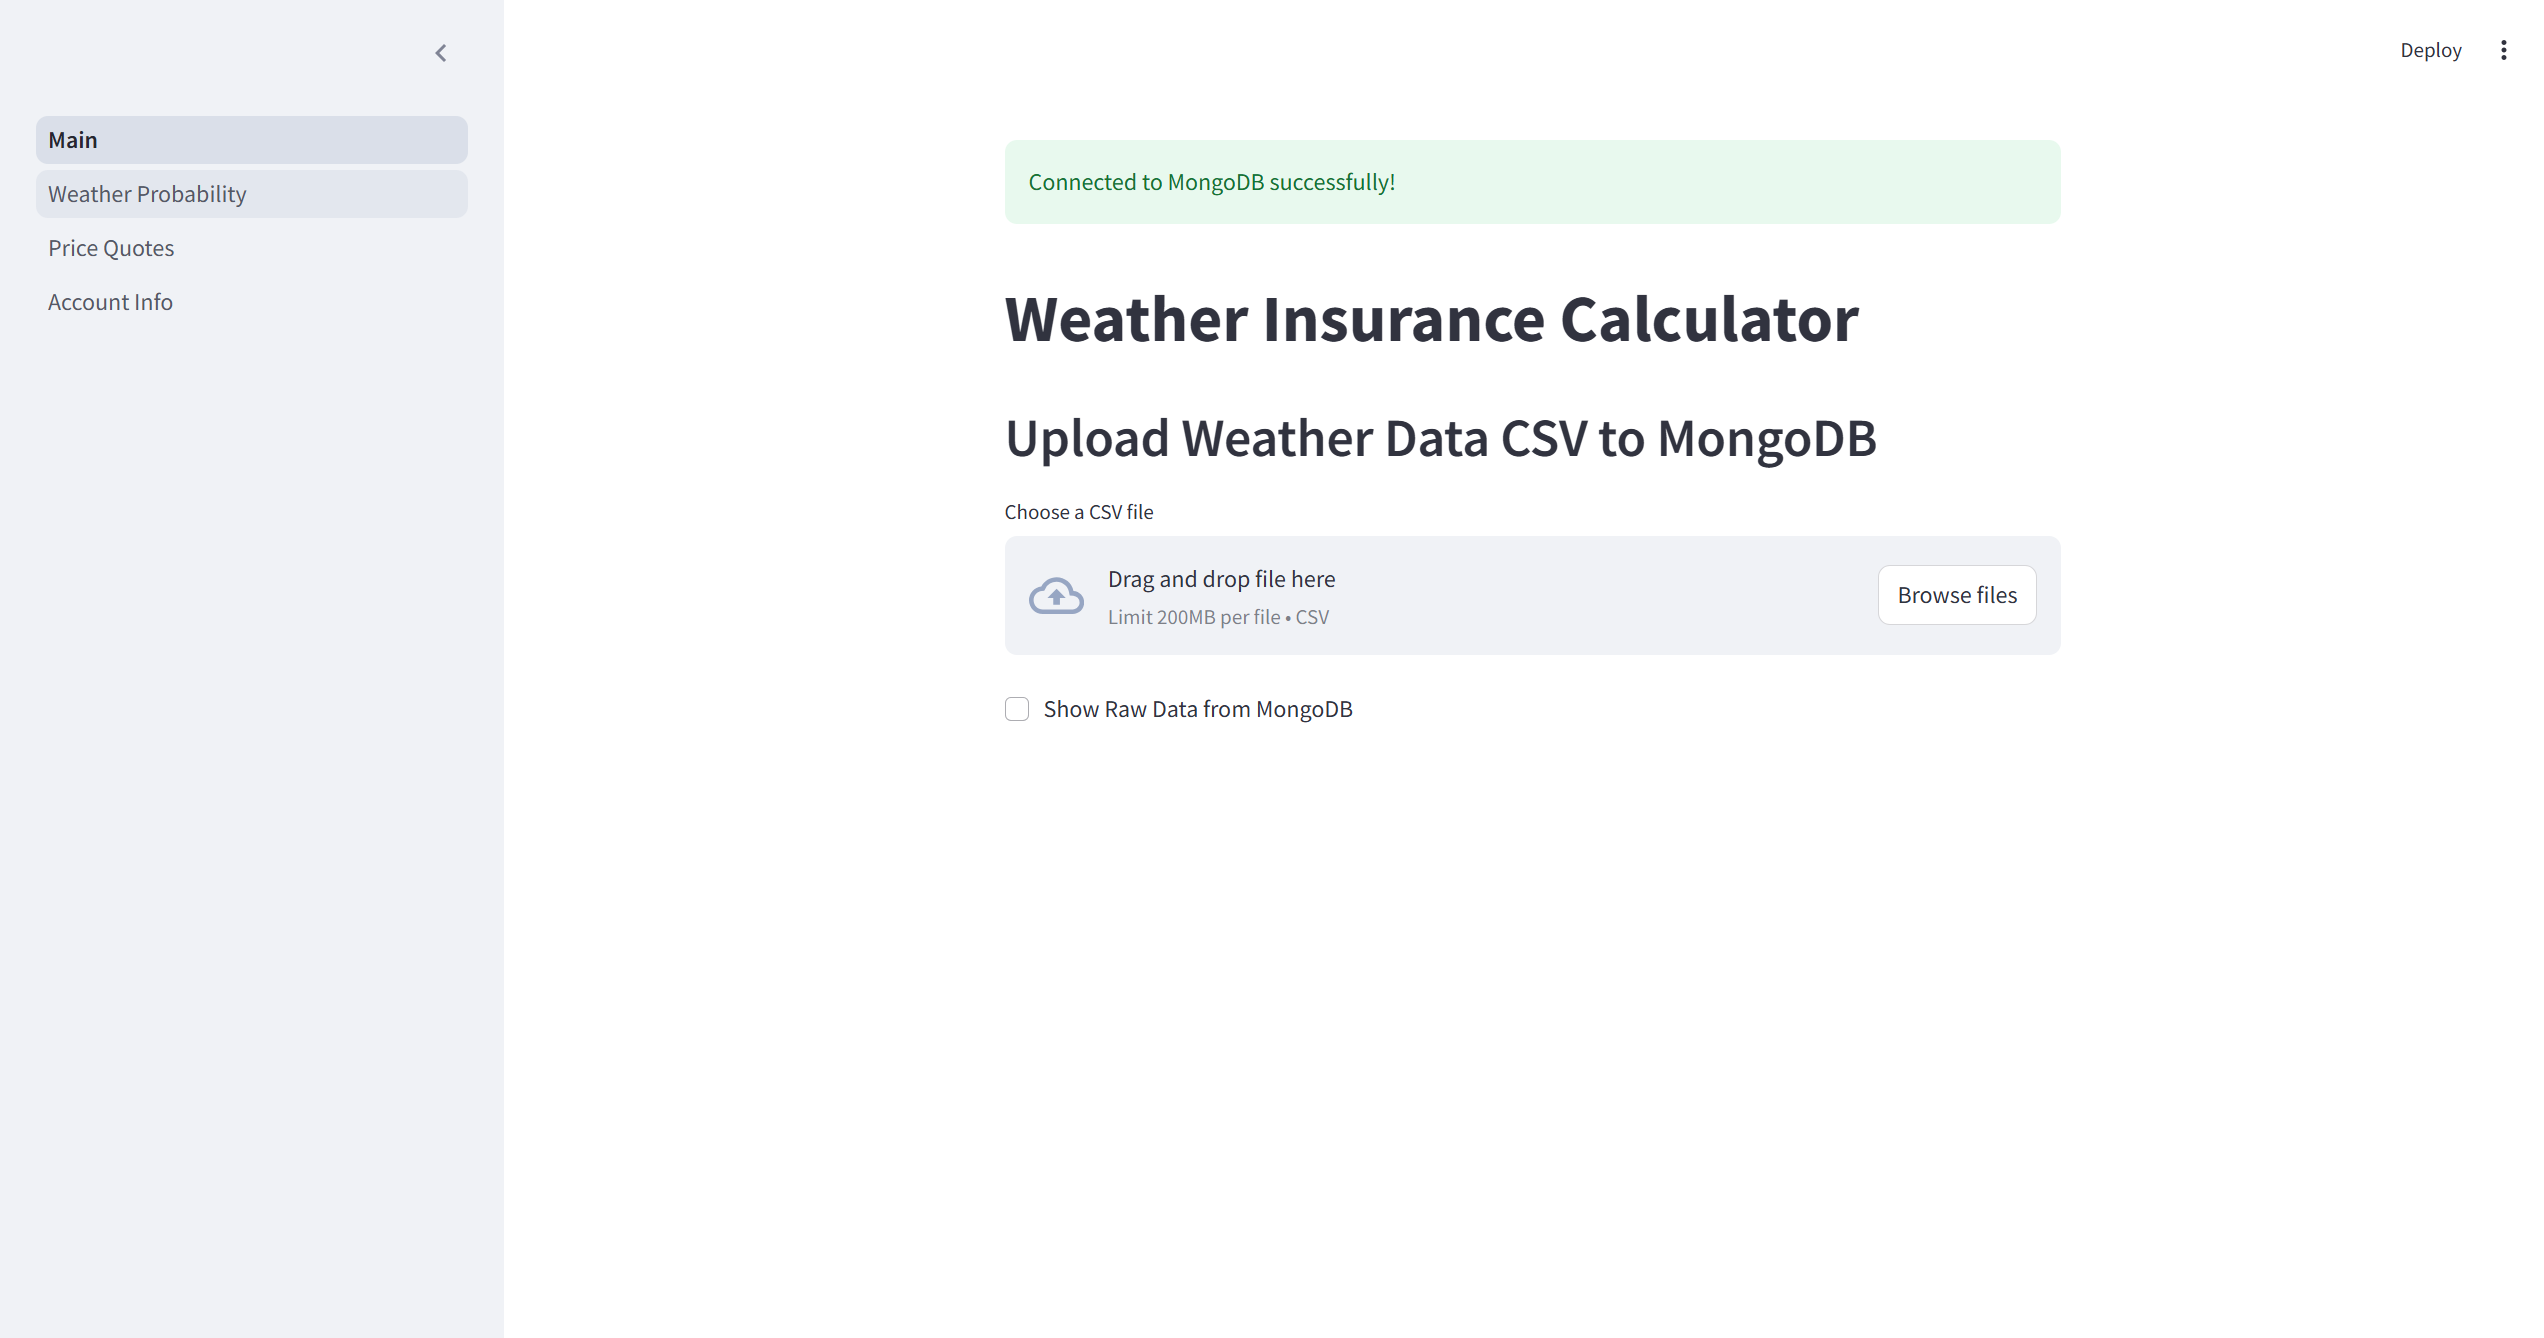
Main Page
Inspiration
We were inspired by our recent travel experience in Scandinavia, when bad weather conditions caused us to cancel some of our plans, which was often costly. Knowing a fair price for weather-related cancellation could benefit retail hotels, event vendors, and travelers alike.
What it does
A user (customer, hotel, etc...) can enter a location, date range, and insurance amount per day (hotel/cruise/event daily cost), and this calculator will calculate an insurance premium (price you charge/pay) based on the likelihood of a “bad” weather.
How we built it
We use Streamlit to do this as it provides both front-end and back-end capabilities, which is perfect for quick prototyping. We downloaded a sample 3-city, 18-years historical weather dataset from NOAA (https://www.ncdc.noaa.gov/cdo-web/).
We pooled days before and after (7 by default) for each day.
We also smoothed the historical weather time series data using pandas. This is especially beneficial for denoising data without considering an excessively large date range (like the former method), which can lose the significance of the particular date. Instead, we add an additional step of smoothing each yearly series of data. We can see that for ranges that are seasonally consistent, we see lower probabilities of bad weather, but for ranges that are seasonally inconsistent, we see higher probabilities of bad weather, illustrating its effectiveness on top of pooling. For instance, the probability of temperature falling in a 40-75 degree range in Philadelphia for October 21 decreases from 20.57% to 12.98% when a simple moving average is applied to it. However, for out-of-distribution ranges, such as 20-55 degrees, the probability increases from 88.76% to 93.70%.
This also adds more information to the model for a given outlier: if a day is twenty degrees colder than normal, both pooling and smoothing would moderate its effect on the prediction for the correct day, but with smoothing, its effect on the model is not binary based on if it is above or below the threshold as to count into the historical percentages.
We used mongodb Atlas to store the tabular data, and the Capital One "nessieisreal" API to simulate payments.
Challenges we ran into
Using different formats to store or represent data (CSV, Pandas dataframe, MongoDB collection)
Dataset we used is only 18 years, so we had small sample sizes
Accomplishments that we're proud of
Using a combination of pooling neighboring days together for estimation and smoothing the weather time-series data with moving age to reduce noise and effects of outliers
Integrating the CapitalOne API
What we learned
How to use CapitolOne's Nessie API
How to convert Pandas dataframe to a bson mongodb collection format, and the other way too.
What's next for WeatherPricer
- Populate more data, both in terms of the locations, as well as going back more years
- Allow users to enter any location, and we will look up its latitude and longitude, then triangulate and interpolate, to derive the historical weather for any place
- In addition to high/low temperature and precipitation, we can add more weather parameters such as wind speed, snowfall, etc
- Use React to GUI that calls the Python backend
- Open up the online API to be used by places such as hotel websites


Log in or sign up for Devpost to join the conversation.