-
-
Weatherly
-
Creating the data set
Inspiration
Segmenting weather forecasting as one of the favourite things of mine to watch , to view the animations , i always wondered how they used to collect the data and represent them in an animated way . Therefore , understanding the use case , i created a data set of all the weather forecasting and represented them with the most asked questions regarding weather forecasting
What it does
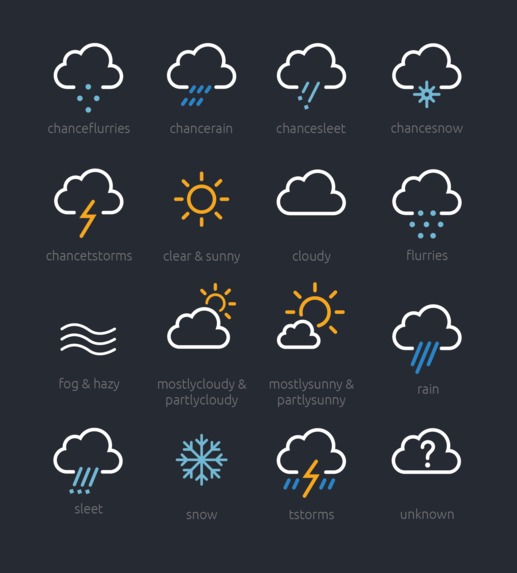
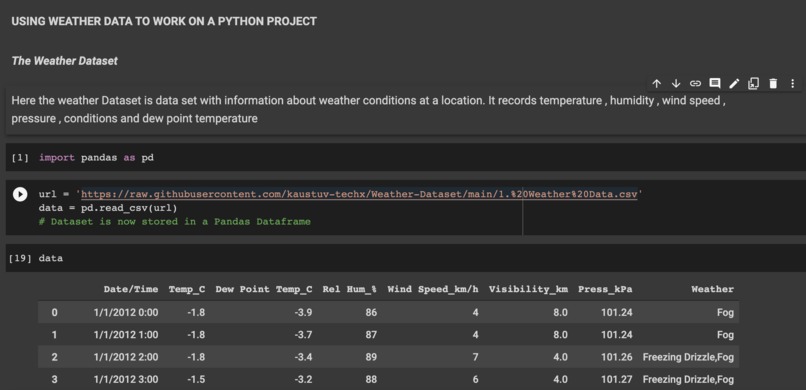
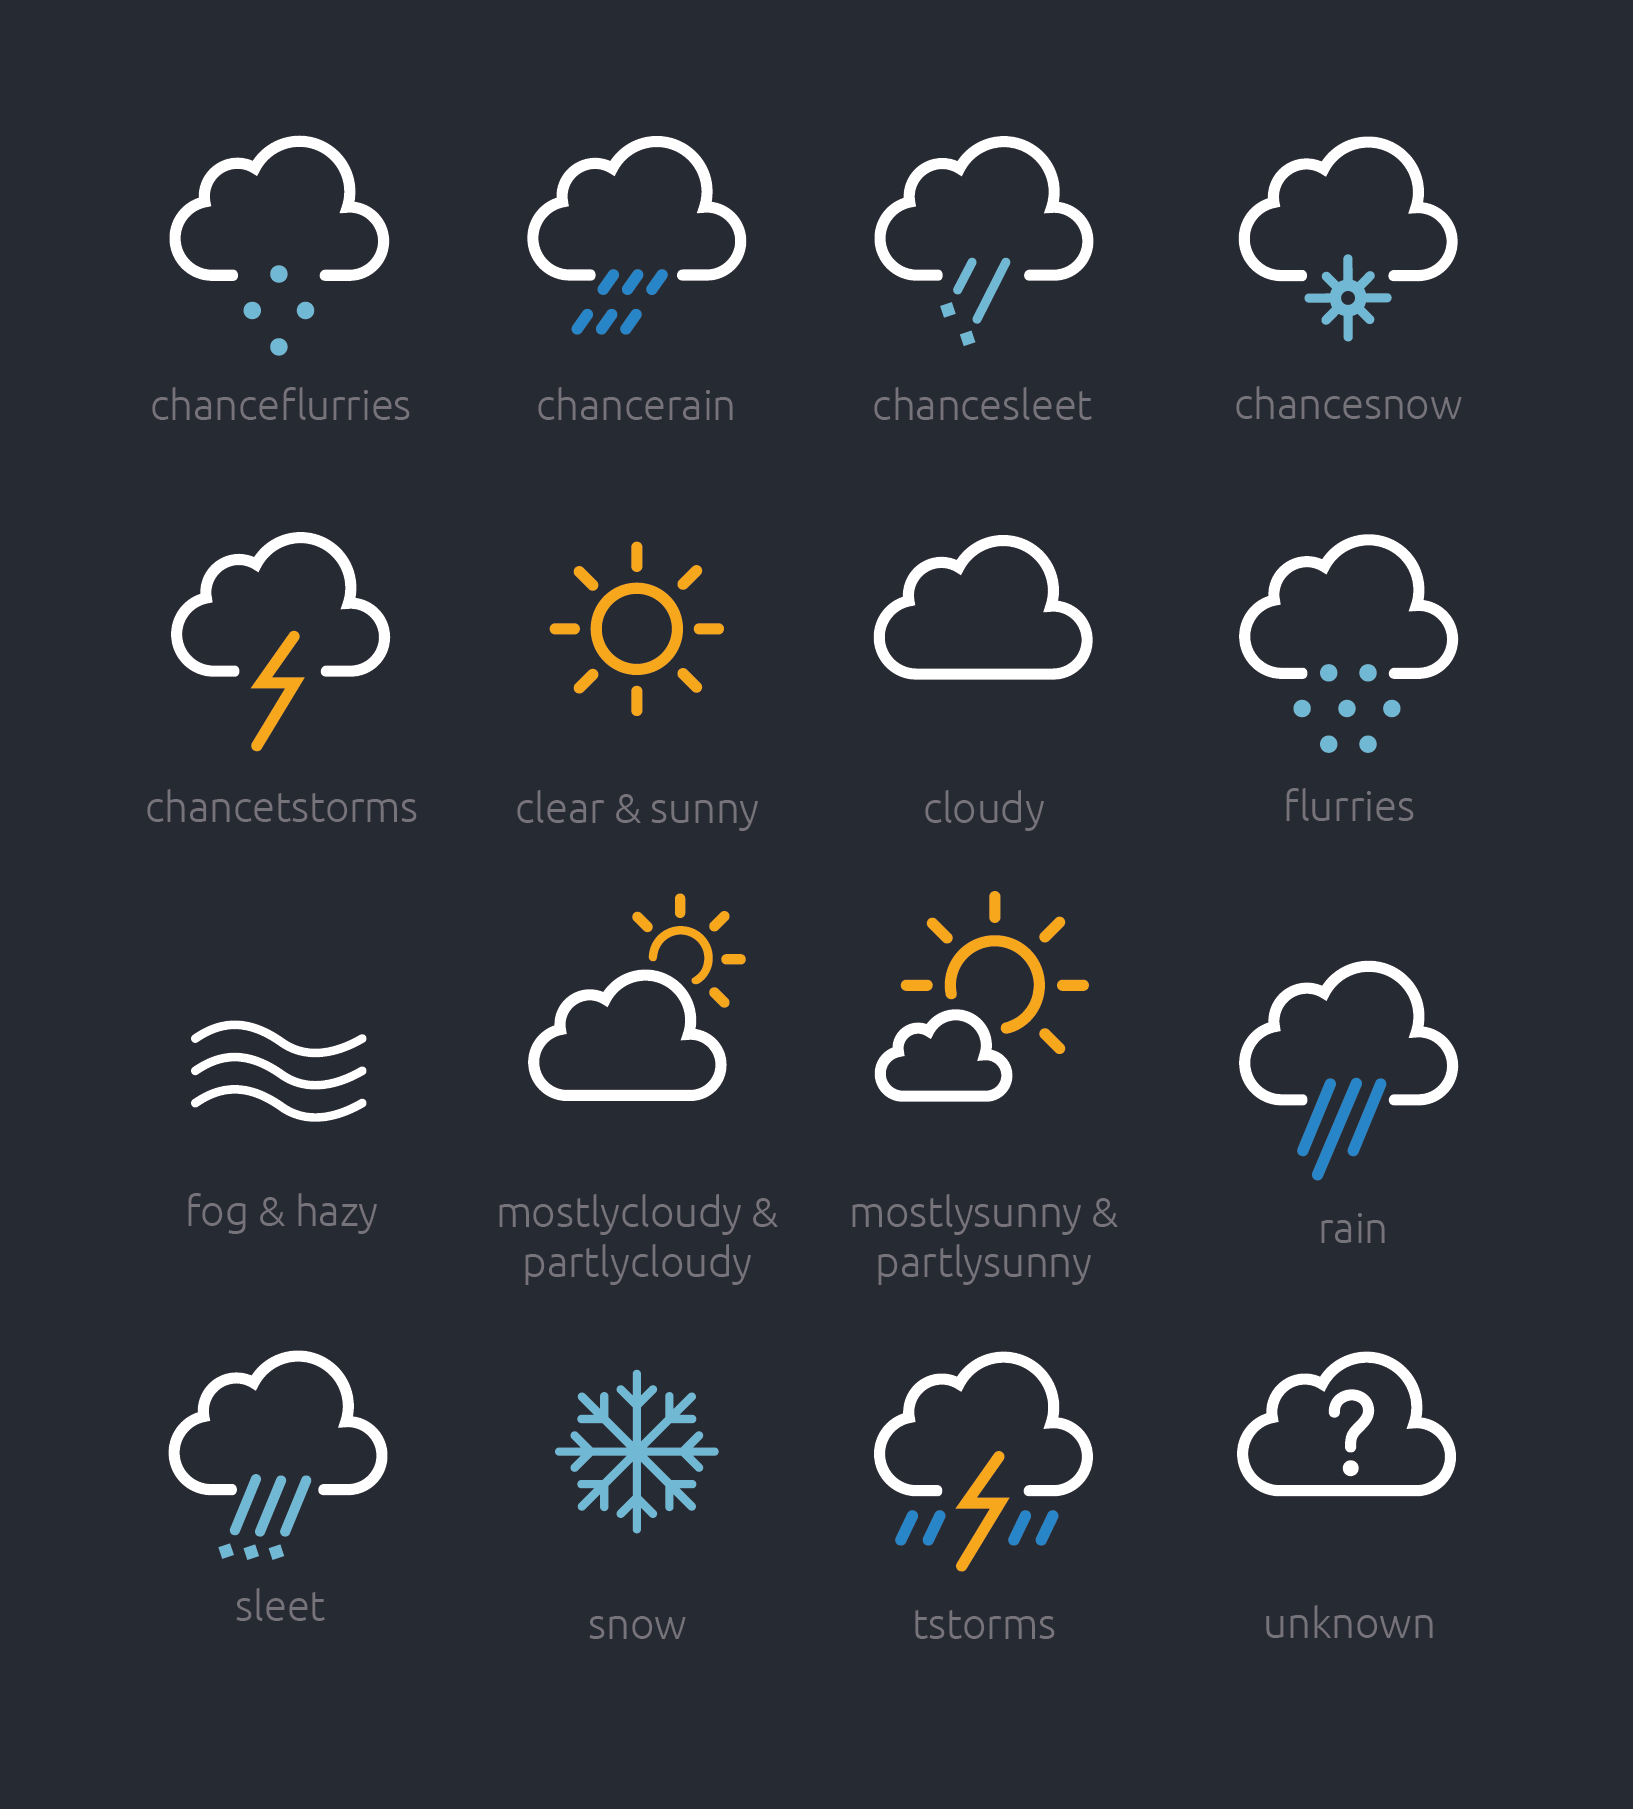
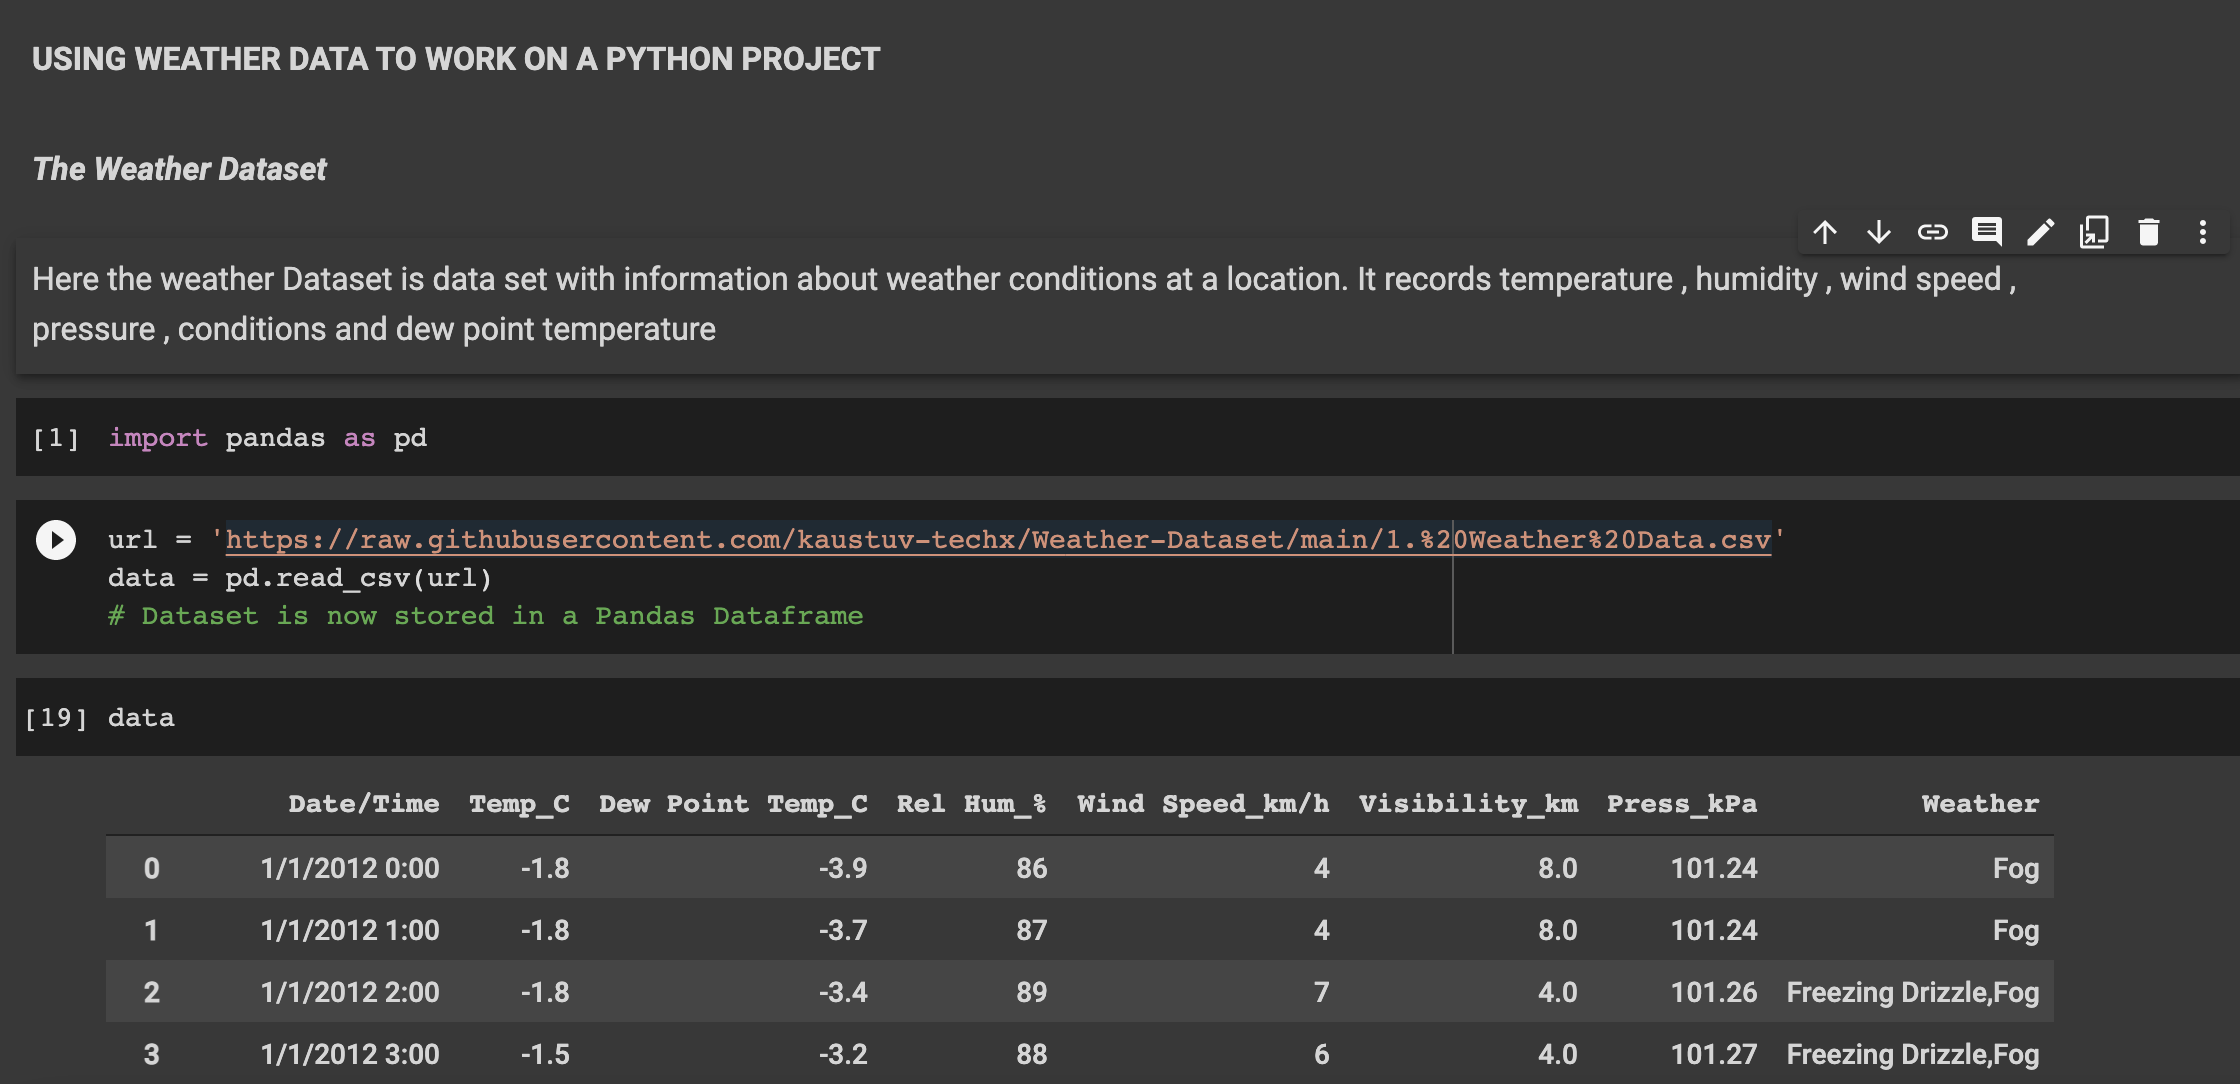
It records temperature , humidity , wind speed , pressure , conditions and dew point temperature
How we built it
Created it using google colab , by using python libraries , data analytics and big data.
Challenges we ran into
Faced difficulty while finding out subsequent values of different projections of the dataset
Accomplishments that we're proud of
Successfully created a data set and found out different use cases regarding the same , thus representing a data set in a multi var environment for the user to use or collect data
What we learned
Python libraries , data analysis , big data ,
What's next for Weatherly
Modifying the data set to create an advance structure and thus finding answers to more complicated FAQ's

Log in or sign up for Devpost to join the conversation.