Inspiration
Traders joke that sunny days make people optimistic and rainy days make them gloomy, and there’s some academic research on whether weather really affects stock markets. We wanted to test that for ourselves, in a way people can explore, instead of just repeating the claim.
What it does
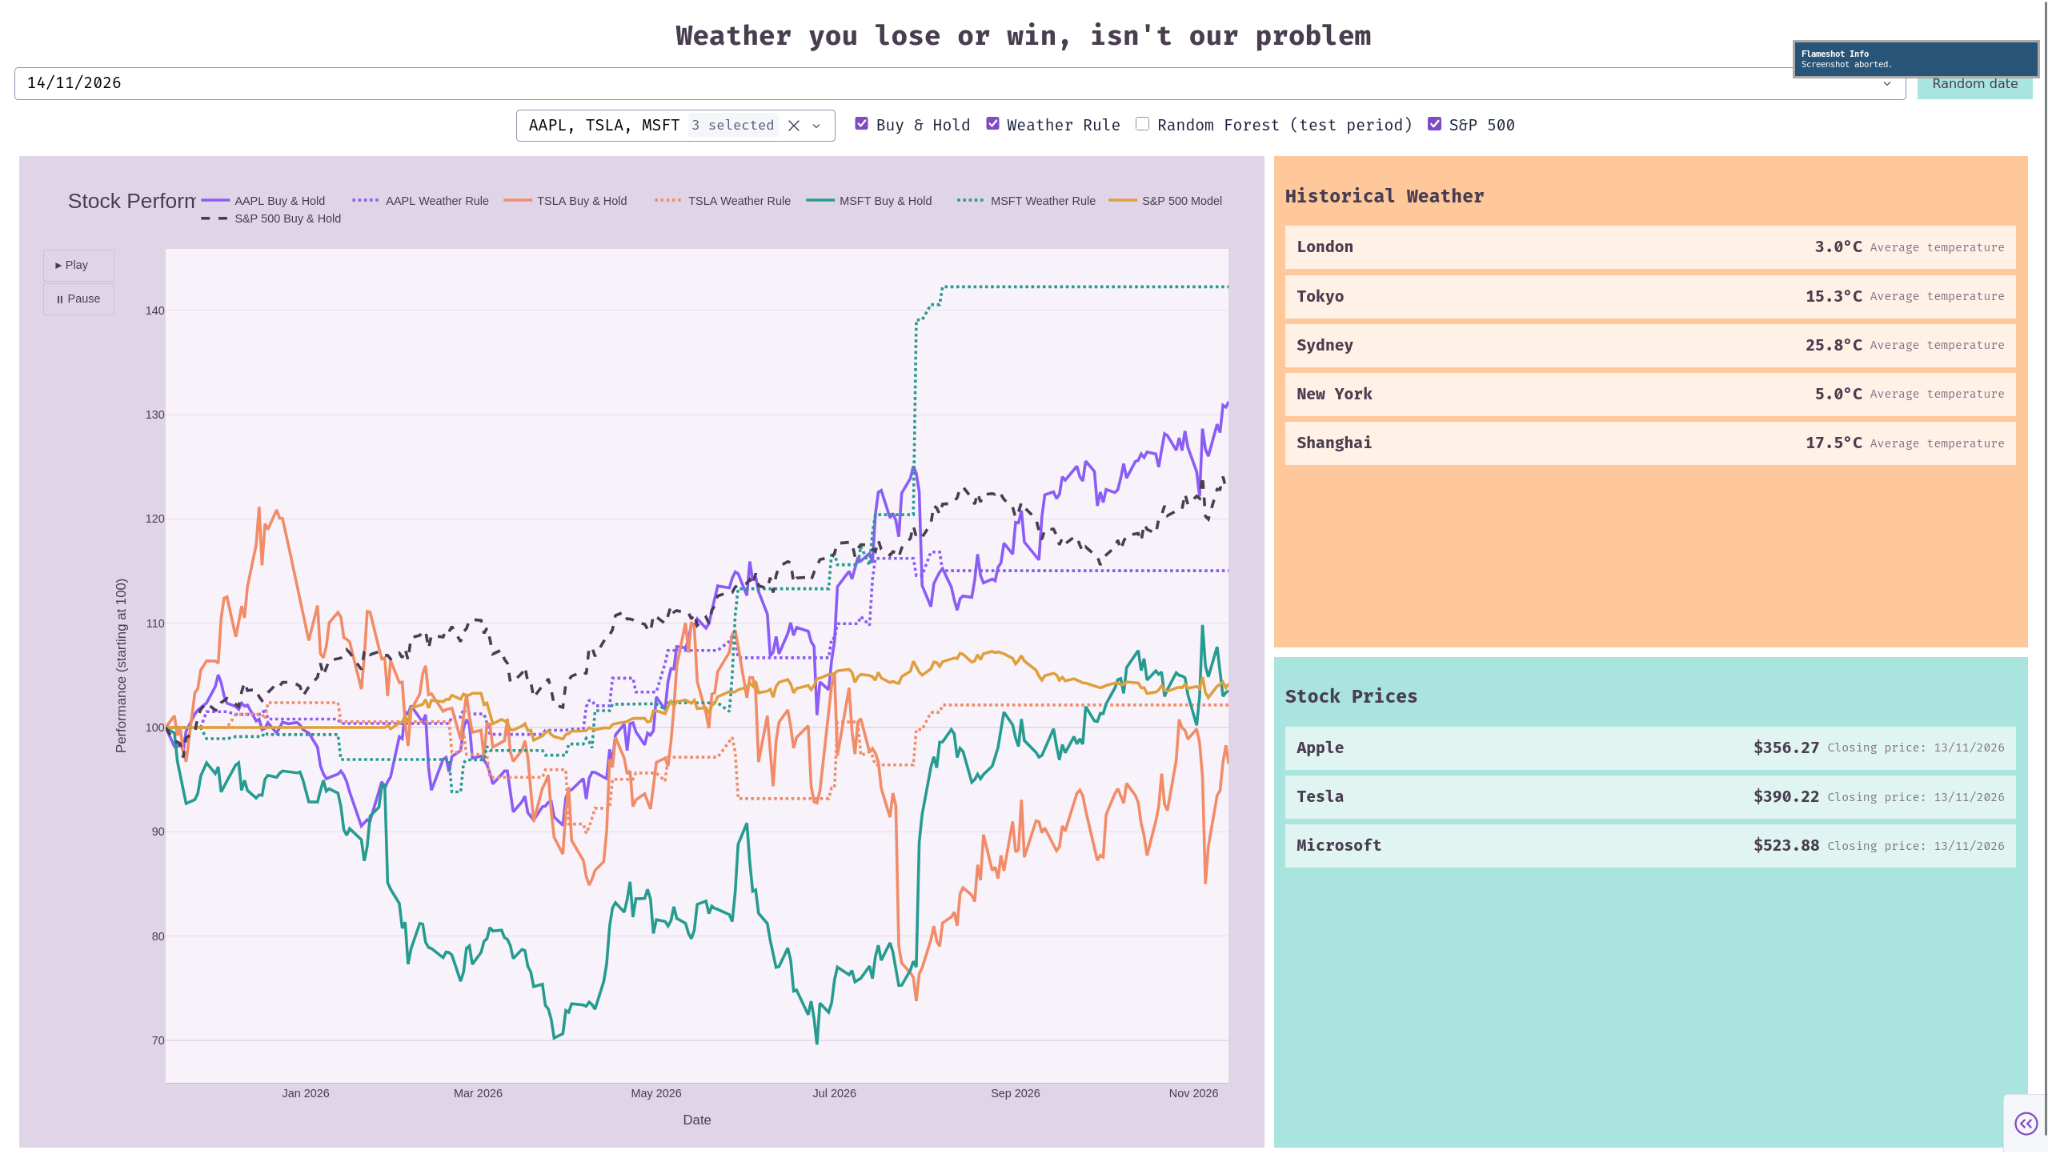
Weathering A Stock Market is an interactive dashboard that compares stock performance with the weather in five major cities: London, Tokyo, Sydney, New York and Shanghai.
- Stock graph: an animated chart that plays forward through the last year. You choose which stocks to show, and it can also show a weather-based strategy, a machine-learning strategy and the S&P 500, all starting from 100 so they’re easy to compare.
- Weather rule: a simple strategy that buys on warm, sunny days and holds cash on cold, rainy days.
- Machine-learning model: a random forest trained on the weather data to predict BUY, HOLD or SELL for the next trading day. It is scored only on days it never saw during training. Date picker: choose any day (or a random one) from the past year to see each city’s average temperature and each stock’s closing price. How we built it
We built it in Python.
- Weather data: hourly temperature, humidity, rain and cloud cover from the Open-Meteo API, averaged into daily values for each city.
- Stock data: daily closing prices for Apple, Tesla, Microsoft and the S&P 500.
- Analysis: pandas to join the weather with the trading days. The weather rule scores each day by how warm it is compared with the last 30 days, then adds points for sunshine and subtracts points for rain. We averaged this across the cities.
- Model: scikit-learn’s random forest on the weather features. We split the data by time rather than randomly, so the model never sees the future.
- Dashboard: Dash and Plotly for the interface, with callbacks that redraw the animated graph when you change the stocks or strategies. Challenges we ran into
- A very small dataset: one year gives only about 250 trading days, so any pattern we find could easily be chance.
- Animating the graph: the lines had different lengths, so the animation needed fixed axis ranges and frames built for the longest line to look smooth.
- The stock market is also not open on the weekends.... # Accomplishments that we’re proud of
- A working end-to-end pipeline that goes from live weather and stock APIs to an interactive, animated dashboard.
- Testing the weather ideas fairly, on days the model had not seen, instead of showing only results that look good.
- A flexible app where you can add stocks and switch strategies on and off, instead of a single fixed chart. # What we learned
- How weather data, time zones and trading calendars fit together, and how to design a dashboard that updates from user input.
What’s next for Weathering A Stock Market
- Add several years of data, so the results are more reliable.
- Include trading costs, to see whether any strategy would still work in practice.
- Add more weather signals, such as sunshine hours, extreme weather events and air quality. Add more cities and more stocks, and let users build their own rules from the dashboard.
Built With
- open-meteo
- pandas
- python
- scikit-learn
