💡 Inspiration
Every weather app answers "what's the temperature?" None answer the question that actually drives decisions: "is this abnormal?" A trader pricing energy demand, an agronomist watching for frost, a grid operator forecasting load — they don't care that it's 28°C, they care that it's +2σ above normal for this city, this week. That signal lived only inside expensive enterprise platforms or buried in raw reanalysis datasets. I wanted it free, global, and one API call away.
🌍 What it does
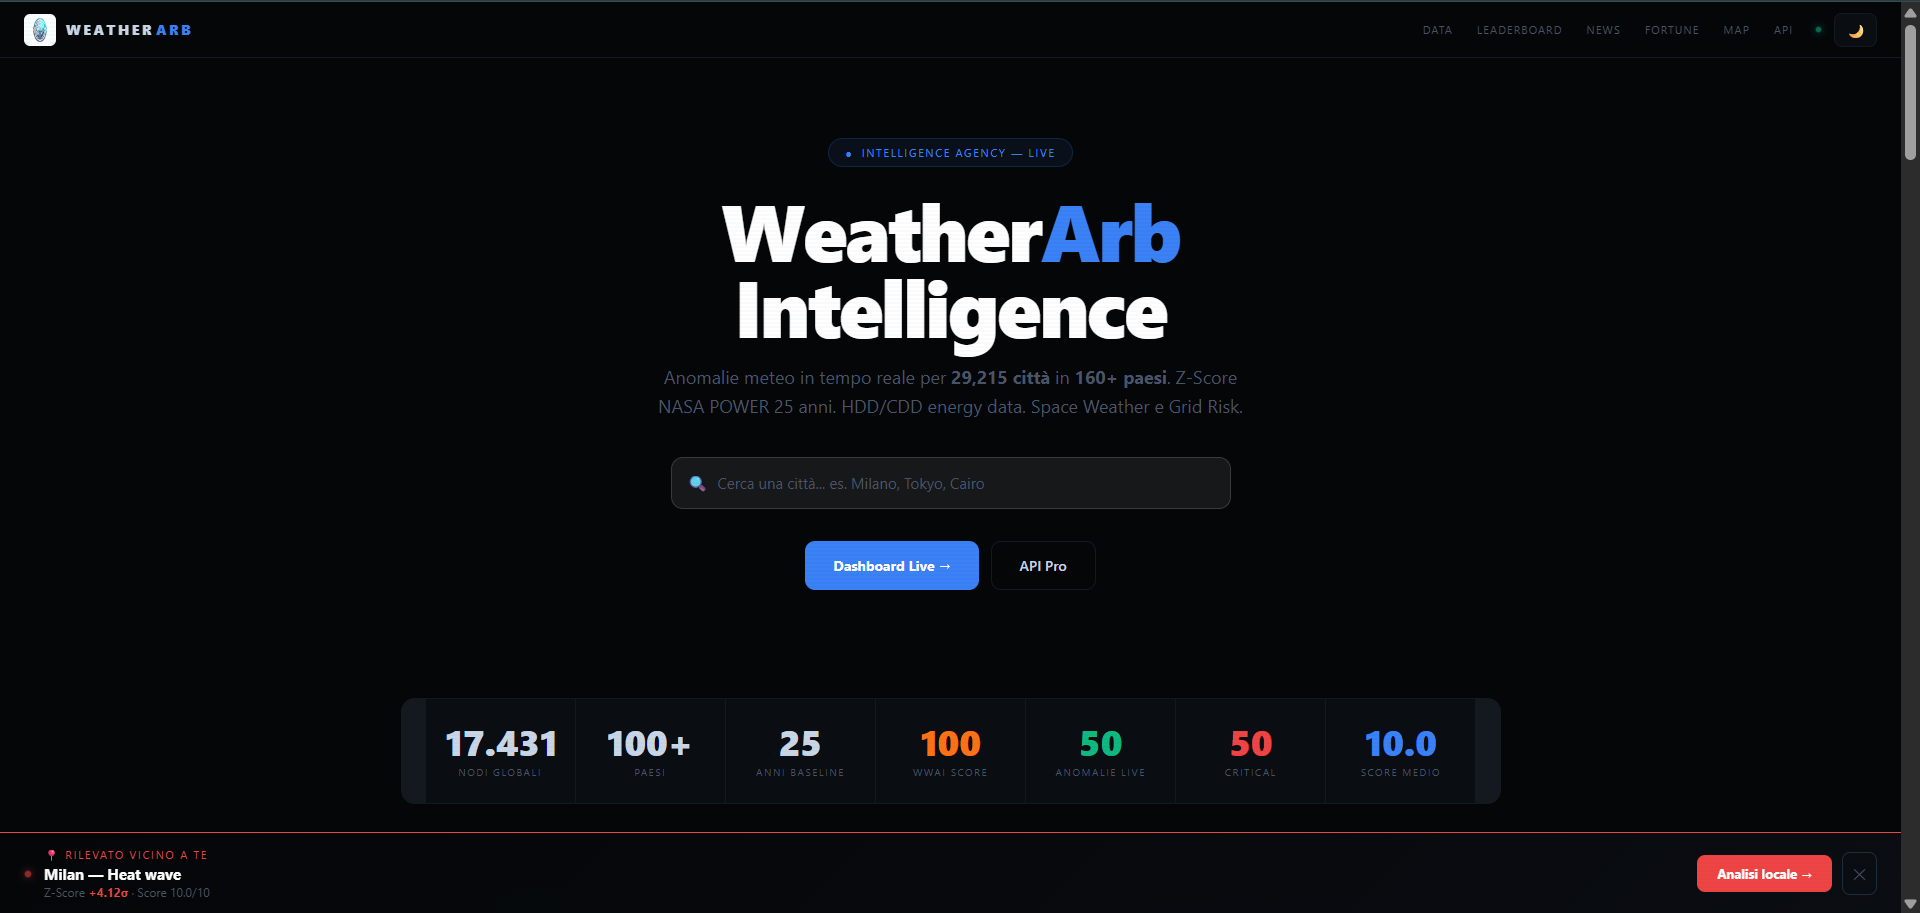
WeatherArb converts raw weather into a standardized anomaly signal for 29,000+ cities across 160+ countries.
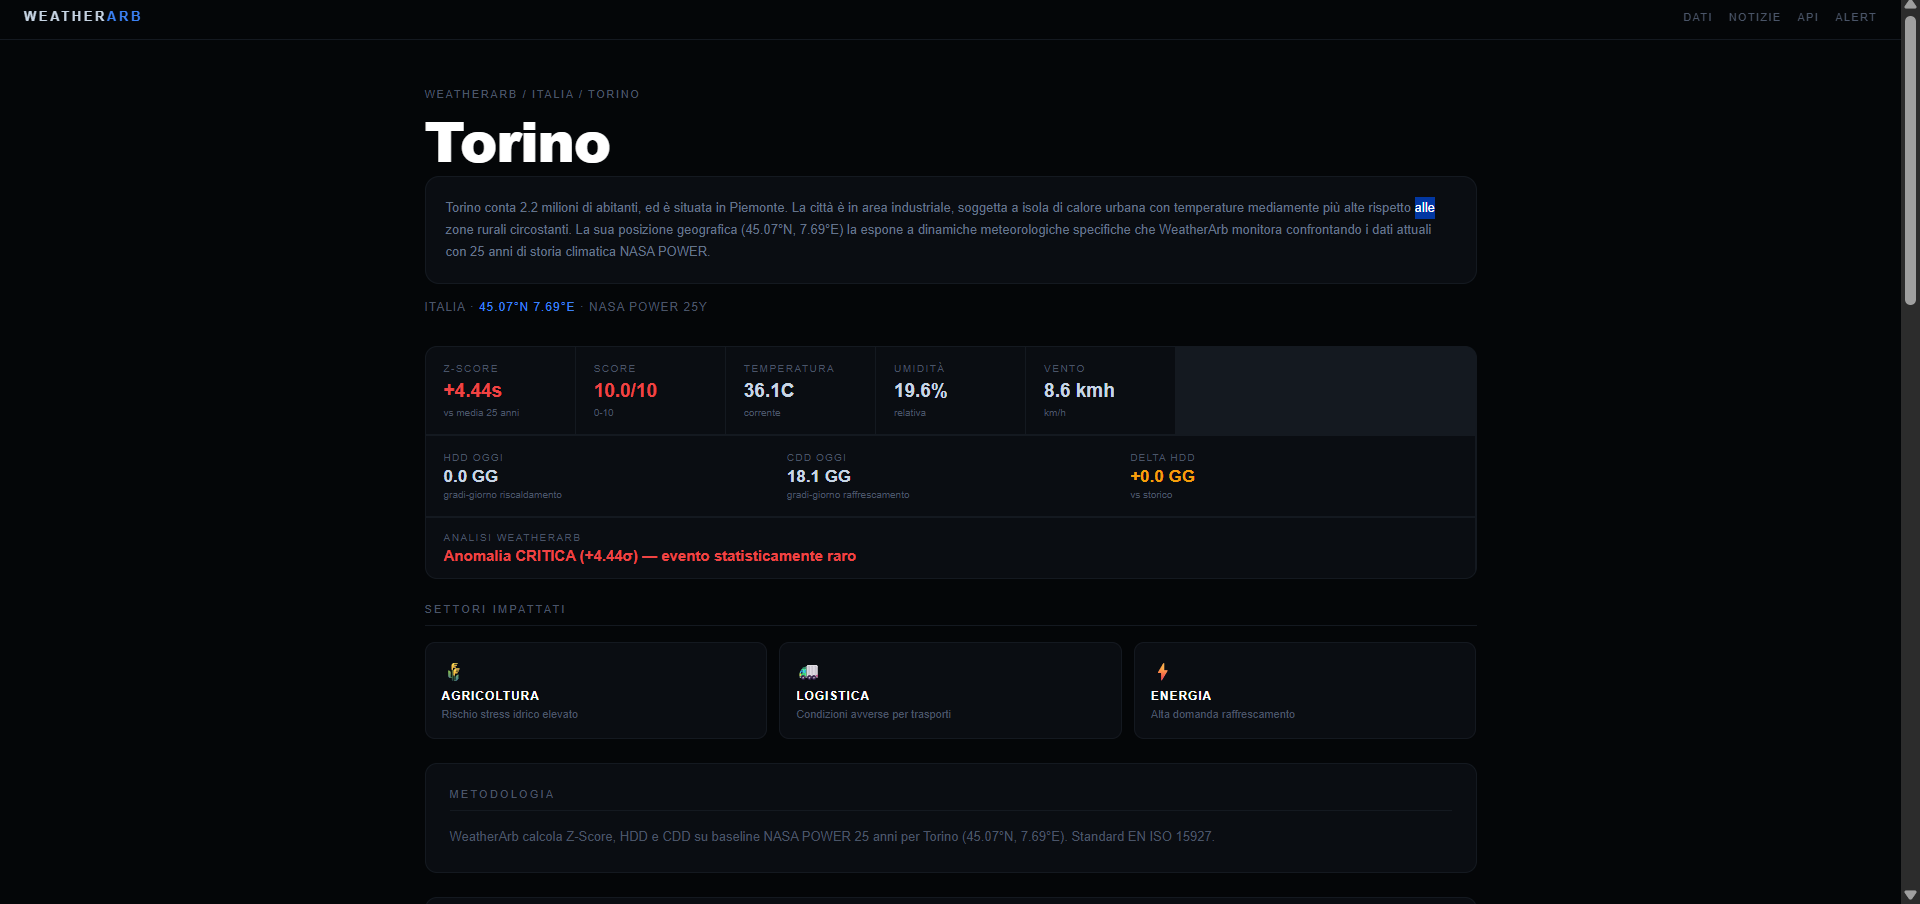
For each city it computes a climatological Z-Score — how far current conditions deviate from that exact location's 25-year NASA POWER ERA5-Land baseline:
$$ Z = \frac{x - \mu}{\sigma} $$
where ( x ) is the current temperature, ( \mu ) the 25-year seasonal mean for that location, and ( \sigma ) its standard deviation. A score beyond ±2σ flags a genuinely unusual event.
On top of that it adds:
- HDD/CDD energy metrics (Heating/Cooling Degree Days vs. historical average) for demand forecasting
- a 0–10 composite risk signal with per-sector impact (energy / agriculture / logistics)
- the World Weather Anomaly Index (WWAI) — a single 0–100 global anomaly score
- heat-wave and cold-snap / frost trackers
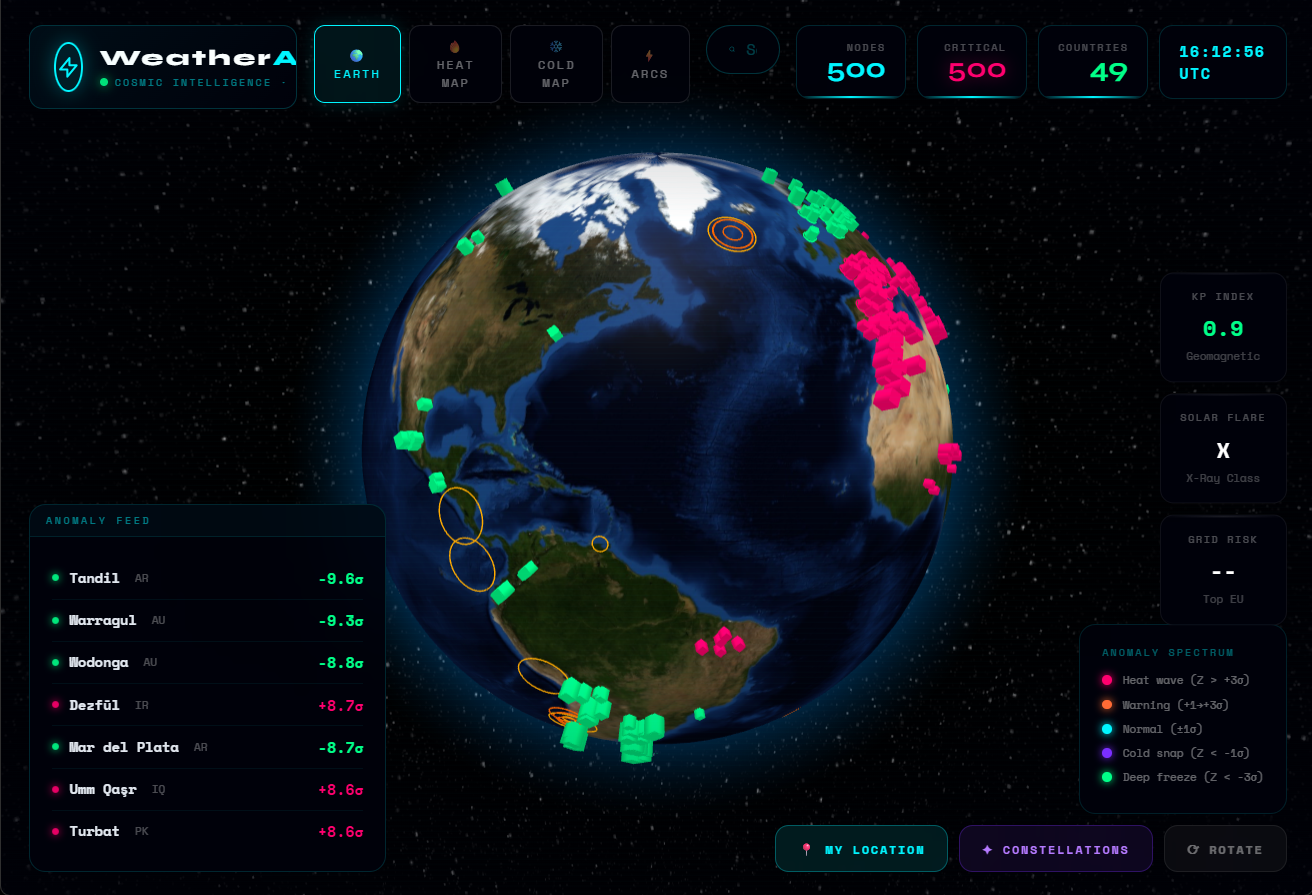
Everything is browsable through an interactive 3D globe and city pages in 6 languages, and fully accessible through a free public REST API — no key required for basic access.
🛠️ How I built it
- Backend: FastAPI (Python), serving the anomaly API at
api.weatherarb.com - Climate engine: NASA POWER ERA5-Land, with 25-year baselines precomputed per city so the Z-Score is a fast lookup at request time instead of a heavy live computation
- Data layers: USGS seismic feeds + space-weather / grid-risk signals
- Storage / Auth: Supabase
- Frontend: Cloudflare Pages with a Three.js-based 3D globe
- Content: Groq LLM generating localized climate articles across 6 languages
- Distribution: SEO-optimized static city pages with hreflang and sitemaps
Endpoint example:
GET https://api.weatherarb.com/api/v1/pulse/milan
🧗 Challenges I ran into
- Baselines at scale. Computing 25-year statistical normals for 29,000+ cities without hammering NASA's API meant building a precompute + cache pipeline rather than calculating on the fly.
- Statistical honesty. A naive Z-Score against an annual mean is meaningless — the baseline has to be seasonal (day-of-year aware) per location, or a normal summer reads as an anomaly.
- Multilingual SEO at 29k pages. Getting hreflang, canonicals and sitemaps right across 6 languages without triggering duplicate-content penalties.
🏆 Accomplishments I'm proud of
It's not a prototype — it's live and deployed, indexing tens of thousands of pages, with a working public API anyone can call right now with zero setup.
📚 What I learned
Turning a raw data feed into a decision signal is mostly a statistics and data-engineering problem, not a UI one. The hard, valuable part was the baseline pipeline and making the anomaly math trustworthy — the globe is just the window onto it.
🔭 What's next
Per-city historical anomaly charts, threshold-based alerting / webhooks, air-quality and UV layers, and tiered API access for the energy and agri users it's built for.
Built With
- cloudflare
- cloudflare-pages
- css3
- fastapi
- html5
- javascript
- nasa-power-api
- postgresql
- python
- rest-api
- usgs-api


Log in or sign up for Devpost to join the conversation.