-
-

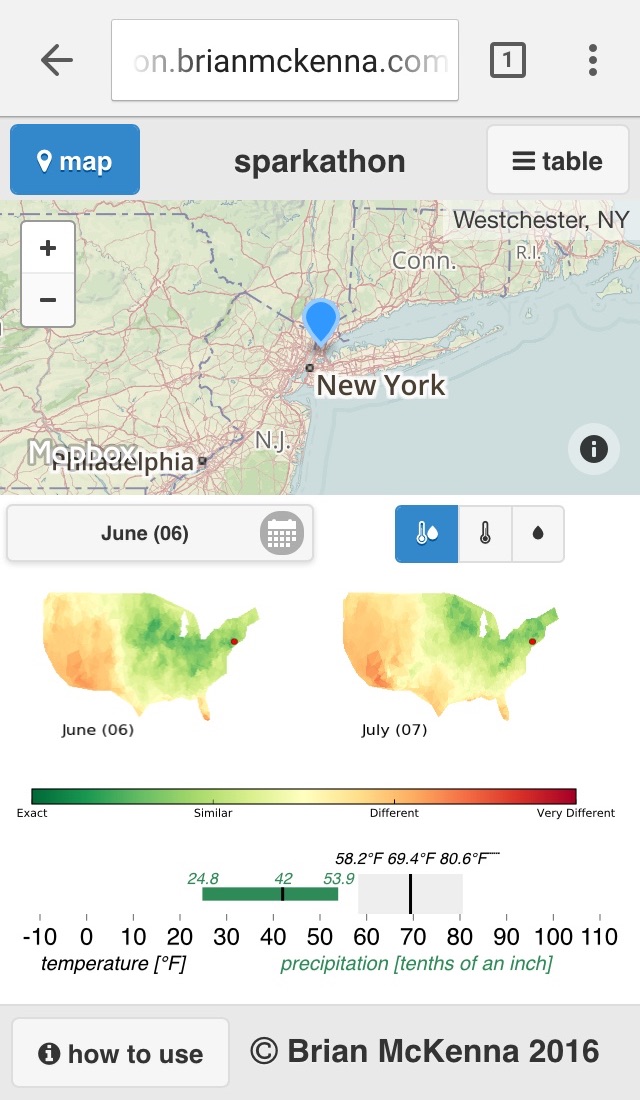
The Endless Weather main screen
-

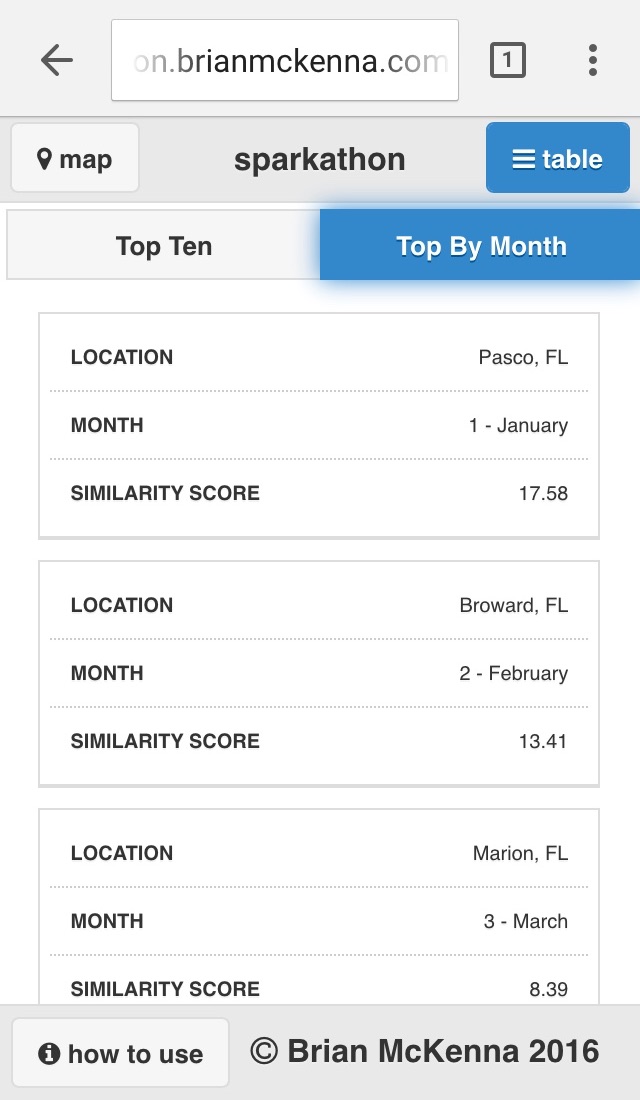
The 12 most similar locations by month to the one the user has selected
-
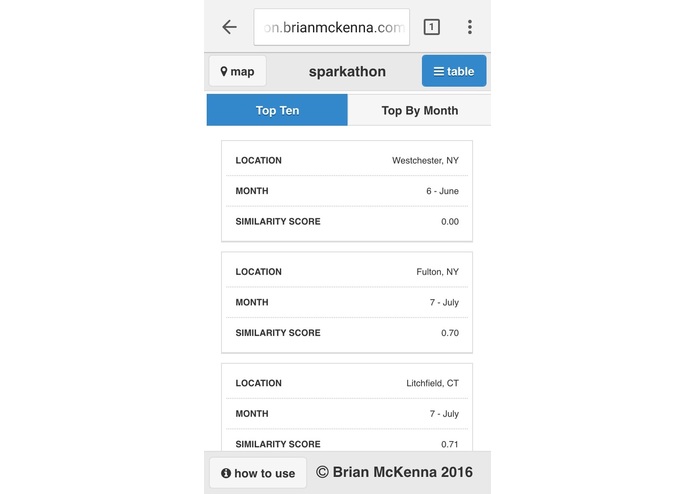
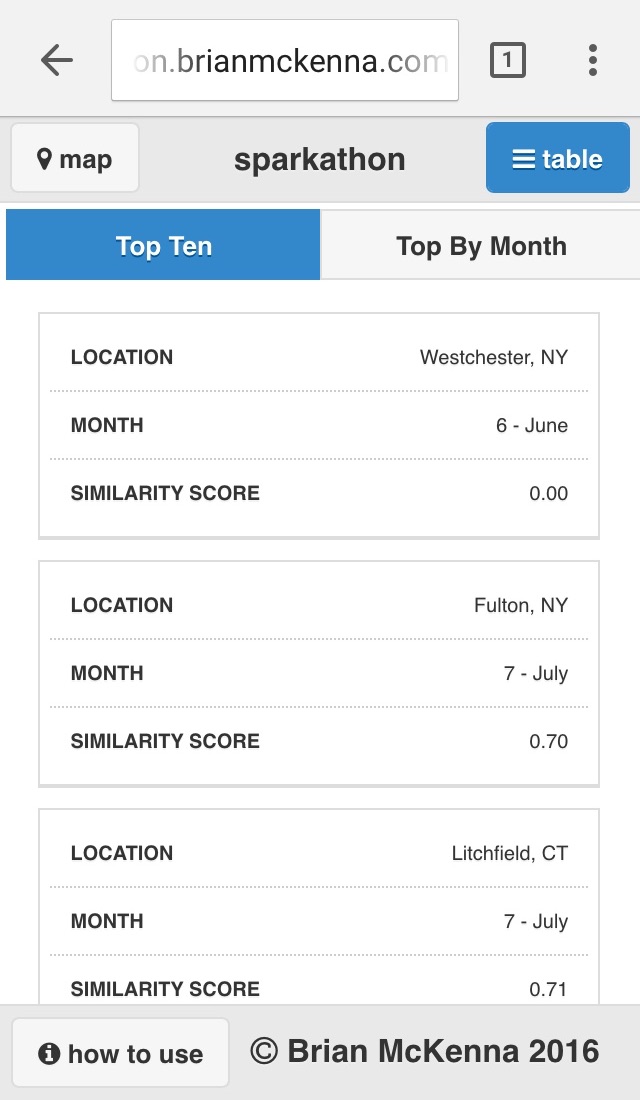
Top 10 most similar locations any time of the year to the location selected by user
Inspiration
How many travelers seek destinations with similar weather to their favorite vacation spot? Are you a golfer looking to vary the annual trip to Myrtle Beach, but maintain the same temperature? Are you deciding on family vacation spots, and would love a list of destinations most similar in weather to Cape Cod? Embedded in our fondest memories is the weather of that particular day - a beautiful day at the beach, a perfect day on the slopes, or a sunny day on the greens. What if you could find that weather again somewhere, sometime, could you find that memory as well?
In 1966 the famous surf filmmaker Bruce Brown traveled the world in search of an Endless Summer. Spending a year locked in their favorite weather sure turned out to be a great decision. In the spirit of The Endless Summer, I set out to find my own Endless Weather with any conditions I wished, and determine where that would take me- be it Utah, Vermont, or even Wine Country.
High quality local climate data is kept in many locations nationwide, but is often just used to help pitch today's forecast or contribute to the global climate picture. What other stories can this data tell? Here, we find out.
The IBM Bluemix cloud allowed us to take temperature and precipitation data and turn it into information rich maps and virtual itineraries telling us where and when to be.
What it does
Monthly temperature normals (average daily minimum, average daily, average daily maximum) and precipitation normals (25th percentile, median, 75th percentile) are imported into the Apache Spark environment.
The data is first formatted through a series of map-reduce steps to create a vector representing the climate normals at each of the 1164 locations for 12 months, a total of 13,968 locations in space and time.
These vectors are then compared to every other vector in space and time by computing the euclidian distance, a similarity metric, between the pairs.
The resulting similarity values are then organized through another round of map-reduce steps to arrive at 13,968 arrays , each with 13,968 values comparing this time and place with all others (total 195,105,024 values).
The results, both graphic and numeric, are presented through a mobile web application allowing the user to quickly and easily position the interactive map to the location of their choice (sorry, only continental United States this iteration!), select the month which they would like to compare against, and have the images shown, as well as explore several tables of data illustrating just where the most similar locations and times are.
How I built it
Apache Spark provides a Python binding, PySpark, which is ideal for scientific data analysis, given Python's strengths in data analysis, statistics, and scientific data libraries.
Data from the US National Centers for Environmental Information's (NCEI) 1981–2010 Climate Normals were imported to the provided Object Storage. Spark Resilient Distributed Dataset's (RDD's) are created from these files and joined, then organized through a series of map-reduce operations, resulting in an RDD containing key-value pairs of location/month key and climate normal values.
PySpark's cartesian operator comes in handy to create a new RDD that is a cartesian product of the original RDD with itself, with all possible pairs (195,105,024 pairs) of keys now represented and ready to be distributed.
A method was created using the numpy library to compute the Euclidean distance between each vector pair and mapped to each pair in the RDD. Apache Spark held true to it's reputation with over 195 million vector operations taking well less than 1 hour.
The RDD containing the distance between each pair of vectors, or similarity between the two, was then organized through a series of map-reduce operations, with the final RDD containing key-value pairs of location/month key and an array of 13,968 similarity values.
Using the geographic coordinates of each location, maps representing each calendar month of the year were created. A green/yellow/red color-scale was used with green indicating very similar (go!) conditions and red indicating very different (don't go!) conditions. Total images created are 12 images per location per month, a total of 167,616 images. Each image answers a question such as "How does the month of August across the US compare to my selected location in February?"
Challenges I ran into
Demo account scalability
High quality climate data is available for nearly 10,000 locations and available on a daily basis. The original idea was to compare all locations, all 366 days of the year (includes leap day). It was quickly determined that the demo account provided for the Sparkathon could not reasonably handle the nearly 91 trillion combinations that result from daily data at the full location list. The locations were trimmed down to only locations in the U.S. Historical Climatology Network (HCN) and monthly data were used to bring the scale of the demo into line with the provided infrastructure. I have no doubt the methods scale well with increased resources and such a large problem is still well suited for the Apache Spark framework.
Limited Object Storage
With the intent of creating over 167,000 images, periodic transfer to an external system was required to keep the storage usage below the limit.
Accomplishments that I'm proud of
Climate science is robust, but the presentation of climate data has been somewhat lacking. Such large datasets in time and space, combined with often complex statistical analysis of the data, can lead to a lessened interest in how to fully utilize the information. I believe this application, of comparing locations, provides a fun, inquisitive and information rich environment to both learn and plan based on local climate data.
This model can continue to be refined to bring more data and targeted information to all.
What I learned
Certainly Apache Spark (PySpark to be specific). As a long time data scientist, numerical methods using numpy are familiar to me, but being able to distribute the processes via an RDD was a real joy and impressive at times. My development cycle was helped by seeing results (and mistakes) quicker than I would have otherwise. Seeing the power and scalability of Apache Spark was a great value in the Sparkathon and Spark will remain a tool I'll use for future projects.
What's next for The Endless Weather
Daily data at all locations
I would love to extend the analysis to all locations and daily data using a much larger Spark infrastructure. Additional data such as wind and snow are available at daily frequencies and could really increase the value of the analysis.
Global Datasets
Where possible global datasets should be incorporated to not only compare the continental US, but all locations worldwide. By creating a comparison of all locations, any user could happen upon any set of weather conditions they can dream of.
Incorporate travel costs
Travel costs (hotel and airfare) could be incorporated into the results, showing the user not only where and when the conditions are very similar, but also where costs can be minimized for that particular experience.
UI development
With Big Data being the focus of the Sparkathon, much of the time was used for data analysis. Revisiting the UI development to include native mobile applications and refined layouts could enhance the utilization of the output.
Built With
- apache-spark
- javascript
- matplotlib
- numpy
- postgis
- postgresql
- python
- tornado


Log in or sign up for Devpost to join the conversation.