-
-
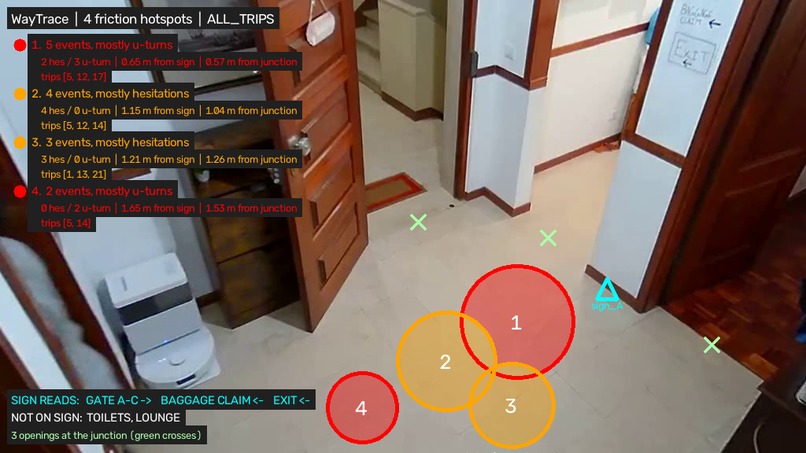
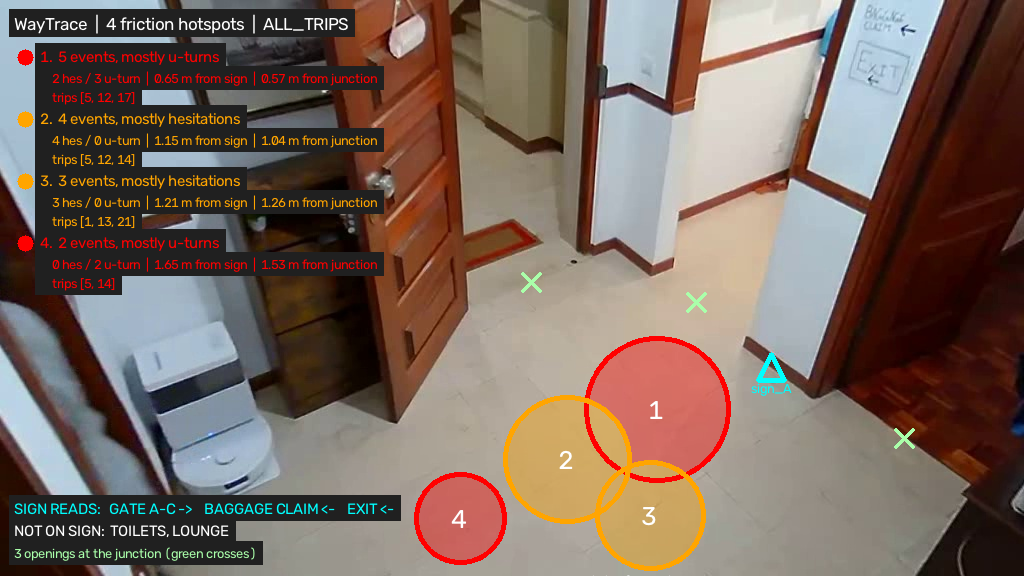
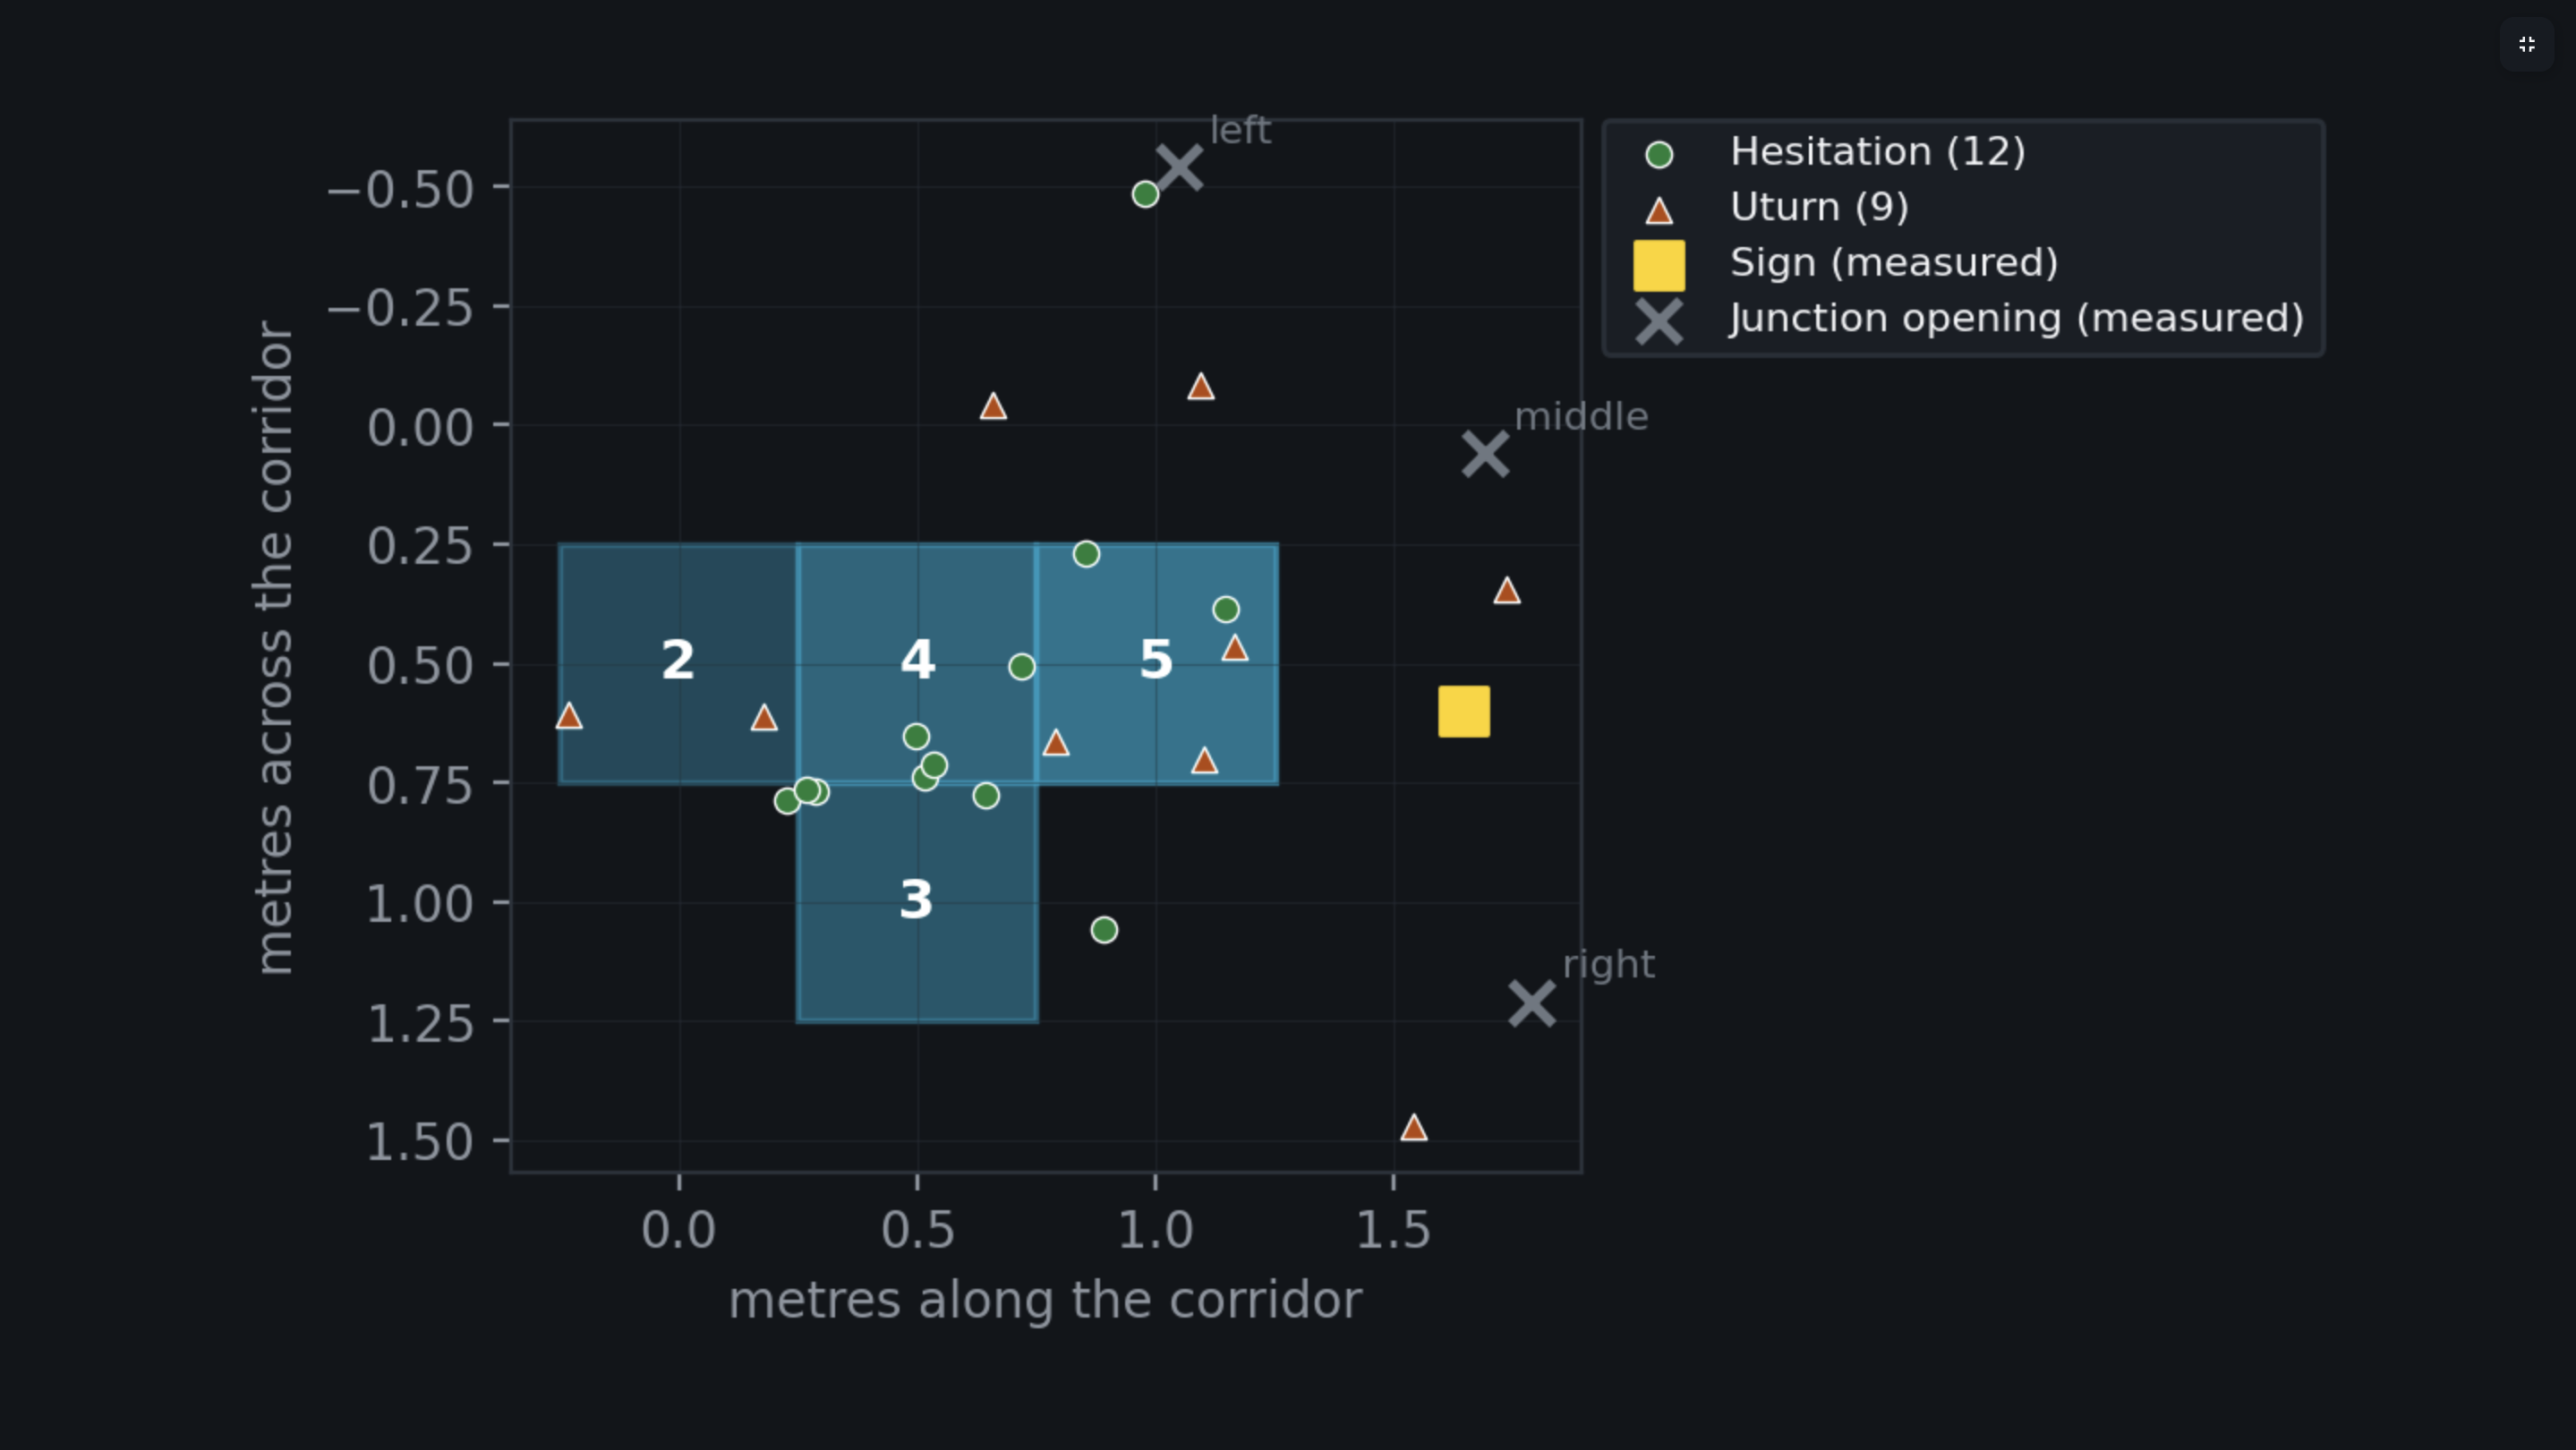
Four hotspots on real footage. Toilets and lounge aren't on the sign — and that's where people stop.
-
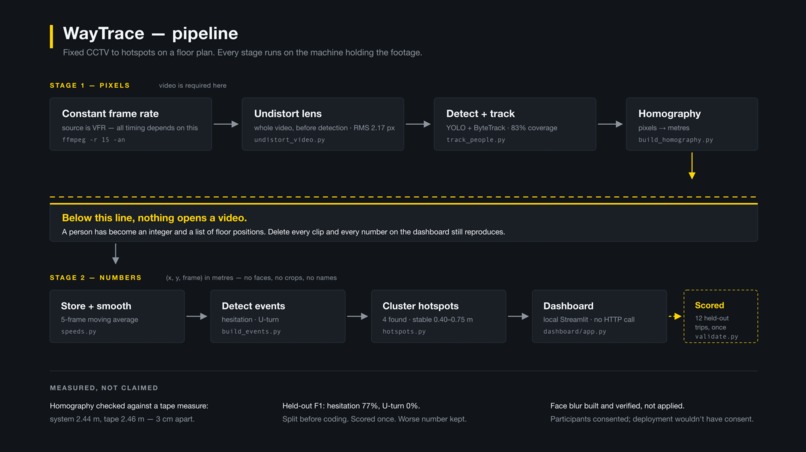
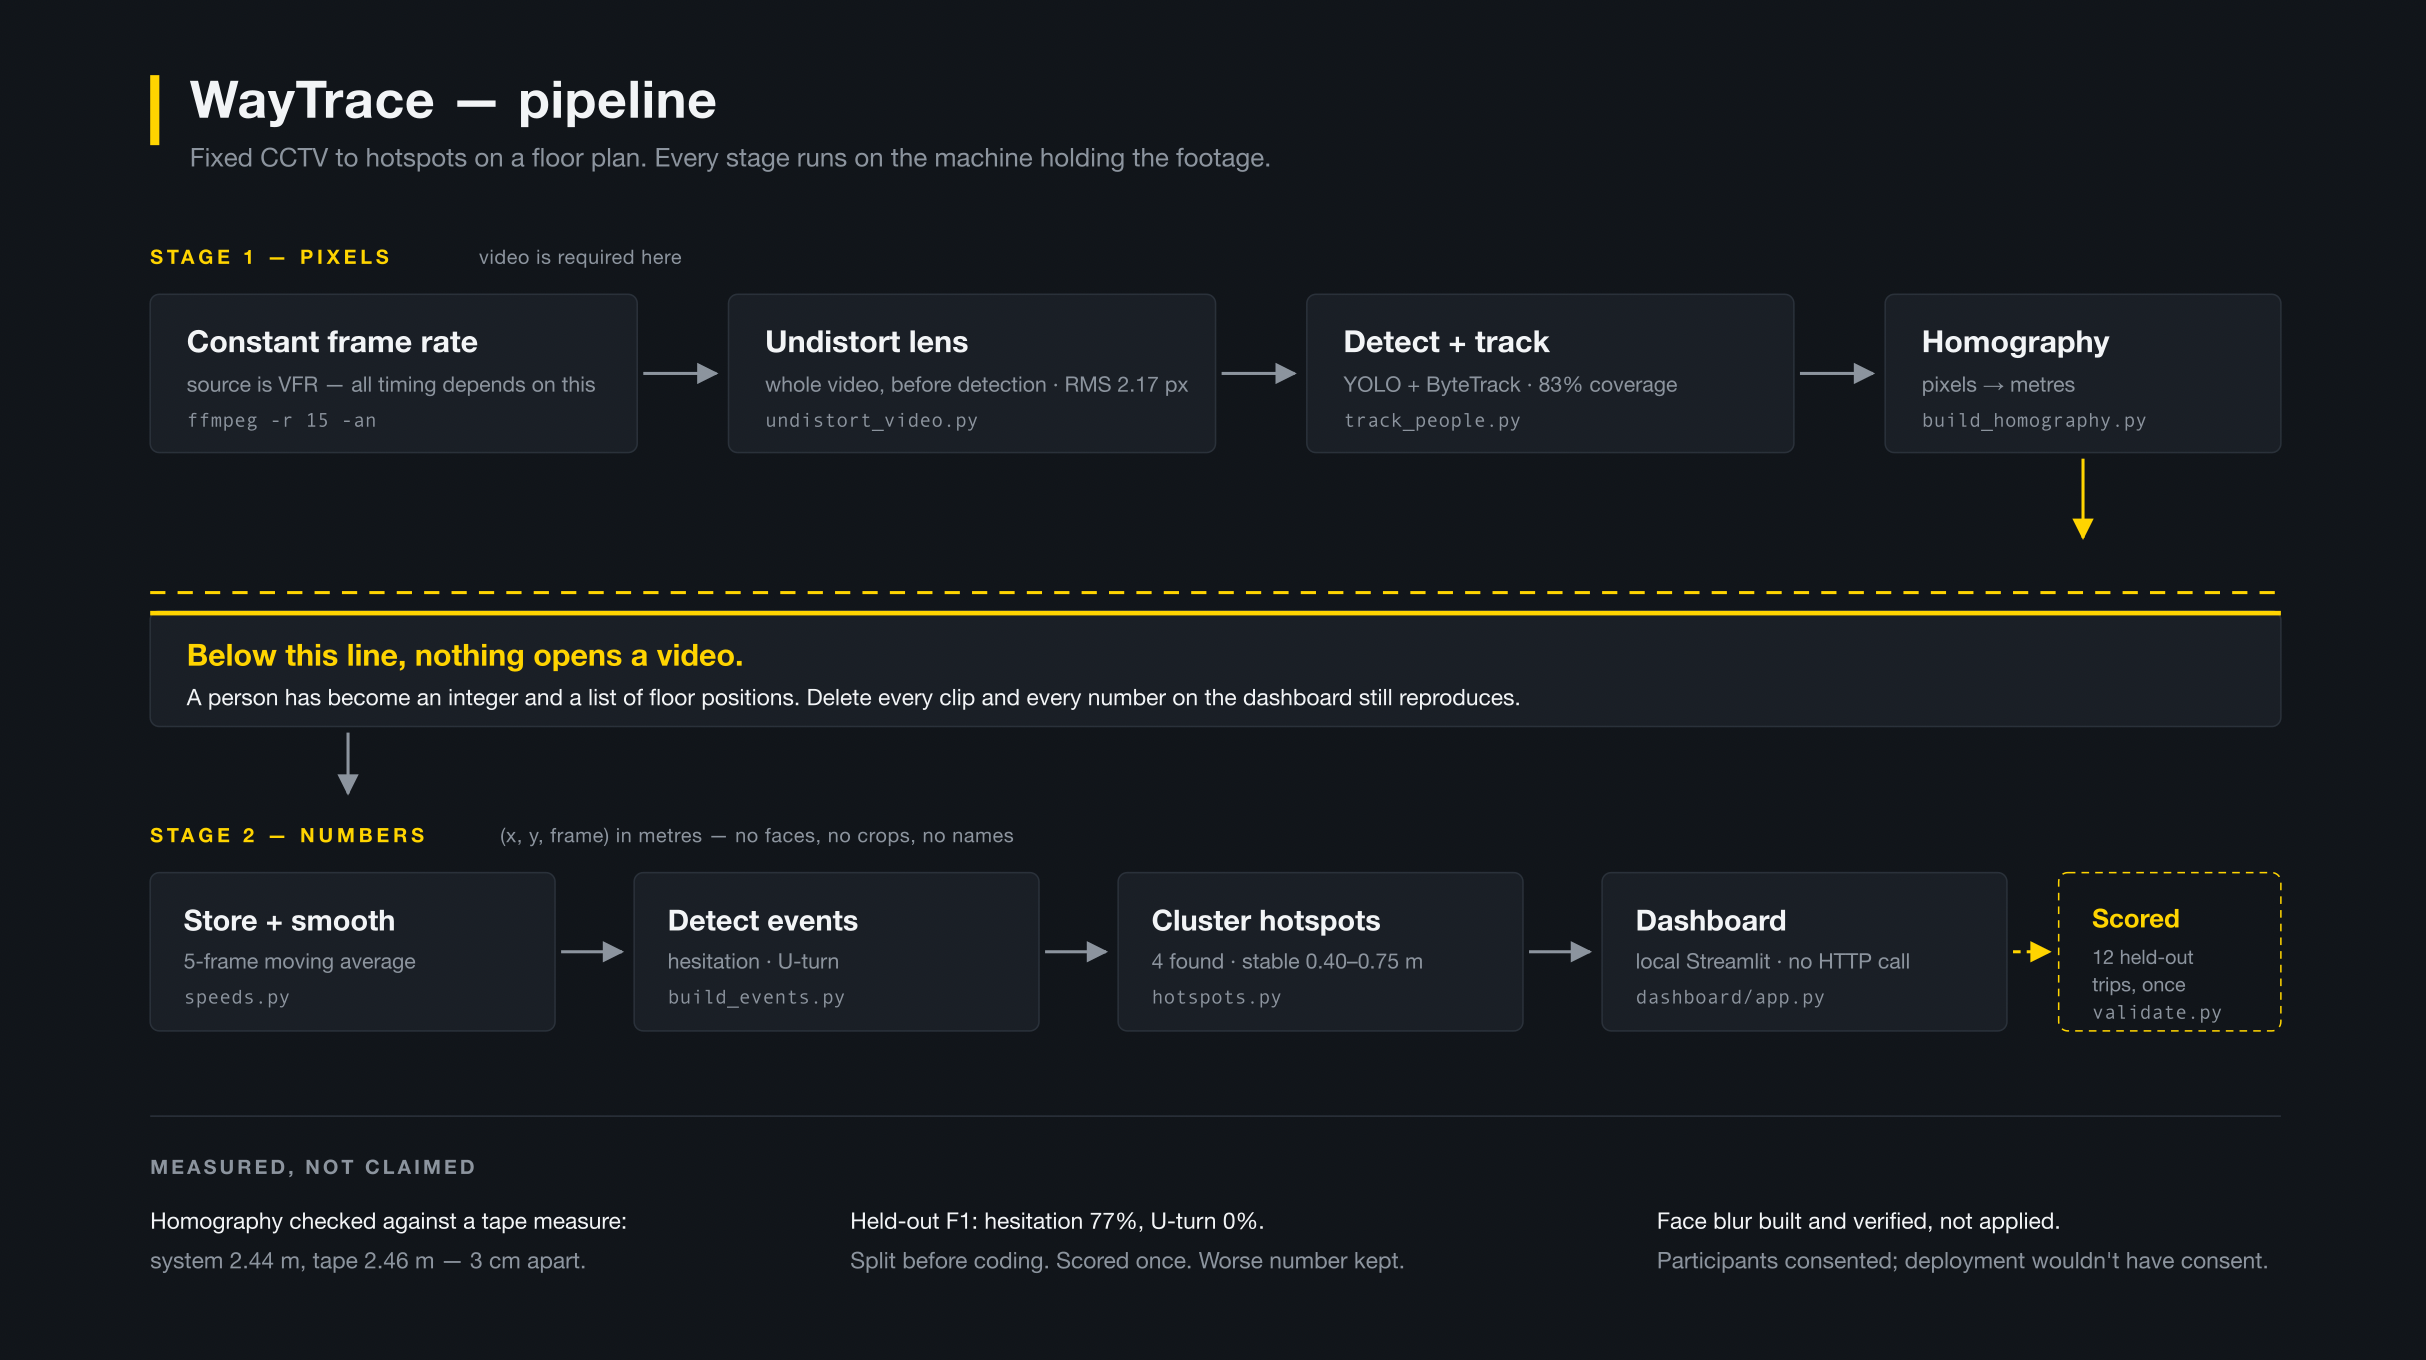
Above the yellow line, video is required. Below it, nothing opens a clip again.
-
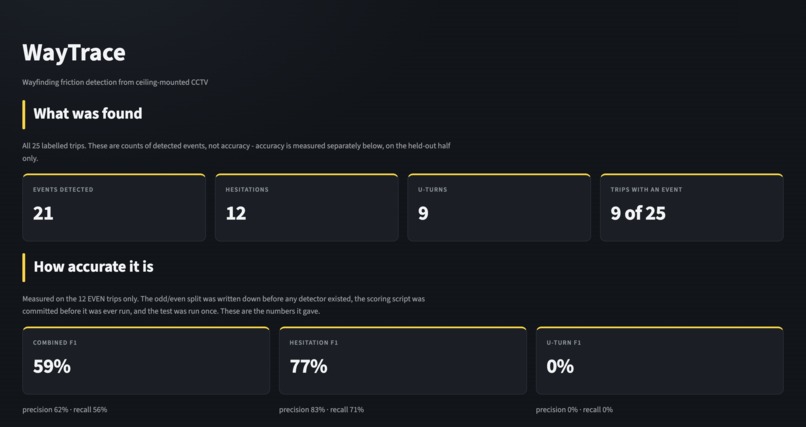
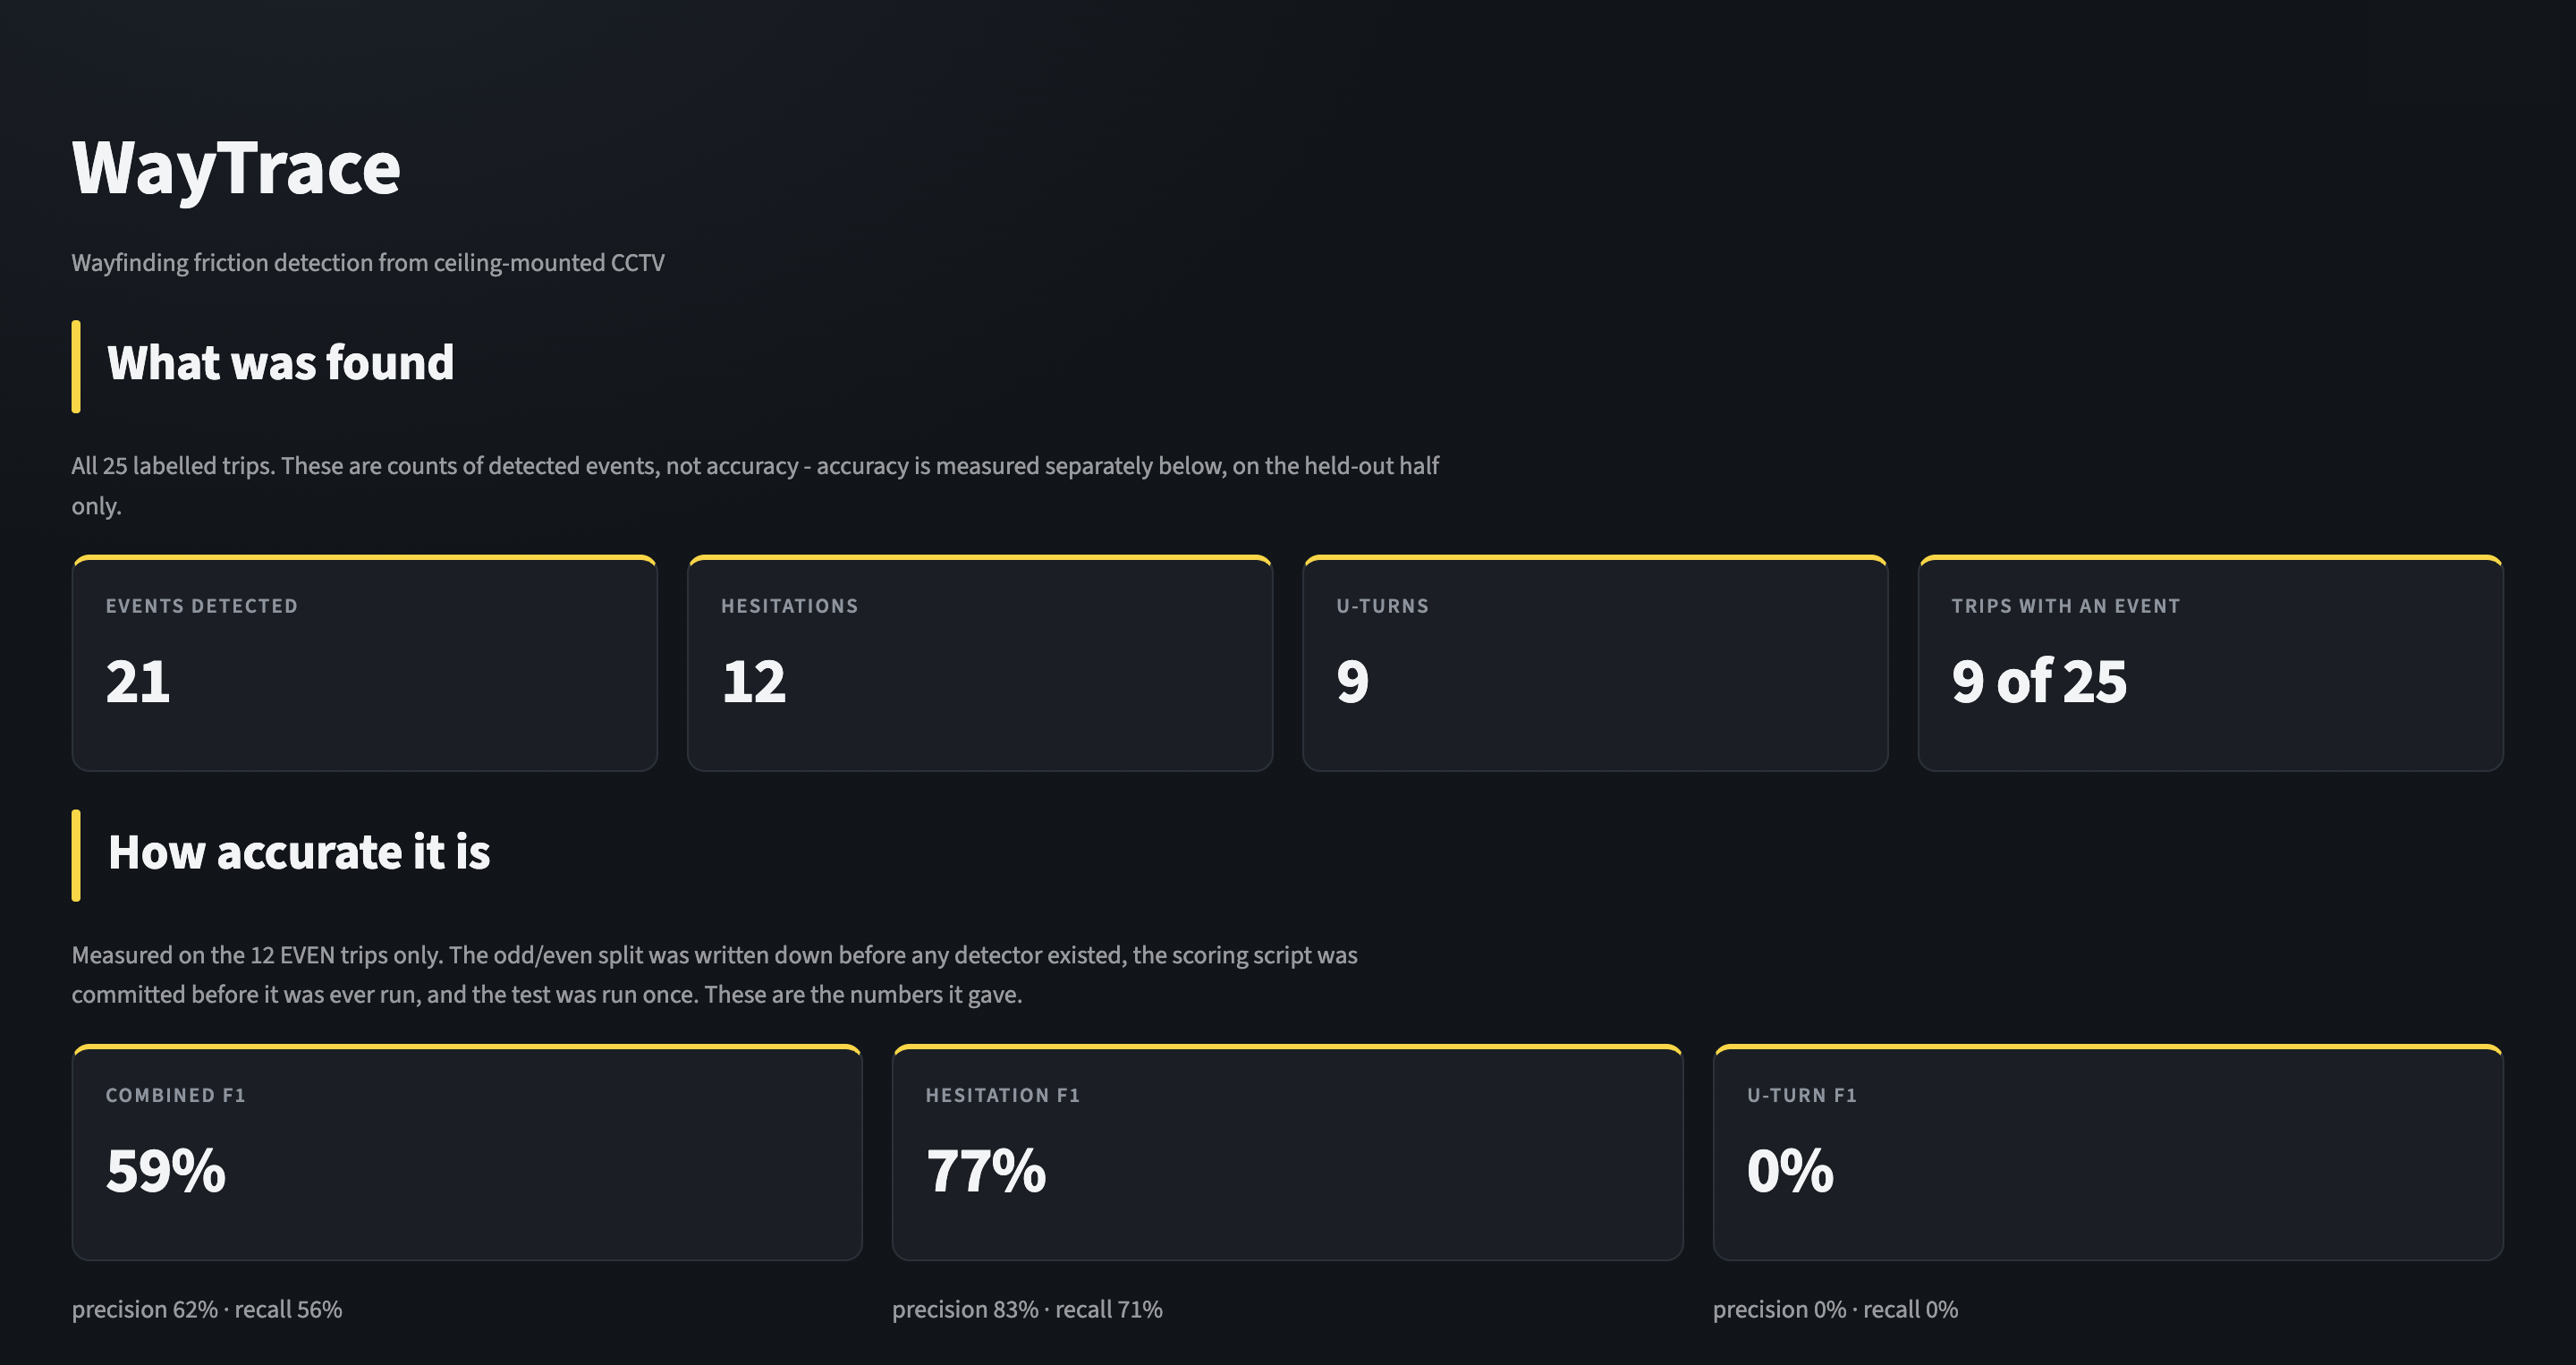
Measured on 12 walks the detectors never saw. The U-turn detector scored zero, shown not averaged away
-
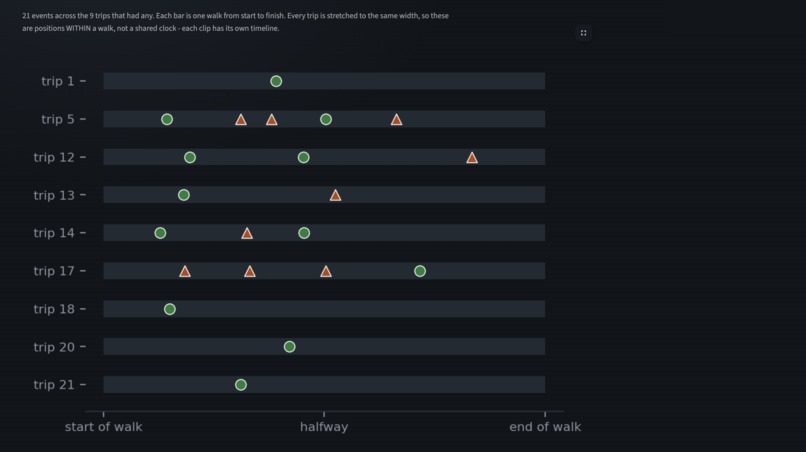
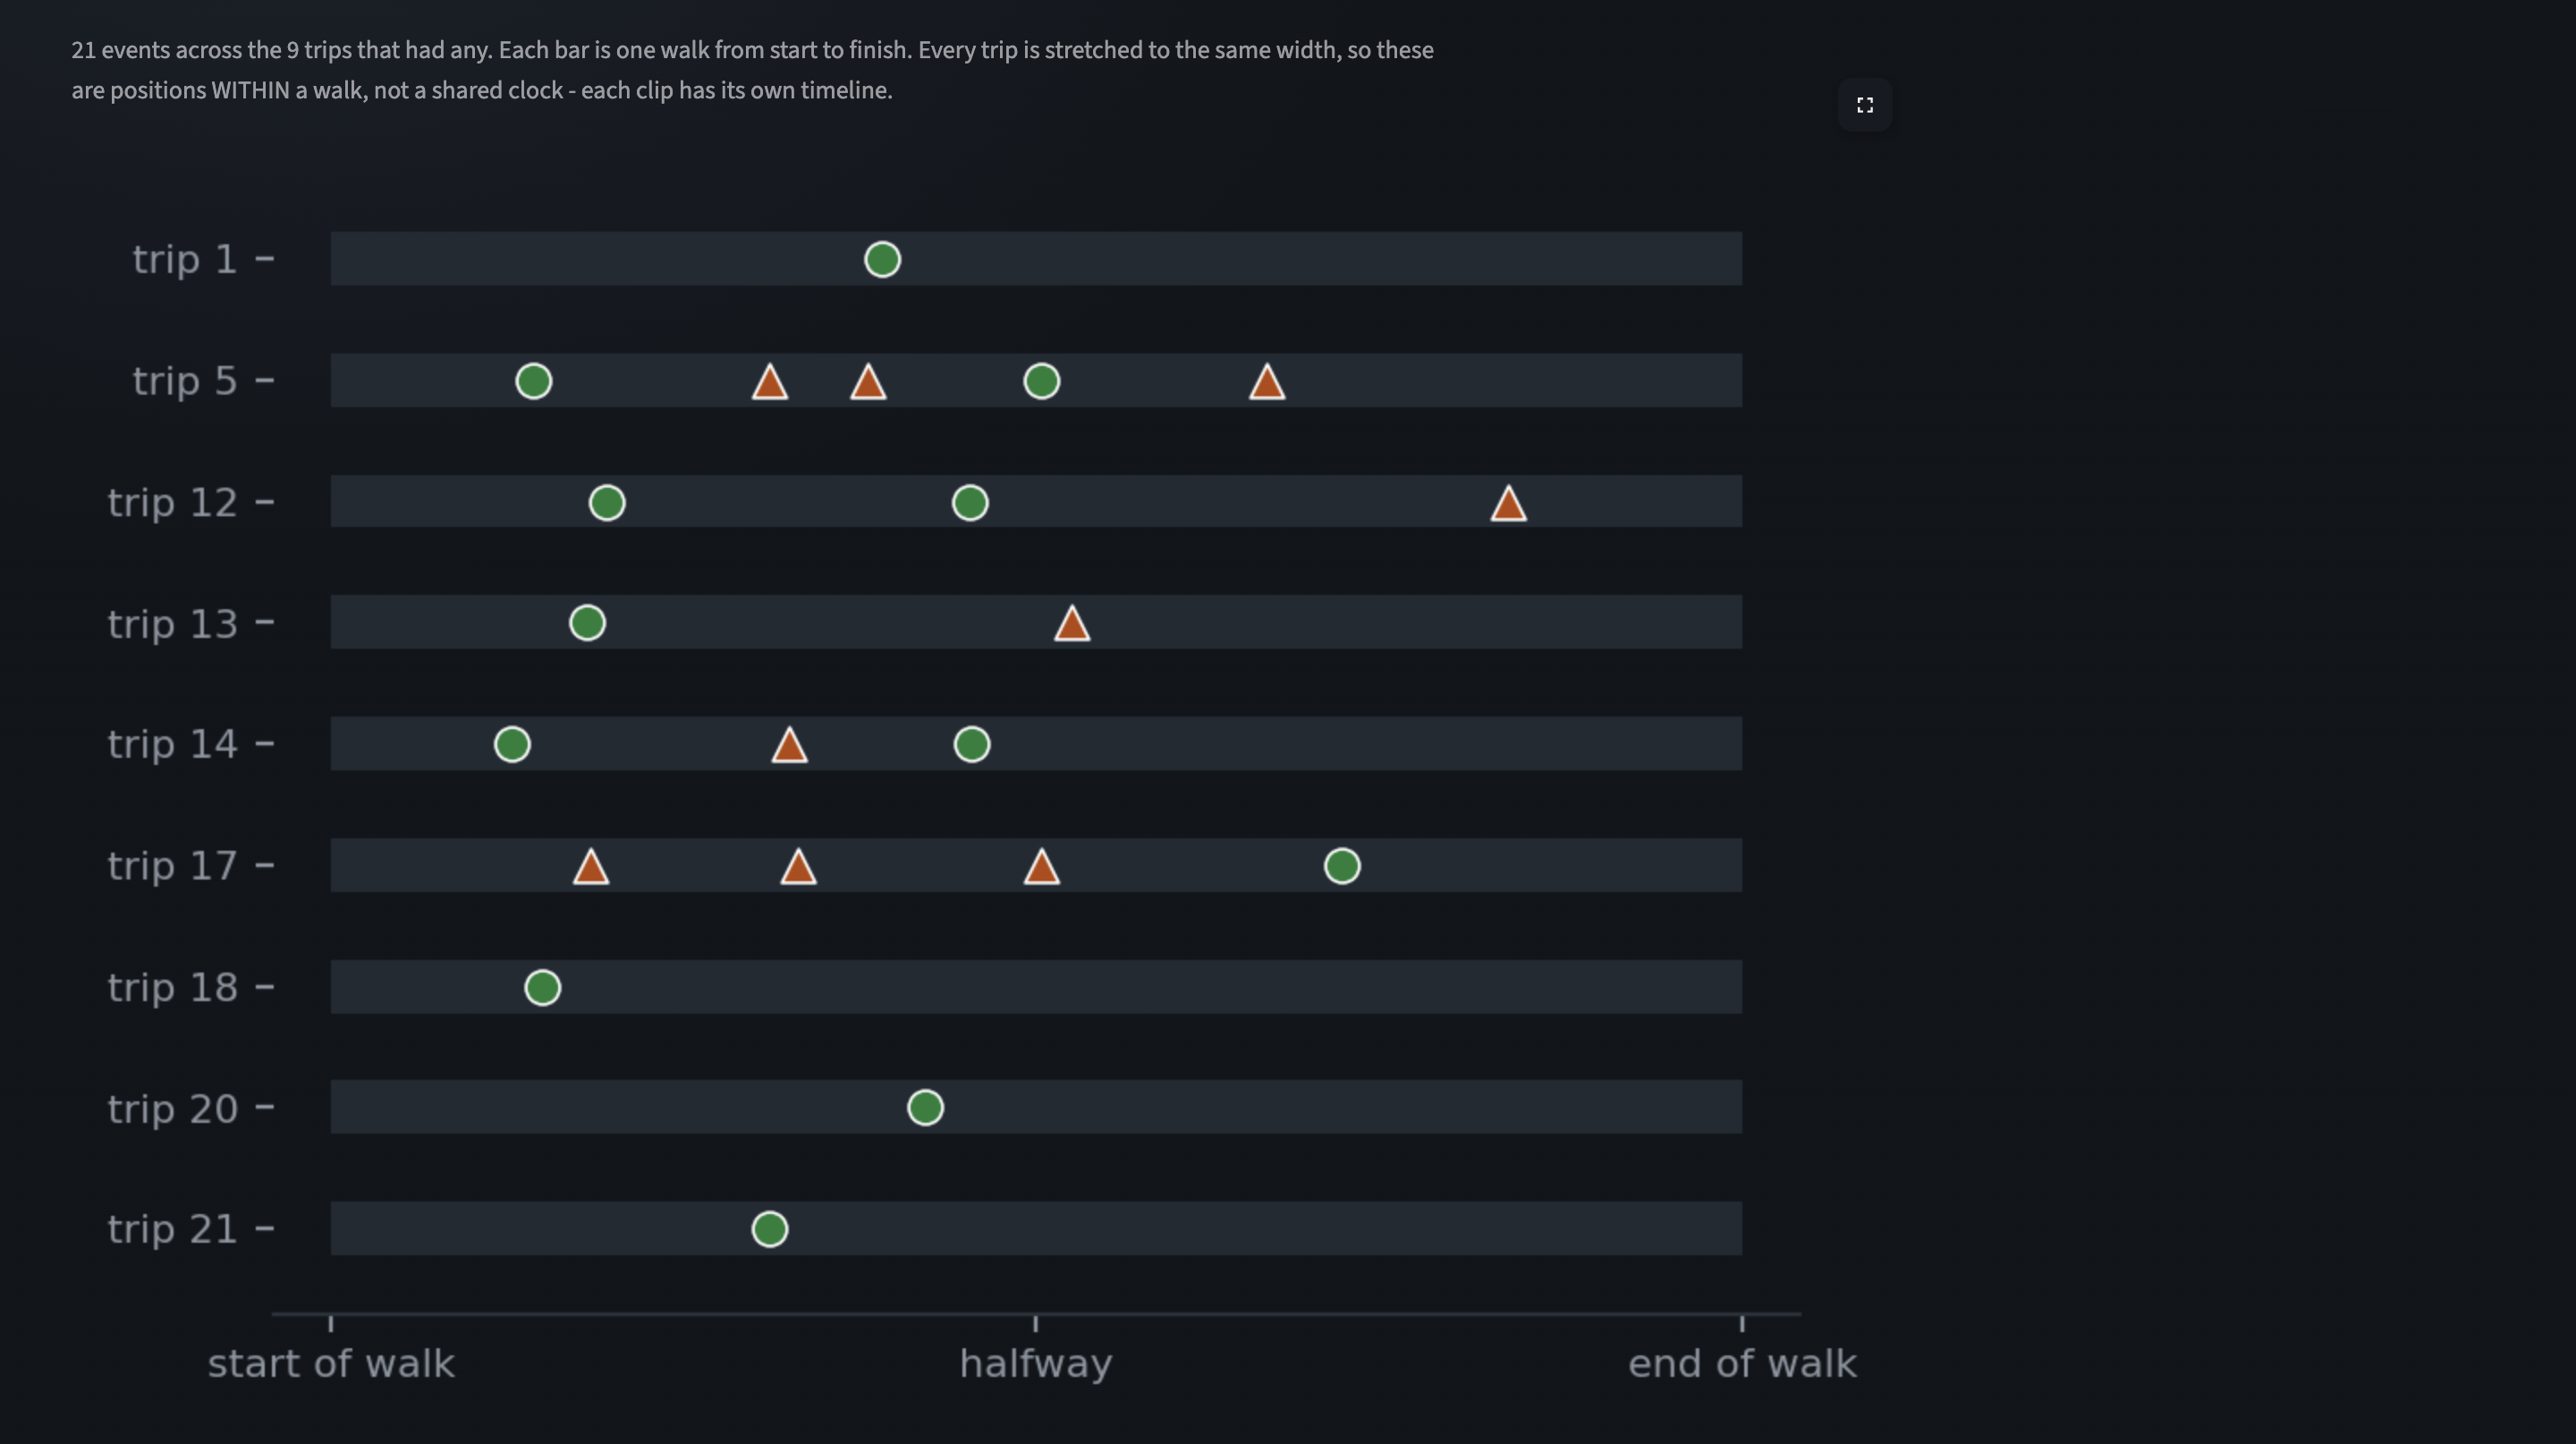
Nothing fires in the first or last tenth of any walk. A tracker losing people at the frame edge would.
-
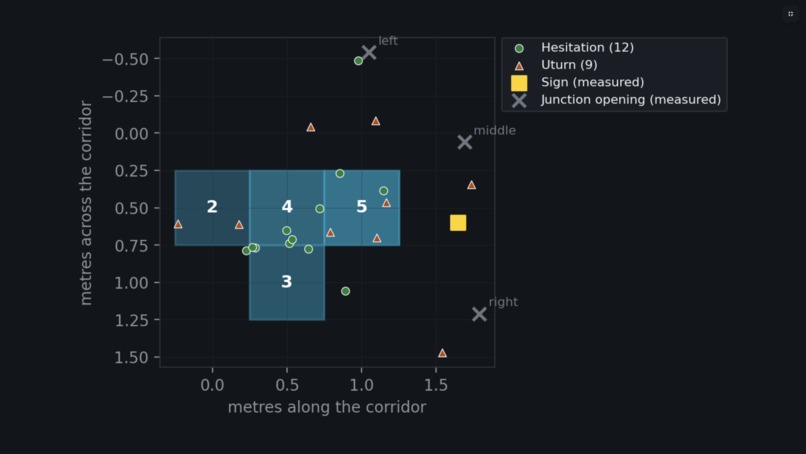
Every event in real metres. Green dot: someone stopped. Orange triangle: someone turned around.
The problem nobody measures
Your building gets inspected for fire safety. It gets inspected for accessibility. Someone checks the extinguishers and the ramp widths and signs a form.
Nobody checks whether people can find their way.
So it goes unmeasured — and unmeasured problems don't get fixed. Everyone has stood in a corridor turning a sign over in their head, and nobody has ever written it down as a number.
WayTrace writes it down.
What it does
One ceiling camera. It watches people walk, and it looks for two things.
Hesitation — someone slows below 0.30 m/s, stays slow for at least 2 seconds, and goes nowhere. Not standing still. Stuck.
A U-turn — a heading reversal of 135° or more. The moment someone gives up and goes back.
Every position gets converted from pixels into real metres on the floor, using a homography. That matters more than it sounds: without it, a stop near the camera looks bigger than a stop down the hall, and your map lies to you.
Where those events pile up, you get a hotspot — half a metre square of floor with a number on it.
Across 25 walks, it found 21 events — 12 hesitations, 9 U-turns — in 4 hotspots.
The finding
Here's the part I didn't expect.
The shoot log recorded where each person had been told to go — and it recorded it the night we filmed, months before a single line of detector code existed. Three groups, sorted purely by whether the sign helped you:
| Where they were going | On the sign? | Walks | Events per walk |
|---|---|---|---|
| Gate A–C | yes | 8 | 0.12 |
| Exit, baggage claim | yes, but the arrows are ambiguous | 8 | 1.00 |
| Toilets, lounge | not on it at all | 9 | 1.33 |
Put a destination on the sign, and people walk. Leave it off, and they stop — 10.66 times more often, per walk.
That isn't a location. It's a cause. The corridor's sign lists three destinations; two more exist and aren't on it, and the people looking for those two are exactly the ones who slow down. The fix costs a sign printer twenty minutes.
And you can check me. Run python3 src/difficulty.py — it reads shoot_log.xlsx and results.json and writes data/output/difficulty.json. Inputs and output are all committed. Not one number in that table was typed by hand.
Why this isn't cherry-picking: the labels were written before there was anything to cherry-pick from. No detector existed. Nobody could have tuned toward this result, including me.
Where it's weak, plainly: nine walks in the MISSING group. That's a direction, not a p-value. Some of those events are scored as false positives by my own validation. And four clips produced zero events and were never re-checked for misses — one of them holds an EASY walk, so 0.12 is a floor, not a fact.
Accuracy — measured once, on data I never touched
Before building anything, I split the 25 walks into odd and even. Odd trips tuned the thresholds. Even trips were sealed. The scoring script was committed before it was ever run. Then it was run once.
| Precision | Recall | F1 | |
|---|---|---|---|
| Hesitation | 83% | 71% | 77% |
| U-turn | 0% | 0% | 0% |
| Combined | 62% | 56% | 59% |
Read the middle row again. My U-turn detector scored zero.
Two U-turns were in the held-out set. It missed both, for the same reason each time: the speed gate ignores a turn made by someone who has already stopped moving, which is, of course, exactly how a confused person turns around.
Here's the part I'm proud of. I wrote that failure down six days before I opened the held-out data. I predicted the mechanism, then watched it happen on trips the detector had never seen. A predicted failure confirmed on unseen data isn't weakness — it's the only proof that you understand your own system.
The combined 59% hides that zero completely. That's why the dashboard shows the split, and why the video says it out loud instead of quoting one flattering average.
Three of the five thresholds were written blind, from definitions, before any data was seen — and a parameter sweep couldn't improve them. Two were tuned on odd trips only. "All thresholds were written blind" would have been a much nicer sentence, and it would have been false.
Privacy — an edge sensor, not a cloud service
There's a line running through the middle of this system, and it's the most important thing in the architecture.
Above the line, video is required: frame rate conversion, lens undistortion, YOLO detection, ByteTrack tracking, homography.
Below the line, nothing ever opens a video again. What survives is a file of numbered tracks and floor coordinates. No faces. No crops. No names. A person has become an integer and a list of positions.
Delete every clip on the machine and every figure on that dashboard still reproduces. That's not a promise, it's a property.
Search the source for requests, urllib, or any HTTP call, and you get nothing. The only matches for "upload" are a local file picker and a folder on disk. No account, no tenant, no endpoint. It runs where the camera is.
A face-blurring tool is in the repo and verified to leave zero uncovered frames. I didn't apply it, because consent exists — every participant agreed to public release, and the one minor's parent agreed on her behalf. The tool stays as the answer for footage where consent doesn't.
How it's built
- Camera: one fixed EZVIZ ceiling unit. Calibrated over 40 views.
- Calibration quality — honestly: RMS reprojection error 2.17 px, where a good calibration is under 1. That's roughly 0.9 cm of error near the camera and 3.5 cm at the far end. Fine for half-metre hotspots. Not fine for anything finer.
- Pipeline: ffmpeg (CFR) →
undistort_video.py→ YOLO11m + ByteTrack → homography → hesitation and U-turn detectors → hotspot clustering → Streamlit. - Data: 13 clips, 25 labelled walks, hand-labelled blind before any detector ran.
- Speed: 0.549 s/frame on CPU — about 8× slower than realtime. This is an audit tool that runs overnight, not a live feed.
- Dashboard: local Streamlit. No external HTTP call anywhere, including for fonts.
Clip 4 is excluded. Thirteen clips were shot; twelve produced usable walks. Clip 4 was logged as wasted on the night of the shoot, before any labelling — and it happens to contain two U-turns, my detector's weakest case. Bringing it back now would be choosing data after seeing the result, so it stays out. I'd rather explain the gap than quietly close it.
Every number on the dashboard is parsed from a committed file. None is typed in.
What went wrong
The crashes were never the problem. The silences were.
A 257-byte output file that printed "Saved to" and exited with code 0. A Streamlit server still serving old imports twenty minutes after the file changed. A checking script with a hardcoded path, reporting confidently on entirely the wrong video. A .csv that was secretly an .xlsx — the first two bytes were PK, which is a zip, which is what an Office file is.
Every one of those succeeded. That's what made them dangerous.
And then the demo clip betrayed me.
The video opens on two stops, nine seconds apart, three centimetres apart on the floor. Beautiful shot. Then I checked my own validation file and found that the first of those two stops is scored as a false positive. There is no ground-truth label at 15.6 seconds.
I went back and watched the footage frame by frame. The stop is unmistakably there. The detector was right, and my label was missing.
I did not add the label. By then I'd already seen what the detector said, and a ground truth you edit after reading the answers isn't a ground truth — it's a wish. Adding it would have lifted precision from 62% to about 71%, and made every number in this writeup worthless, starting with the ones I'd have been proudest of.
The score stays 59%. The video says so on camera, over the shot.
What it does earn me is one honest line: 62% precision is a floor, not a ceiling. Some of what's counted against my detector may be a tired human missing something at midnight.
What I learned
- A commit message is a claim. The diff is the evidence. I found two commits whose messages had outrun their contents.
- A check that cannot fail is not a check. A pass only means something if failing was possible.
- The untested path is the broken one. Twice, a day ended with a bug on the exact code path nobody had run.
- Pre-registration is nearly free and worth more than any clever analysis afterwards. Splitting odd/even before writing a detector, and labelling destinations on shoot night, are the entire reason the two strongest claims here can't be waved away.
- Say the weak number in the same breath as the strong one. Not because it's noble. Because a judge who finds it themselves stops believing the rest.
What's next
- Fix the U-turn speed gate. I know exactly what's wrong with it. But fixing it after seeing the held-out result would contaminate the only clean evidence I have — so it gets fixed, then validated on new footage, in that order.
- Audit a corridor twice. Before the sign changes and after. WayTrace's real value isn't the first measurement; it's proving the fix worked.
- More cameras, which means a homography per camera and a shared floor frame.
Try it
Code: github.com/abrishk2012/waytrace-audit
It clones and runs. The repo includes docs/limitations.md, the full held-out miss analysis in data/misses_day15.txt, and the architecture diagram. Every figure in this writeup is reproducible from a committed file.
Built solo. I'm 14.


Log in or sign up for Devpost to join the conversation.