-
-
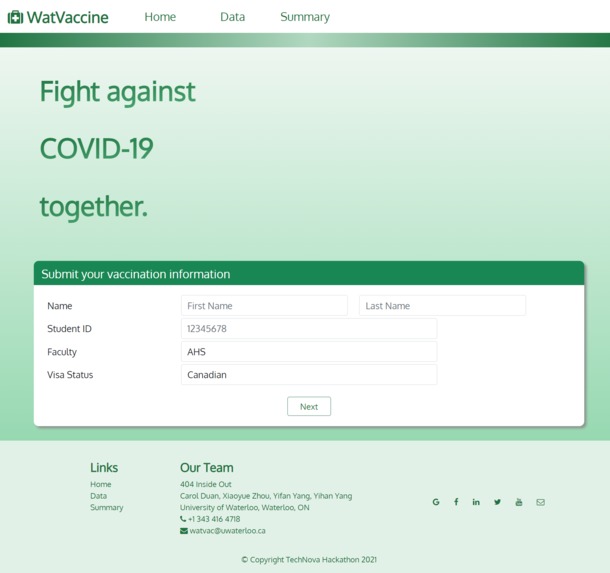
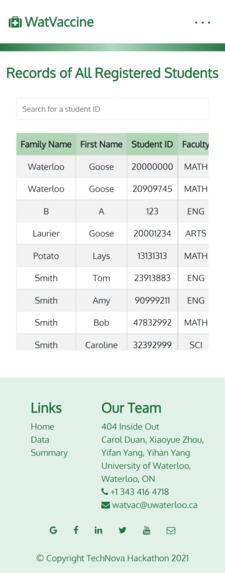
1. Homepage
-
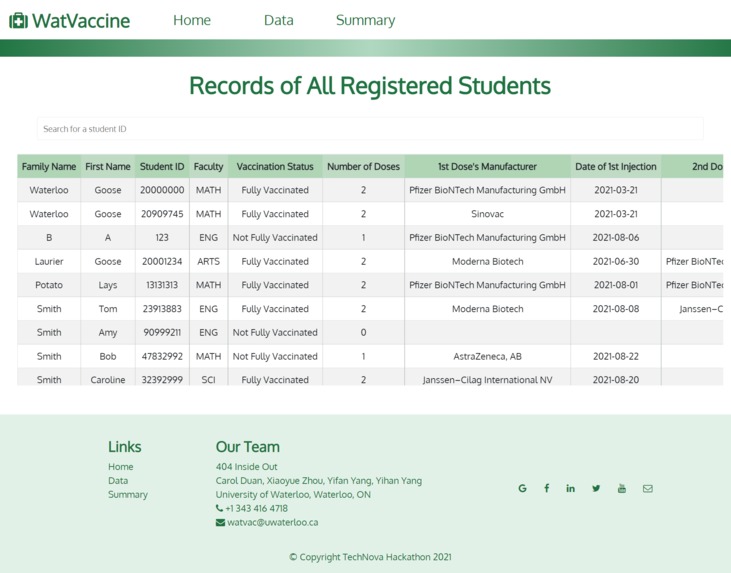
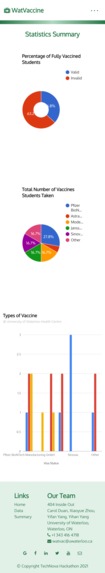
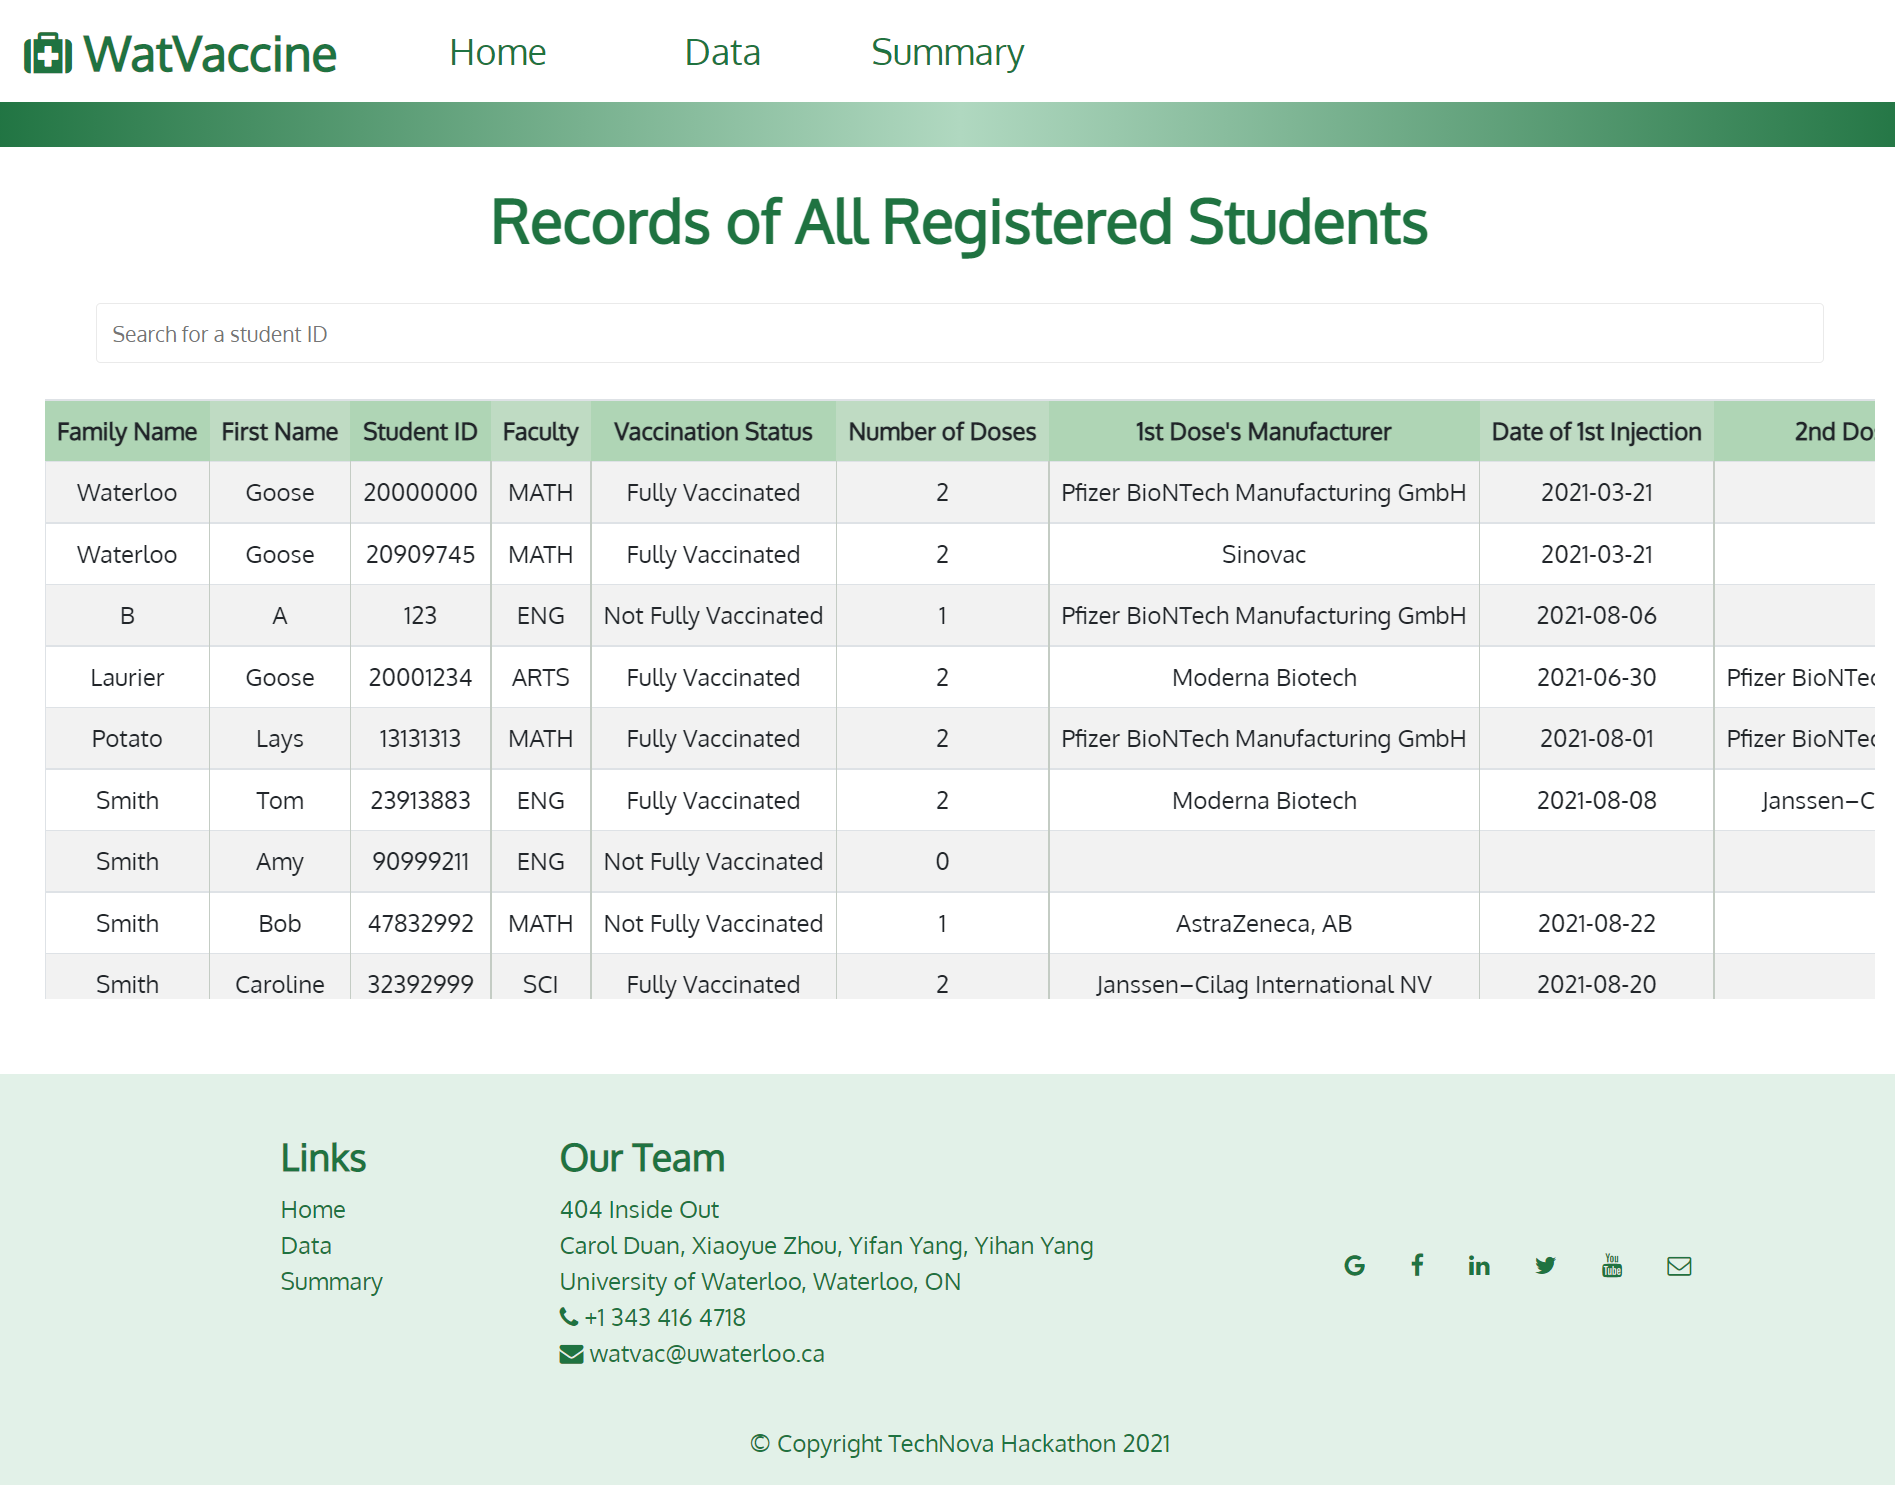
2. Data Page
-
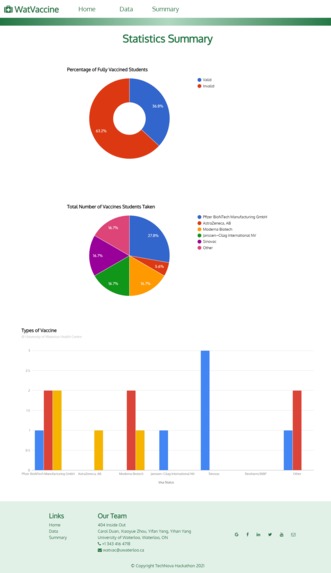
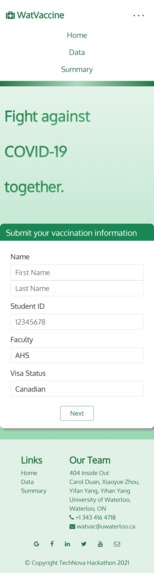
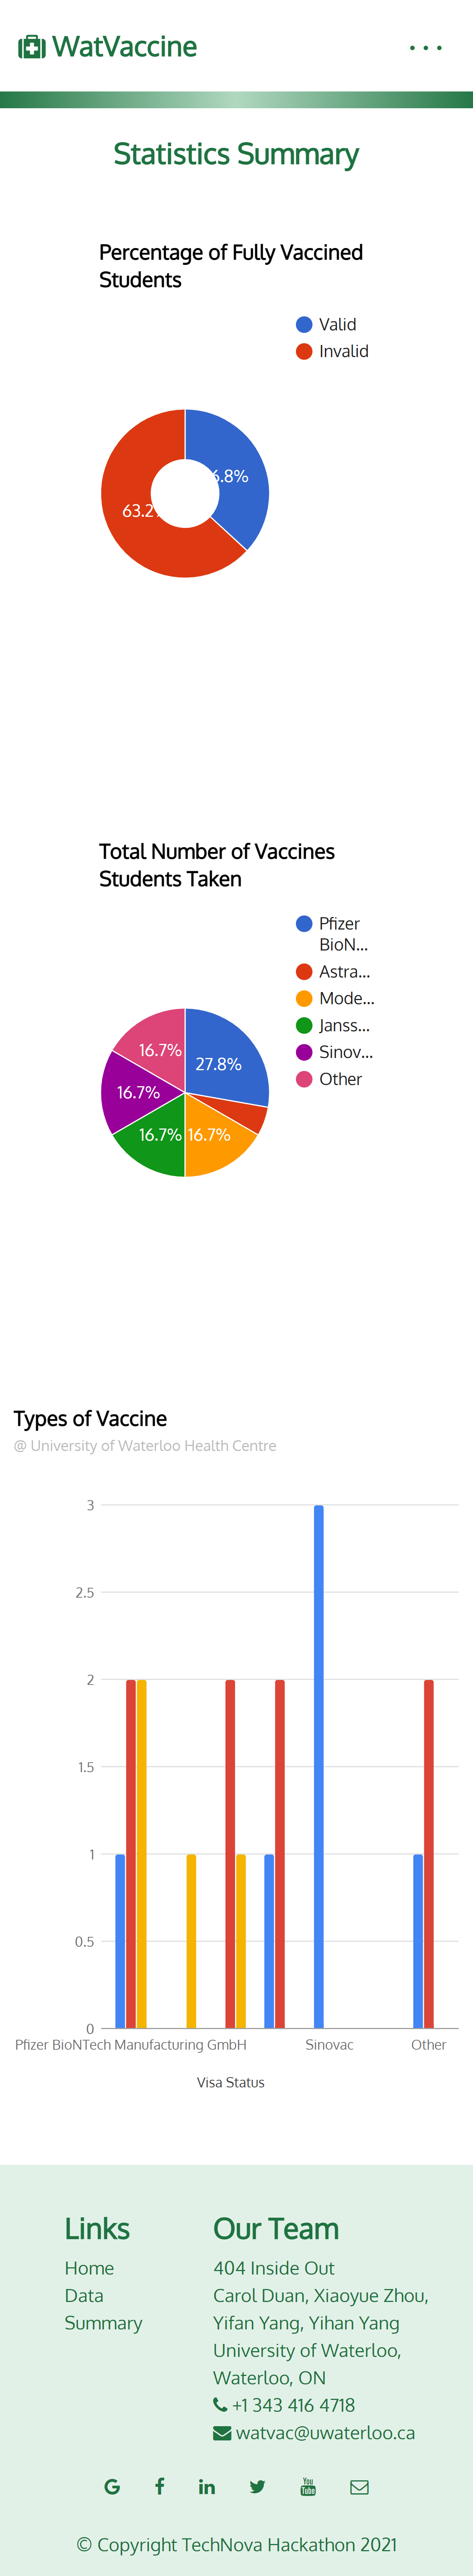
3. Summary Page
-
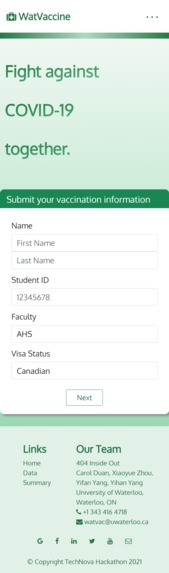
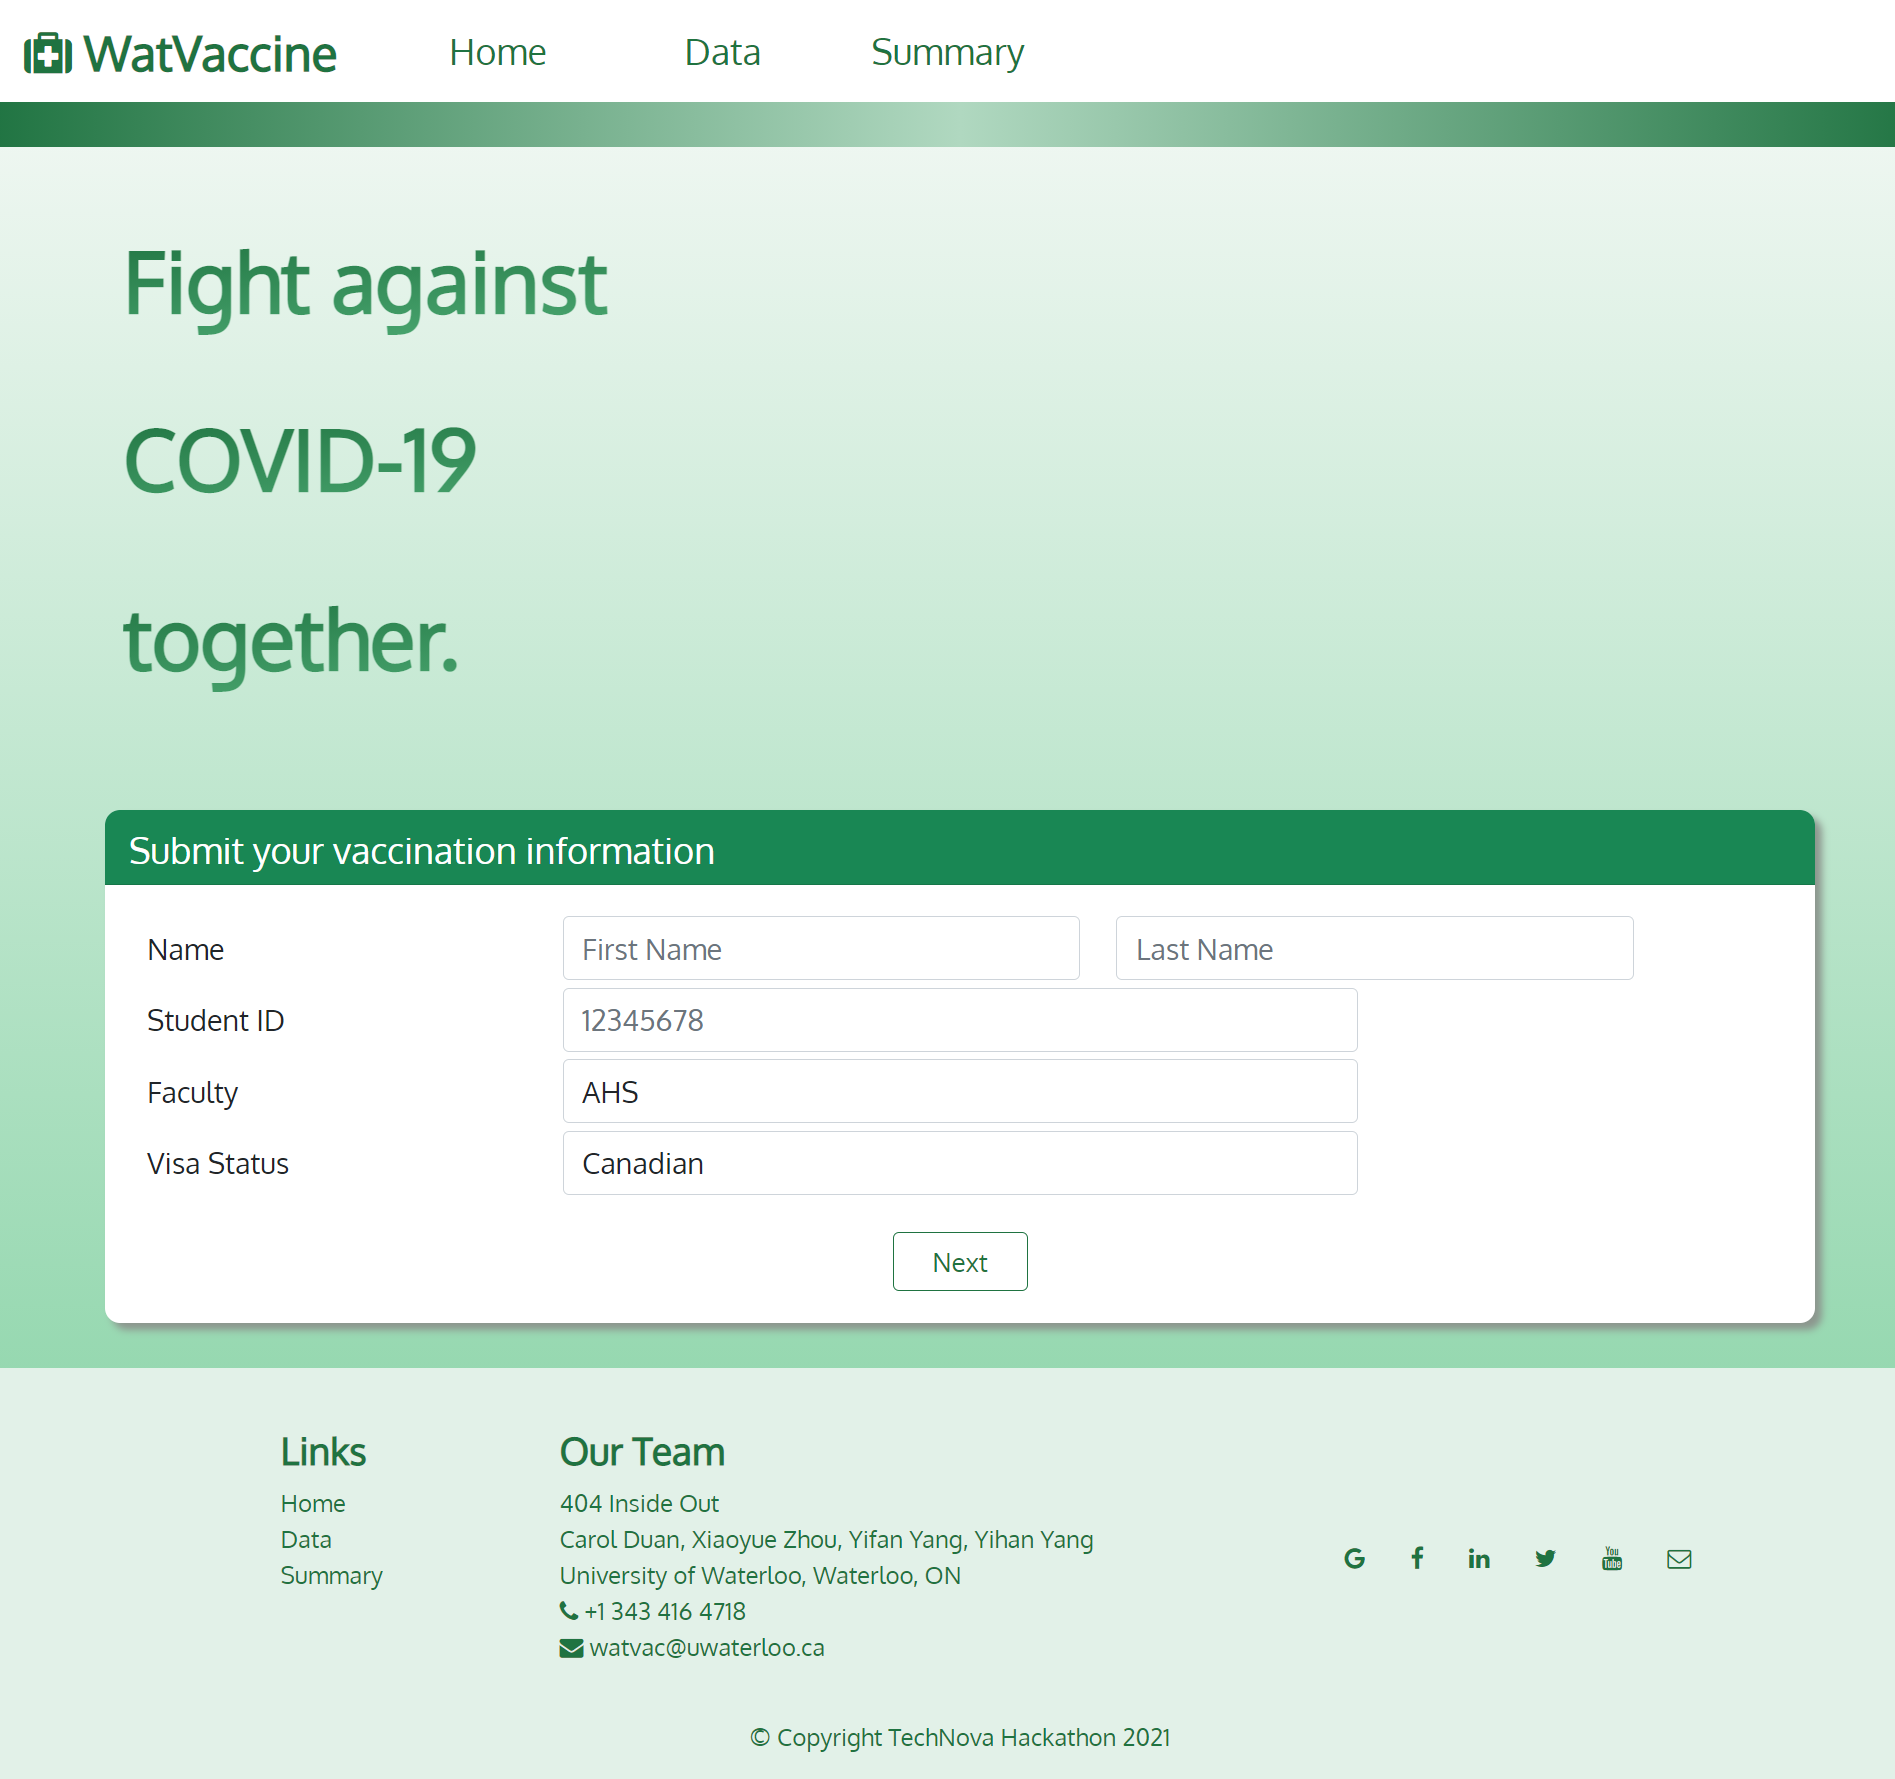
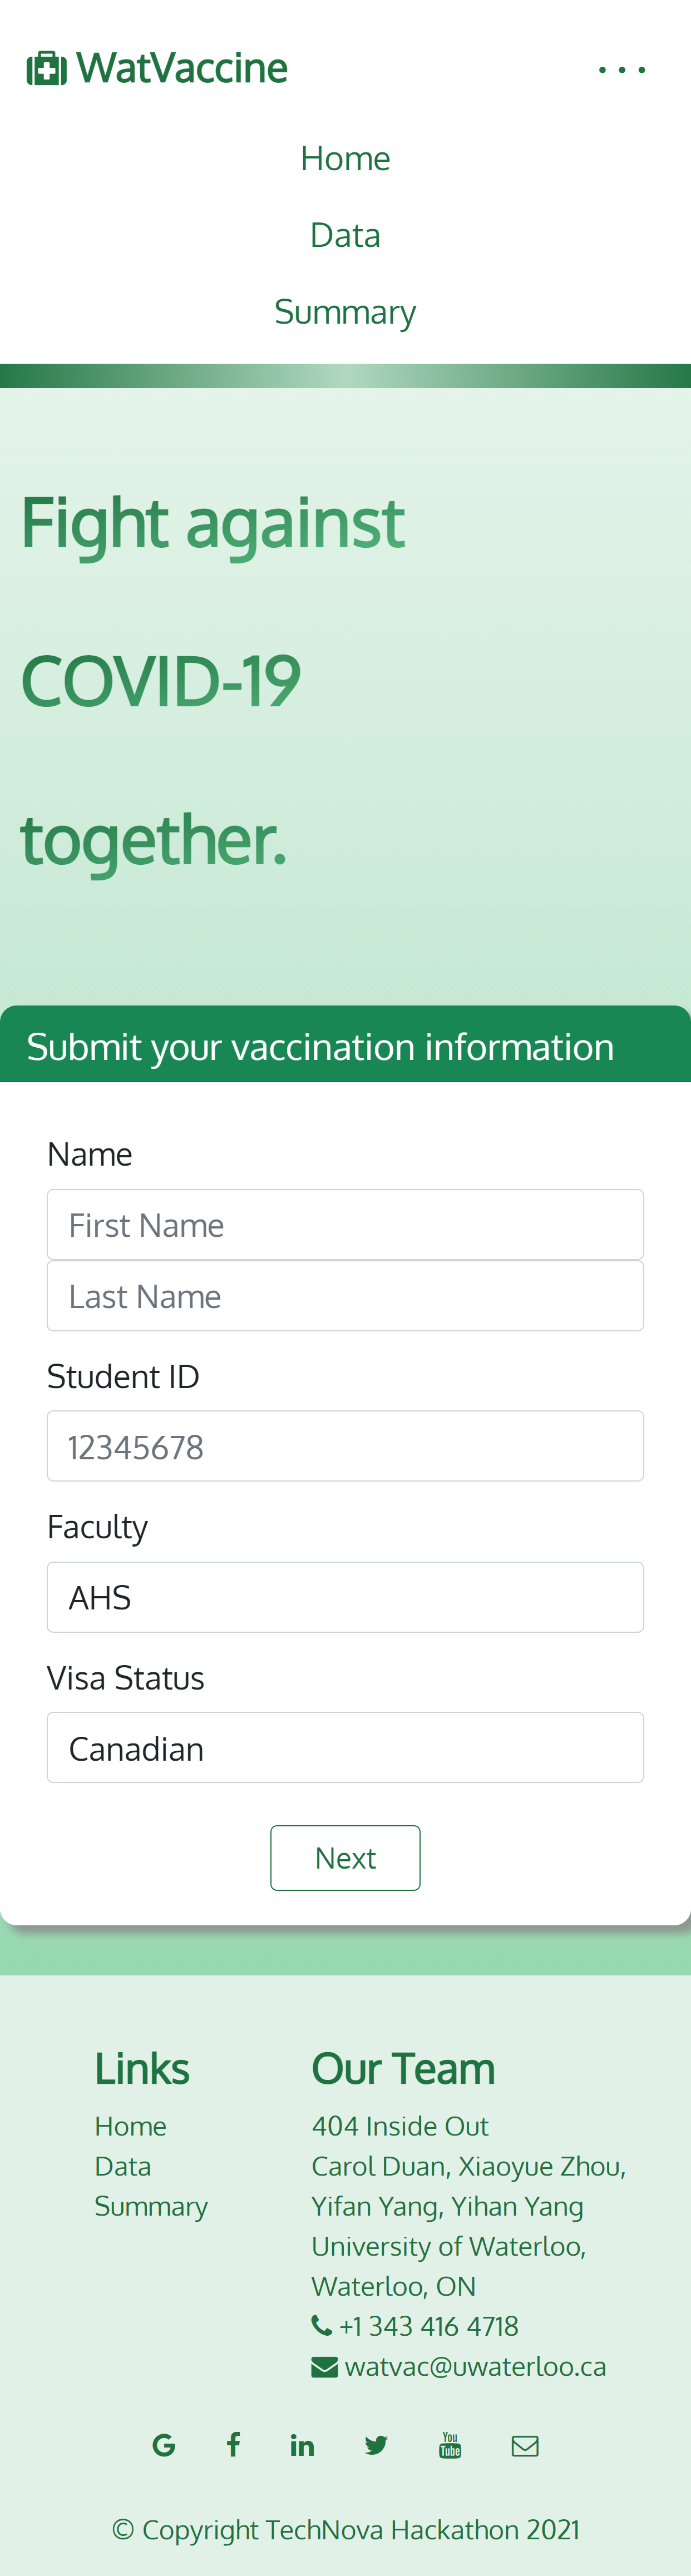
4. Homepage - Mobile
-
5. Data Page - Mobile
-
6. Summary Page - Mobile
-
7. Mobile Navigation Menu


Inspiration
As the covid-19 pandemic situation is being more stabilized, the majority of university students are returning to campus to start their Fall Term studies. As Waterloo undergraduates, we are particularly interested in how UWaterloo is handling this large amount of incoming students. Since Waterloo students come from all around the world, their vaccination status differs a lot. Some might have received vaccination approved by the University of Waterloo either in Canada or in their own countries, but some might have received vaccination not approved by UWaterloo but by their country, and some might have not been vaccinated at all.
What it does
To ensure students’ safety on campus, we built a website for incoming uwaterloo students to submit their vaccination information, and record this info to keep track of their vaccination status. Specifically, incoming students will be required to fill out their personal and vaccination information on the homepage. Then, their information will be recorded in the database. Management Staff can view the information of all students’ records and search for a certain student by ID via Table page where a table of all incoming students’ information is displayed and updated as students submit their information. A summary webpage will be generated correspondingly, showing a graphic overview of general statistical information about all students that have registered in the system.
How we built it
We built our website using html, css, and javascript. We store students’ data in a .json file. We created three javascript files and their corresponding html files to display the three web pages we created:
- index.html (for inputting students’ information, also builds the home page)
- table.html (for displaying a table of students’ information and supports searching for a particular students’ info)
- summary.html (for generating graphs that investigate the proportion of students receiving each type of vaccine and the proportion of fully vaccinated and not vaccinated; for generating a bar graph that shows the amount of students that receives a certain vaccine with a particular visa status)
We used style.css and index.css to design the style of our html. The font we used is Oxygen, which is provided by Google Fonts. Because green often gives us a feeling of sanity, and it makes people think about medical treatments, vaccines, etc, so we chose green as the theme colour of our webpage.
There is a navigation bar on the top, which contains buttons that link to other pages. There is also a footer, which contains our contact information, and there are also links to other pages like Twitter, Google, etc. There are links to the home page, data page and summary page in the footer as well. The structure for the navigation bar is implemented in navbar.html, and the structure for the footer is implemented in footer.html.
For the Homepage (implemented using index.html and index.js), we used JQuery methods to add responses to different actions imposed on the webpage, such as clicking certain buttons and inputting data. The feedback information for each input in the form is triggered dynamically by determining if the field is empty or invalid.
For the Table page, we used DOM manipulation to create the table. The search bar supports search by student ID. We selected the students whose ID has some parts corresponding to our input in the search bar using the filter function.
The graphs on the Summary Page was built with the help of Google Charts API. We apply fetch APIs to request data from the JSON server, and display the data in a graph after processing them properly.
Challenges we ran into
One of the challenges is letting our webpage be neatly displayed in windows of all sizes. To achieve this, we let the font size of certain text and the size of some patterns decrease, and we also let the navigation bar collapse into a button on the top right corner. Mobile device users can navigate throughout pages by clicking on that button, and then a menu of navigation buttons will appear. In the Data page, the table is too wide for mobile devices, so we added a horizontal scroll bar to make it easier to view the table. There is also a vertical scroll bar for the table to be displayed fully when the height of the table becomes large. In the Summary page, scroll bars are also added for users of all devices to conveniently view the graphs.
In table.js, we ran into trouble when dealing with callback function. This happens to be a serious problem when we need the data from the last step to complete the later calculations. However, since we are using an asynchronous function to fetch our data, things behave very differently as expected. When we are calling that async function to fetch data from the backend, the next line of code is already executed before finishing the previous line. Thus, we can only use the data inside the callback function. Similarly, the JavaScript forEach function also leads to a lot of trouble for us, which was solved using callback functions as well.
Accomplishments that we're proud of
We are proud that the display of our webpage is themed and clear. It is also functional and easy to use. Students are led to complete their information by clear instructions. The management staff can successfully search for the information they want, and they could look at the big picture of the collected information via statistical summaries generated from the data.
Also, our design of the webpage can fit very well with all screen sizes. It can be easily used and viewed on all devices.
What we learned
We’ve learnt to divide the work according to each person’s skills and capabilities, which makes more effective teamwork. We learnt to work concurrently, just like asynchronous programming.
We also learnt some programming skills as we are doing this project. Some learnt to create tables using javascript and html and some useful methods for filtering out information; some became more skilled at css styling.
Though we finally failed to deploy the website to Heroku due to the host issue, we happened to learn a lot about deploying a Node.JS project. When we tried to run the project on Heroku, the command npm start is automatically executed, so it is required to add several modules in both devDependencies and dependencies parts such as npm-run-all and node-scss which supports the deployment. However, by default, the JSON server starts at port 5000, which seems invalid when it comes to the online environment, and we still failed to solve it.
What's next for WatVaccine
WatVaccine does not have to be used exclusively by UWaterloo, other universities and different institutions may also use this design to record their staff’s vaccination information.
In addition, new features can be added to support more powerful functionality. Some examples are:
- The website could ask for student’s university emails, and send reminders to students who have not yet been vaccinated according to the university’s policies.
- We could add a webpage displaying the latest the university’s vaccination policies, so that students won’t have to go and search other websites for information.
- In the table webpage, we can add search by Last Name, search by vaccine manufacturer to allow more versatile searching. We could also sort the table by certain order.
- We could also add in a variate in our information that represents whether the student is planning to receive a certain type of vaccine and their expected date of injection to make sure everyone is taking action to protect their own and other people’s safety.
- Manually inputted information might be unauthentic. Hence, we could replace this manual step by prompting the user to scan and upload their vaccination proof. The uploaded picture will be scanned and automatically converted into digital information in the fill-in boxes.
- Implement the full backend side using a remote DB to store information.
- Implement the user system that displays the page differently for students and managers.


Log in or sign up for Devpost to join the conversation.