Inspiration
India has solved solar generation and inherited a sunset problem. Solar floods the grid at noon, then vanishes at dusk right when household demand peaks and coal plants ramp up. That means the same washing-machine load is a sun-powered load at 1:00 PM and a coal-powered load at 8:00 PM.
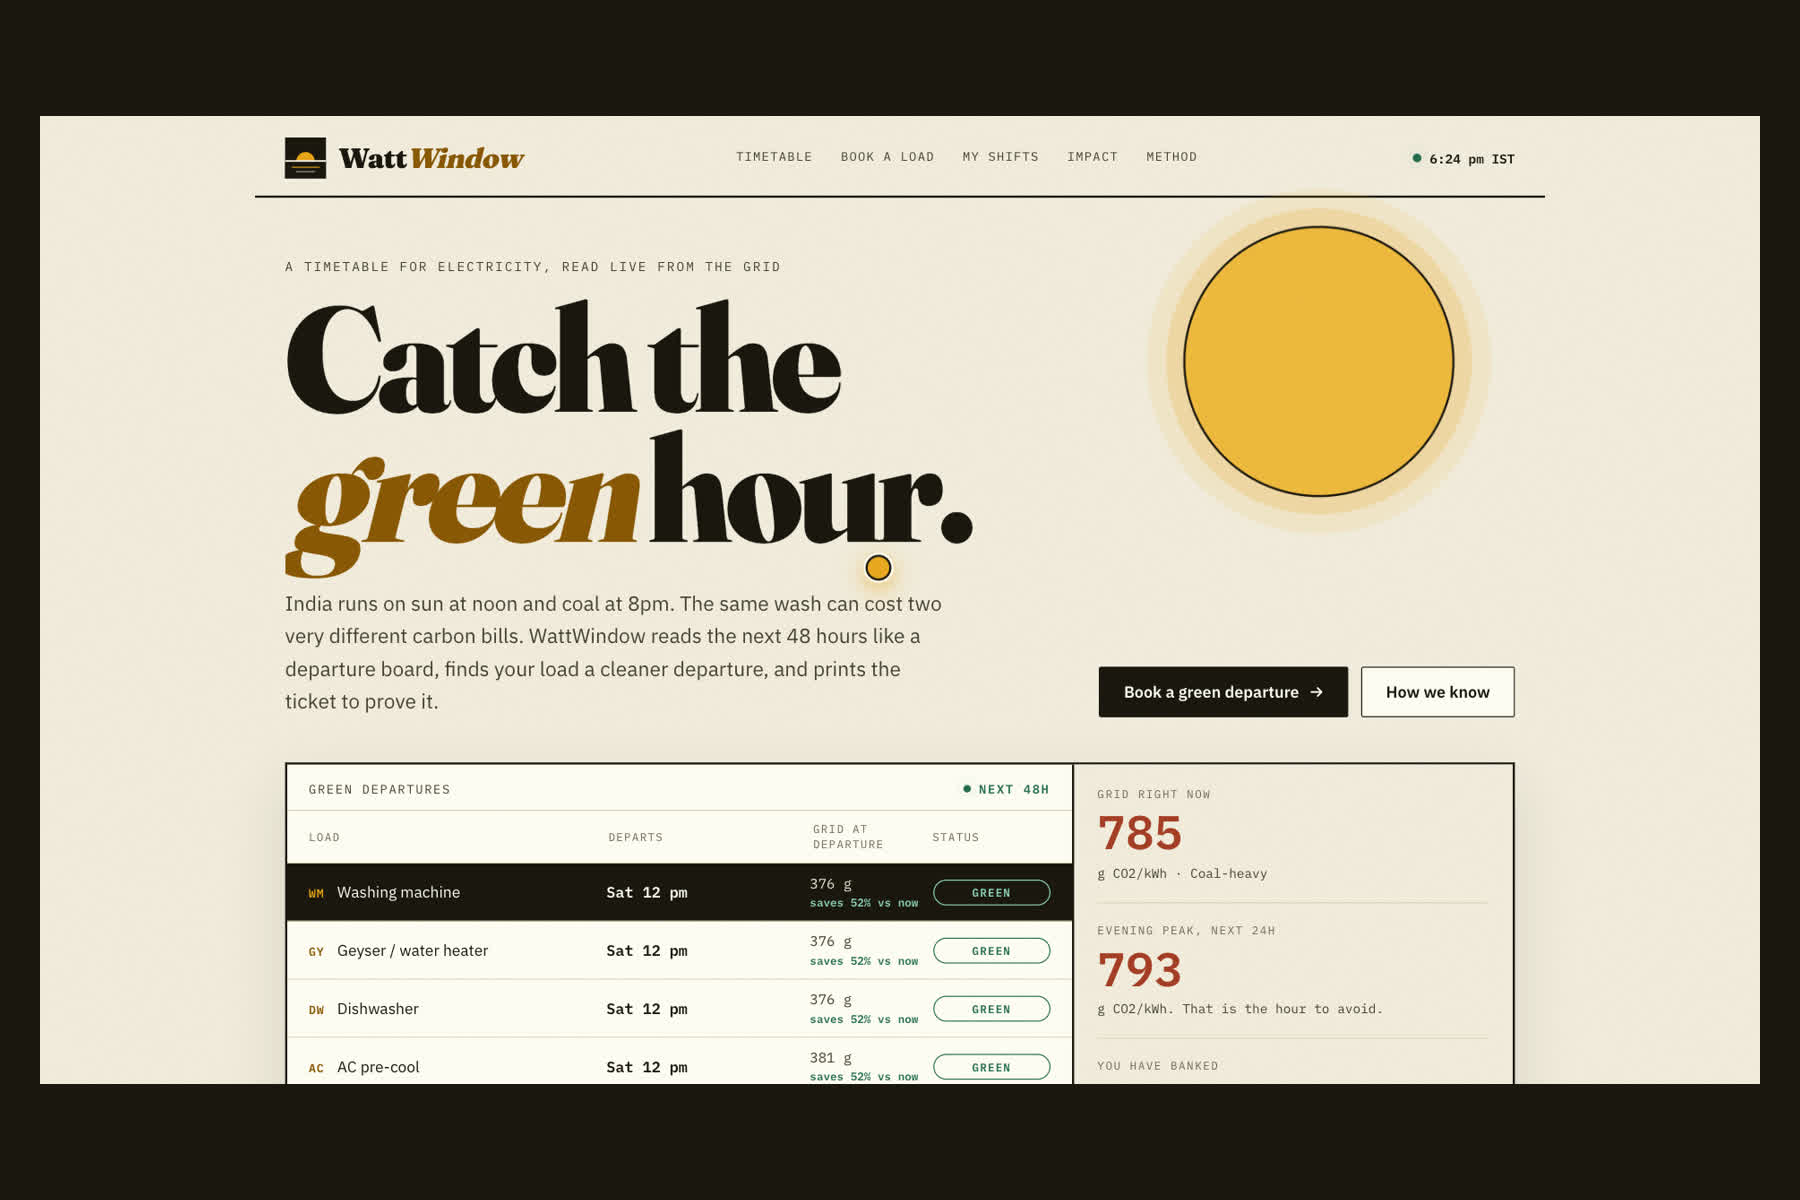
On live test days in Bengaluru, estimated grid intensity dropped to ~376–413 gCO₂/kWh at midday versus ~785–795 gCO₂/kWh in the evening—up to a 51% carbon cut on the exact same appliance from timing alone. I built WattWindow to make that invisible grid curve visible and turn it into one concrete daily decision: run it in this hour instead.
What it does
WattWindow reads the next 48 hours of electricity like a railway departure board:
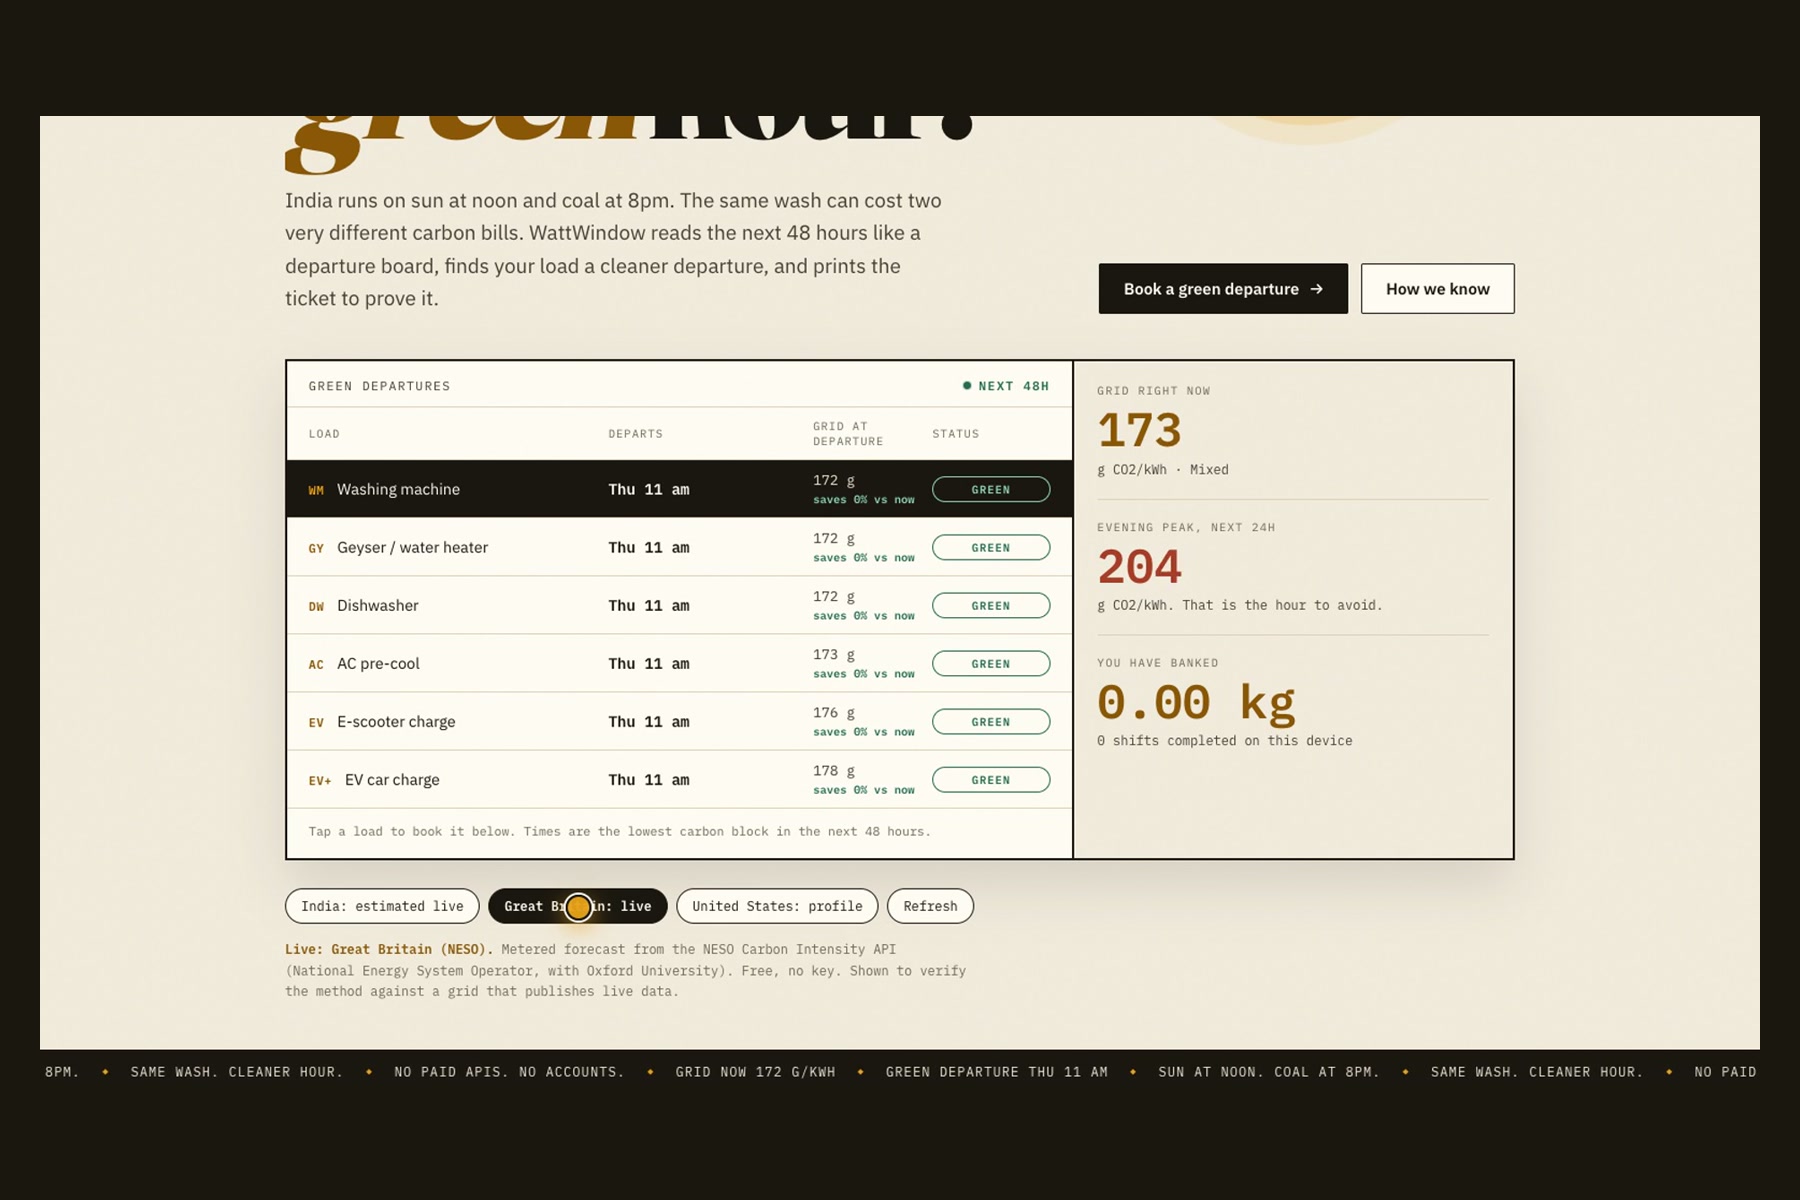
- Live Grid Departure Board: Shows current grid carbon intensity (
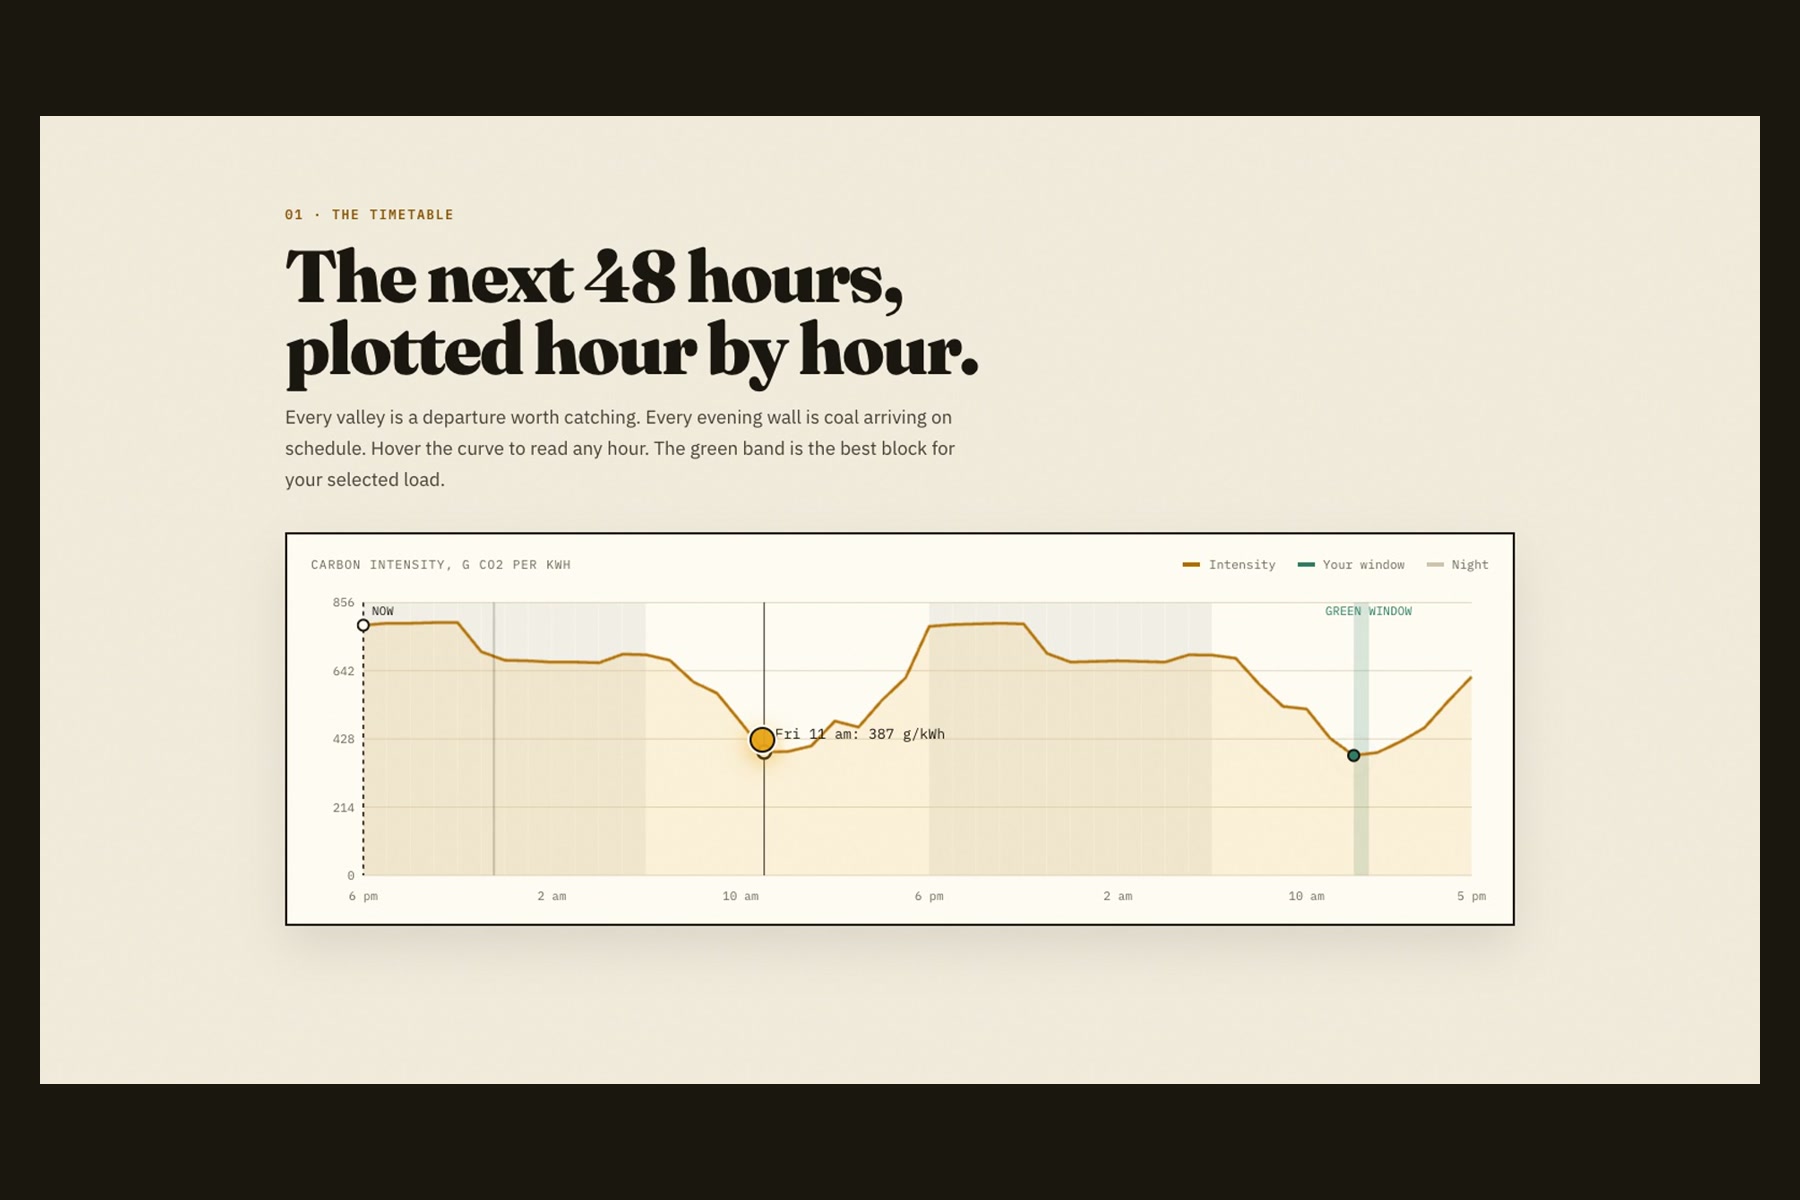
gCO₂/kWh), tonight's coal peak to avoid, and the cleanest upcoming departure window for 6 common flexible loads (washing machine, geyser/water heater, dishwasher, AC pre-cool, e-scooter, and EV home charge). - 48-Hour Carbon Dispatch Curve: Custom interactive SVG chart plotting hourly carbon intensity, day/night cycles, hover readouts, and your load's highlighted green window.
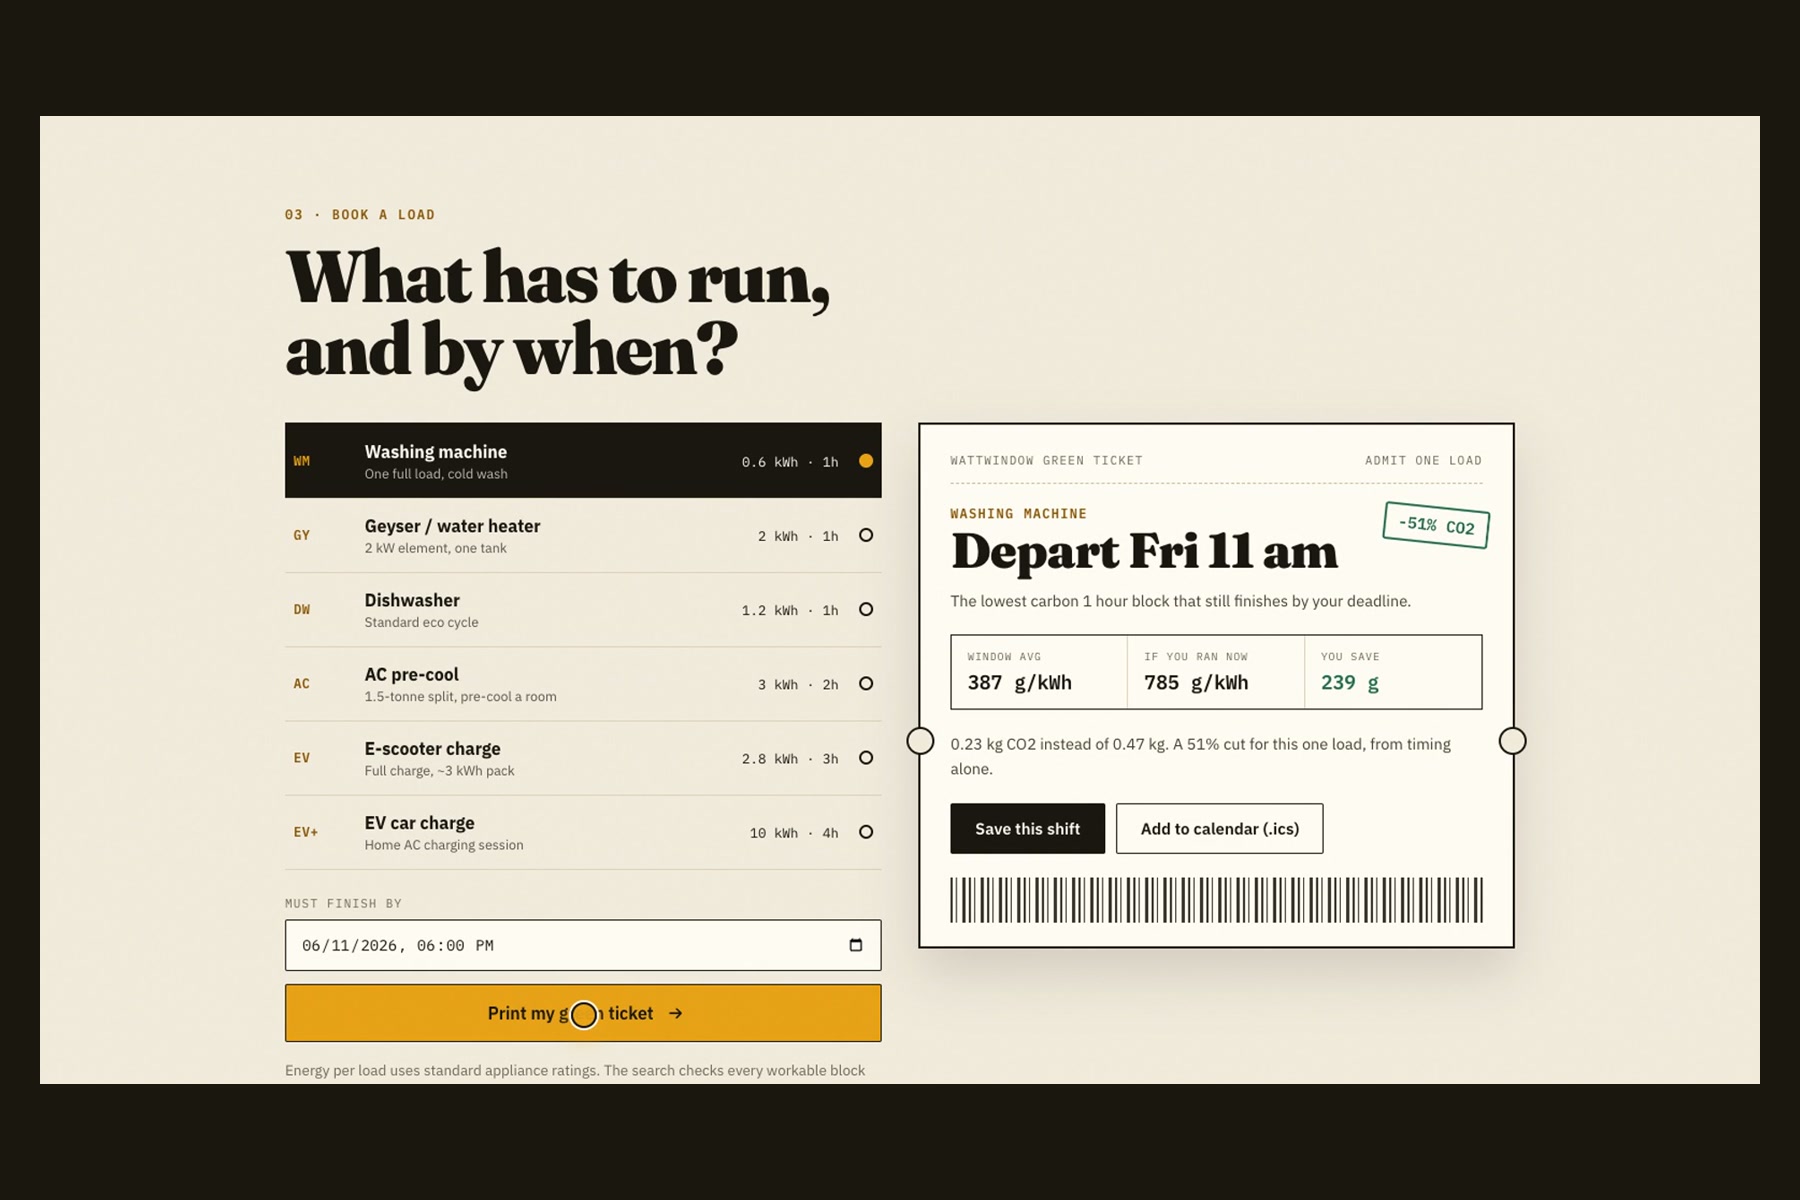
- Deadline Scheduler & Green Ticket: Pick what needs to run and when it must finish. A sliding-window search finds the lowest-carbon contiguous block before your deadline and prints a perforated Green Ticket showing
Window avgvsIf you ran nowand exact grams of CO₂ saved. - One-Click
.icsCalendar Alarm: Exports a standards-compliant.icsevent with a 10-minute reminder alarm directly to Apple/Google/Outlook Calendar—turning a suggestion into real behavior without needing a backend or account. - My Shifts & Campus Impact: Saves shifts in
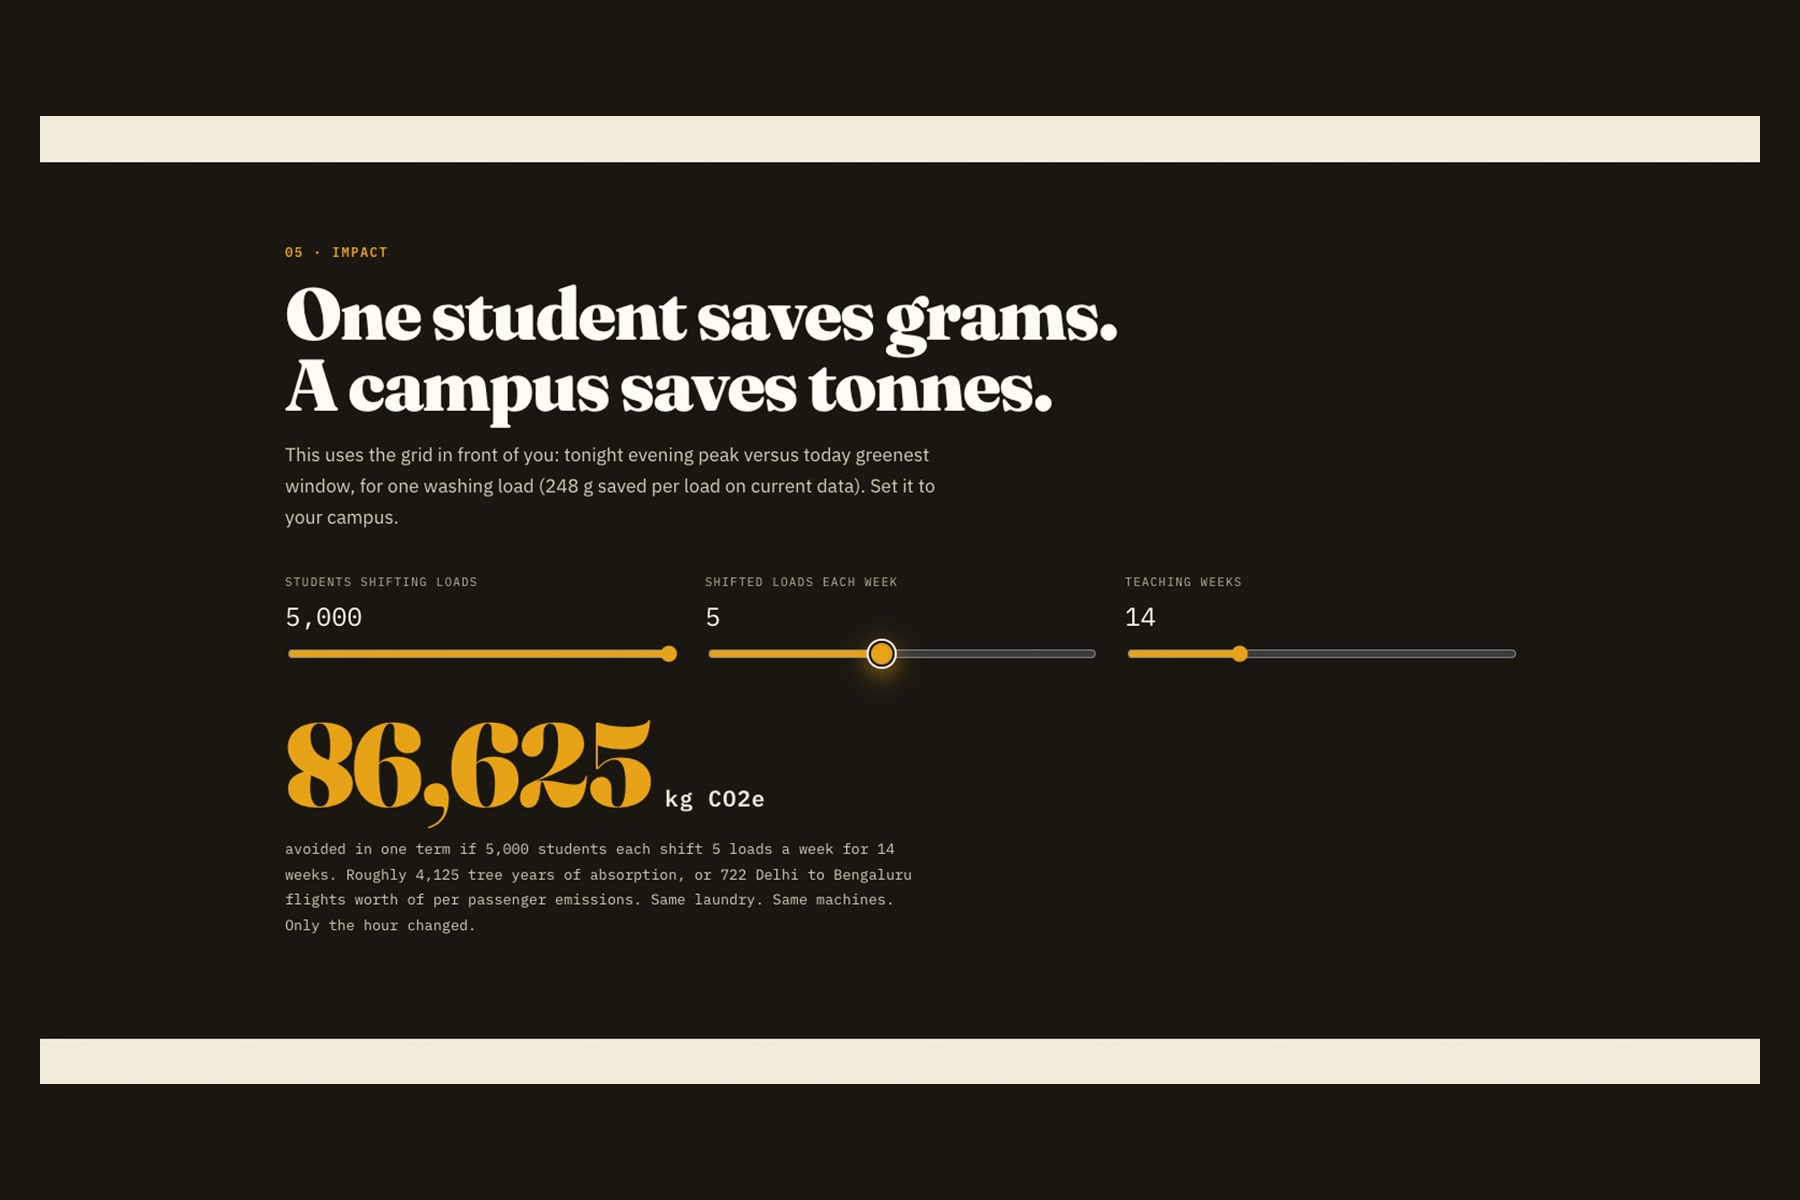
localStorageso you can tick off completed washes and bank saved kilograms of CO₂, plus an interactive Campus Impact calculator projecting term-wide tonnes avoided across a university hostel or campus.
How I built it
- Frontend & Design System: Vite + React 19 with a hand-written editorial CSS design system (
Fraunces,IBM Plex Sans,IBM Plex Mono) and a custom zero-dependency SVG dispatch chart. - India Grid Model (10 Cities): Pulls live 48-hour shortwave solar radiation and 10m wind forecasts from Open-Meteo (free, zero API keys) and anchors hourly intensity estimates to the official Central Electricity Authority (CEA) CO₂ Baseline Database v21.0 (
710 gCO₂/kWh, FY2024–25). - Live Metered Verification (Great Britain & US): Integrates Great Britain's metered live NESO Carbon Intensity API (National Energy System Operator + Oxford University) so anyone can verify the scheduler on a live metered grid in one click, alongside a US ZIP profile forecast built from EIA-930 hourly data via
emission-factors.com. - Zero Cost, Zero Accounts: All scheduling,
.icsgeneration, and shift tracking run 100% client-side at zero running cost.
Challenges I ran into
India publishes no open real-time carbon-intensity API—the central constraint of this project. Instead of faking metered telemetry, I anchored hourly weather-driven curves to the official CEA baseline and made data honesty a core UI feature: every Indian series is explicitly badged as an hourly estimate, US EIA-930 lag (~1 day) is rebuilt into an honest 7-day hour-of-day profile forecast rather than presented as live, and any network failure degrades gracefully to a clearly labelled sample curve.
Accomplishments that I'm proud of
- Cutting per-load carbon emissions by ~48–52% from timing alone, verified side-by-side against metered live GB grid data in the same interface.
- Zero friction for students: no sign-up wall, no API keys, and a one-click
.icsalarm that puts the green window straight onto your phone calendar. - Quantifying real scale: on live Bengaluru grid data (
~239–248 g CO₂saved per shifted wash), 500 students shifting 4 loads/week over a 14-week term avoid ~6.9 tonnes CO₂e—and 5,000 students shifting 5 loads/week avoid ~86.6 tonnes CO₂e per term (~722 Delhi-to-Bengaluru passenger flight equivalents) with zero new hardware.
What I learned
Timing is the cheapest clean energy available today. On solar-heavy, coal-peaking grids like India's, shifting when a flexible load runs often delivers a larger immediate emissions cut than buying a brand-new appliance.
What's next for WattWindow
- Regional Indian grid baselines using CEA's regional/state emission factors.
- Hostel and campus leaderboards so student dorms can compete on weekly shifted kilowatt-hours.
- Smart-plug and Wi-Fi geyser timer webhooks so booked green tickets can trigger appliances automatically when the clean window opens.
Built With
- css3
- html5
- javascript
- react
- rest-api
- vercel
- vite

