-
-
-
-
-
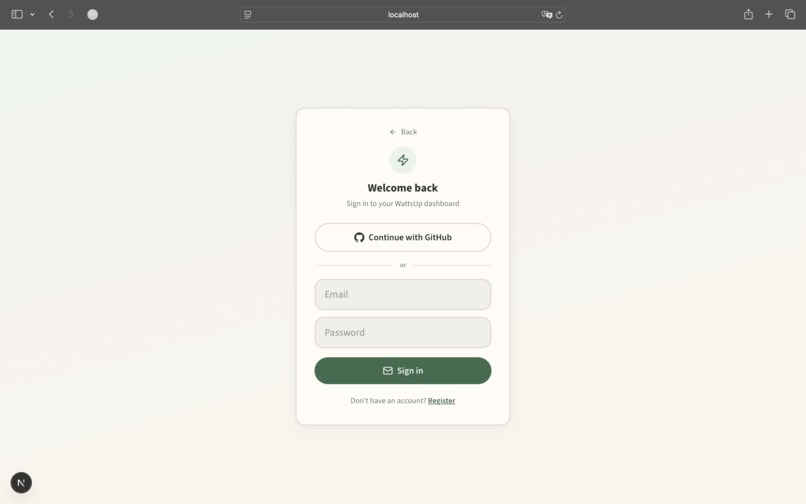
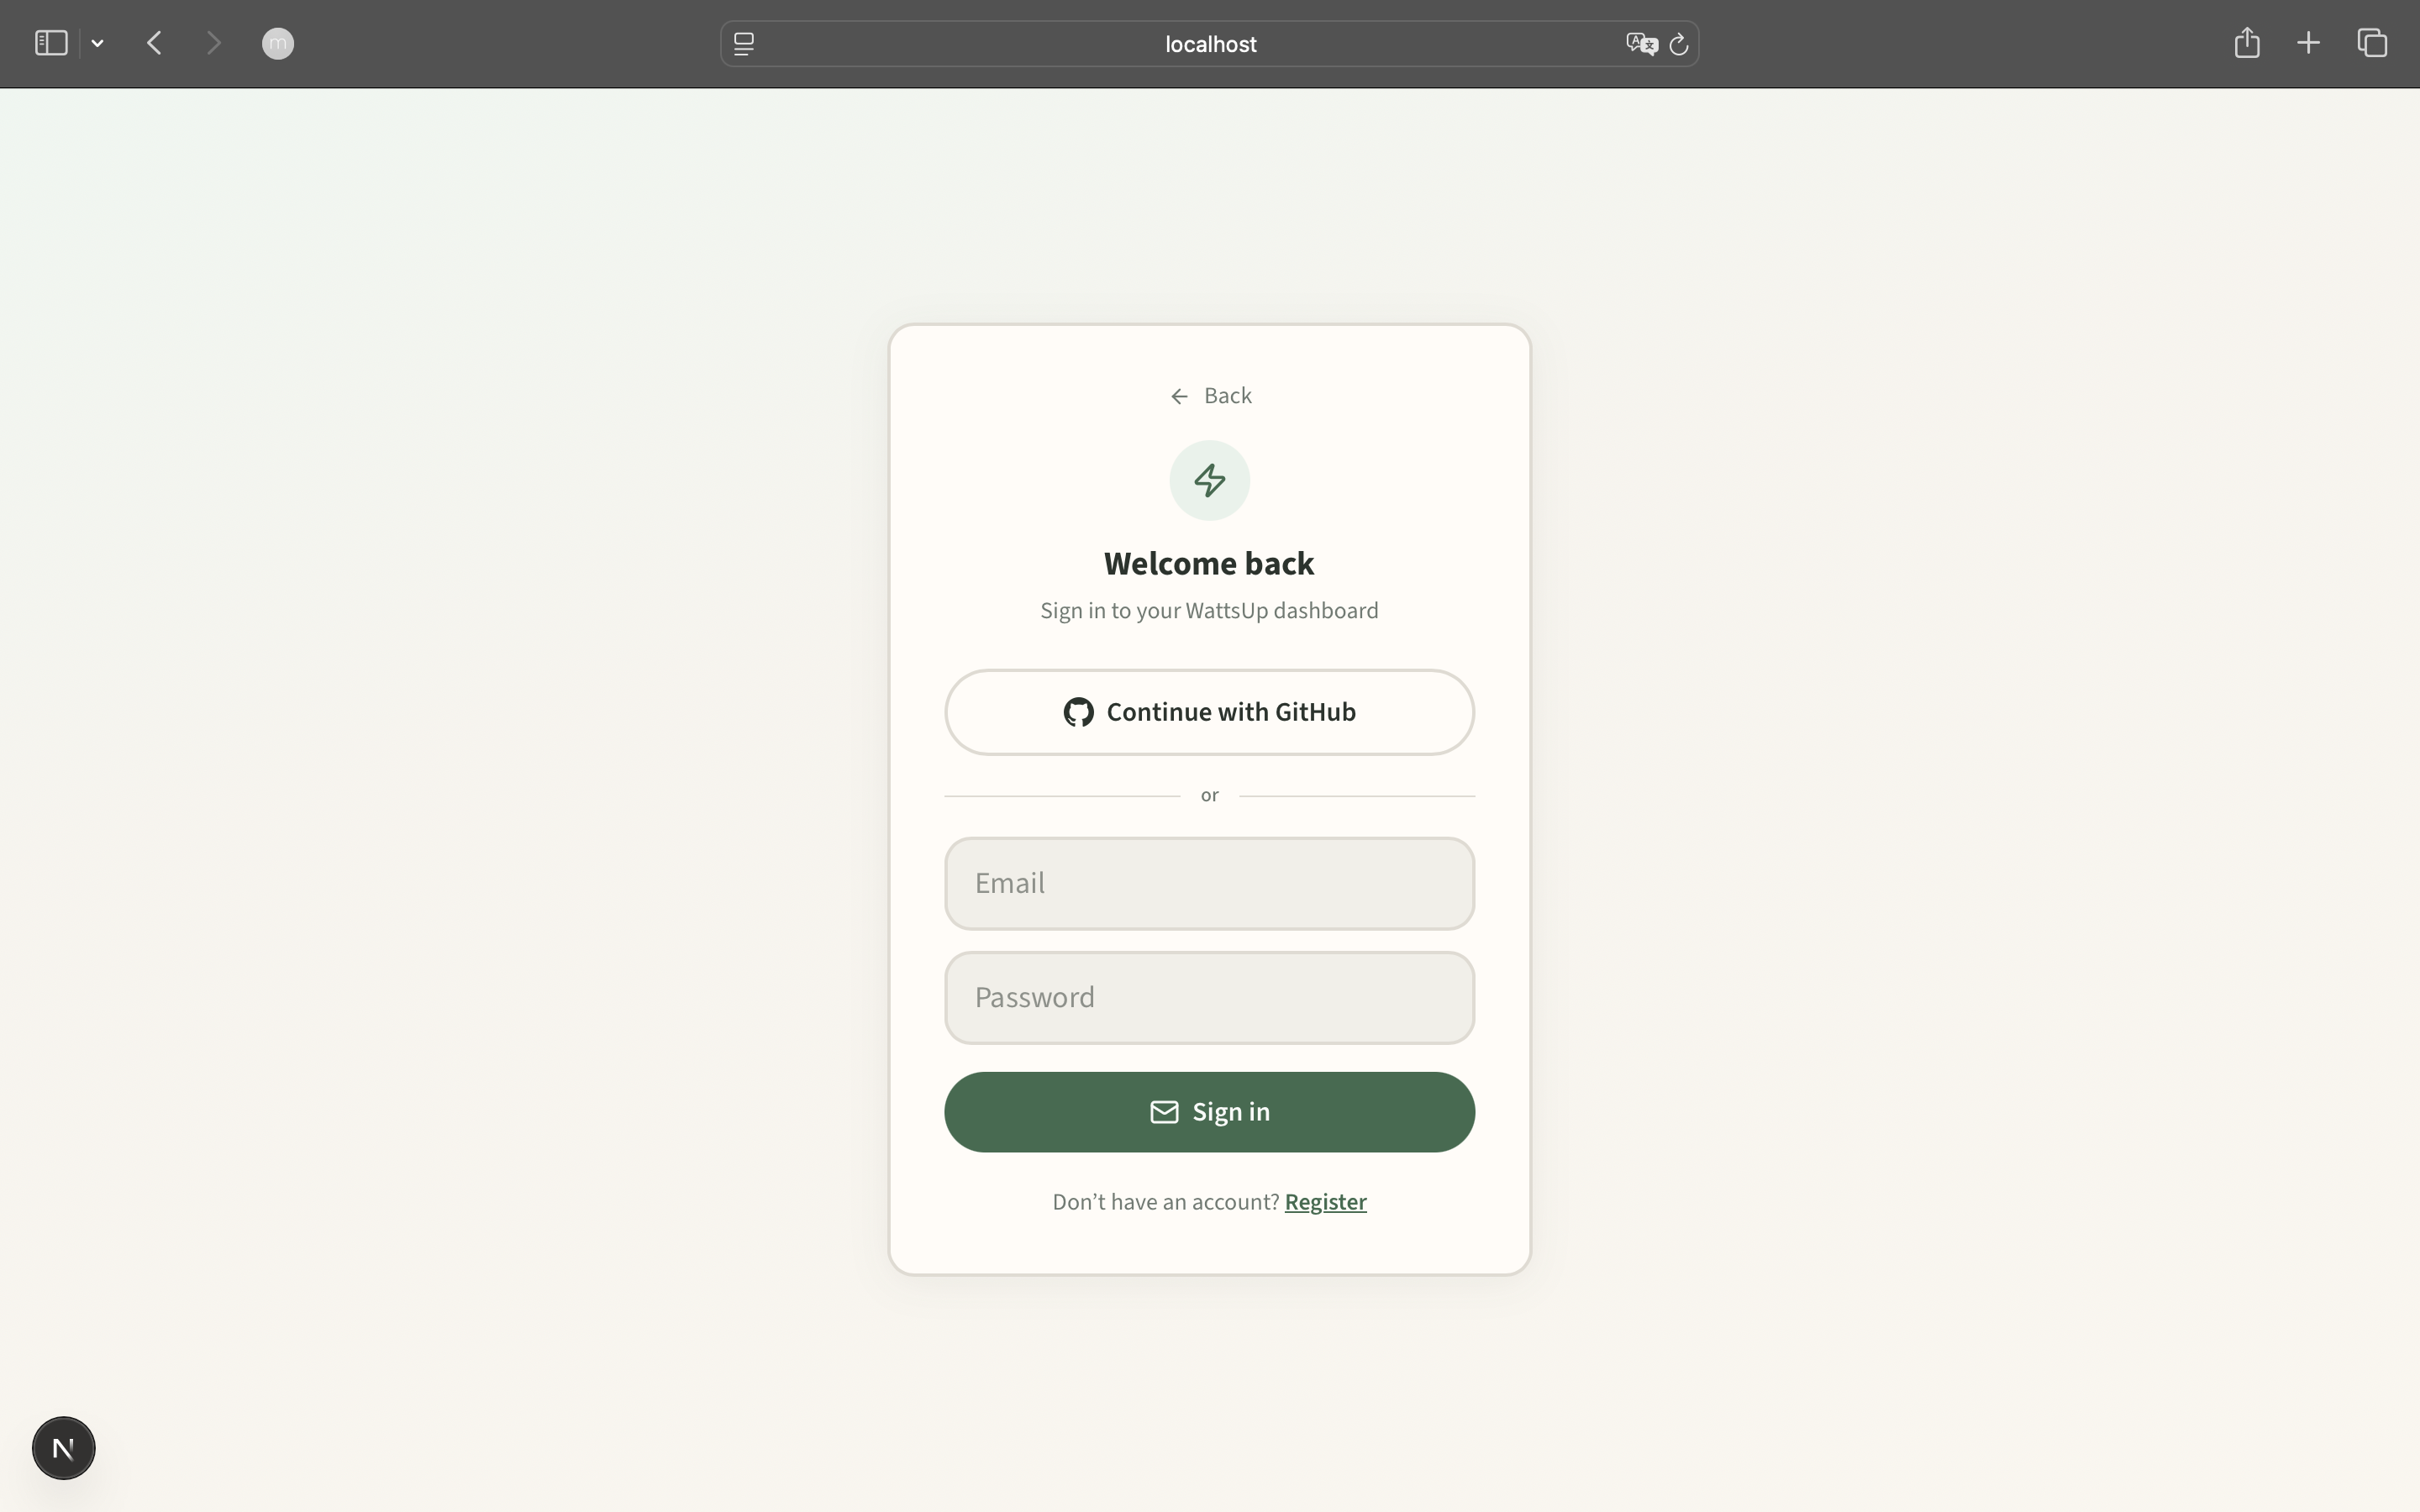
Sign in screen
-
-
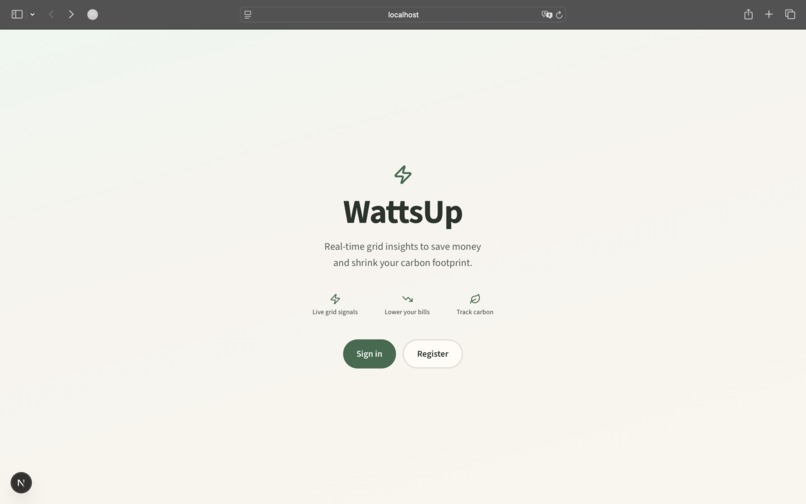
Landing screen prompt user to log in
-
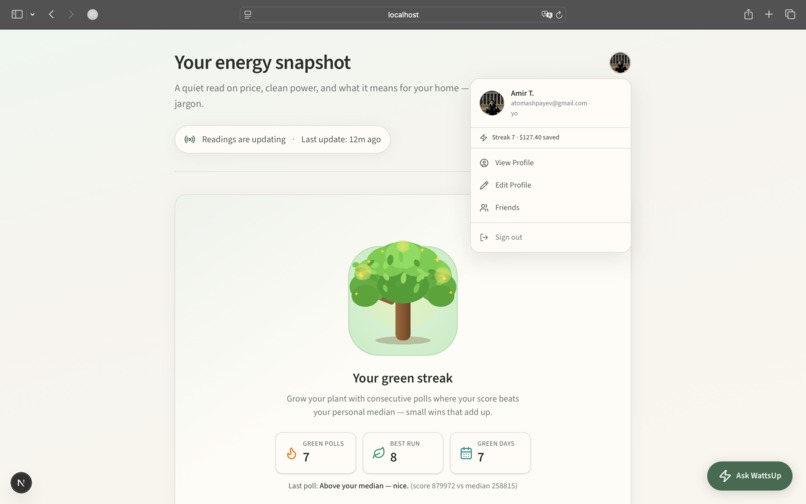
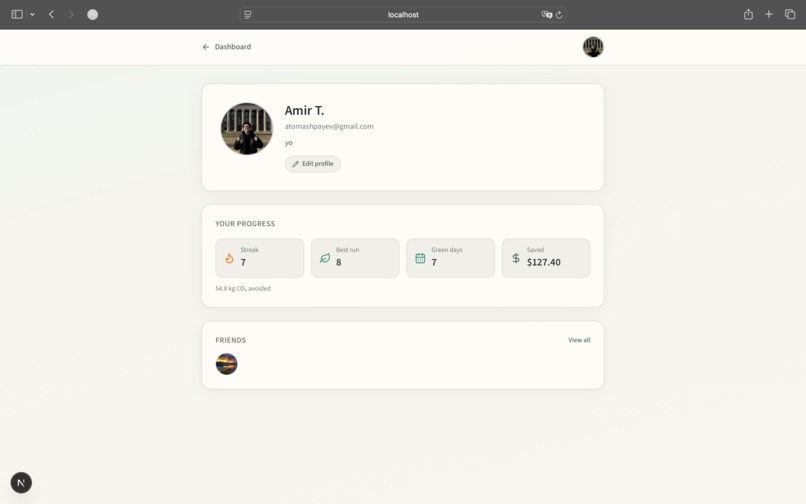
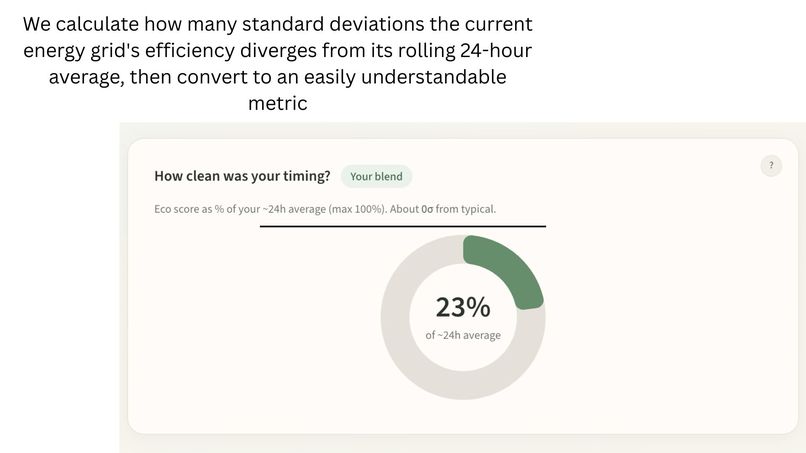
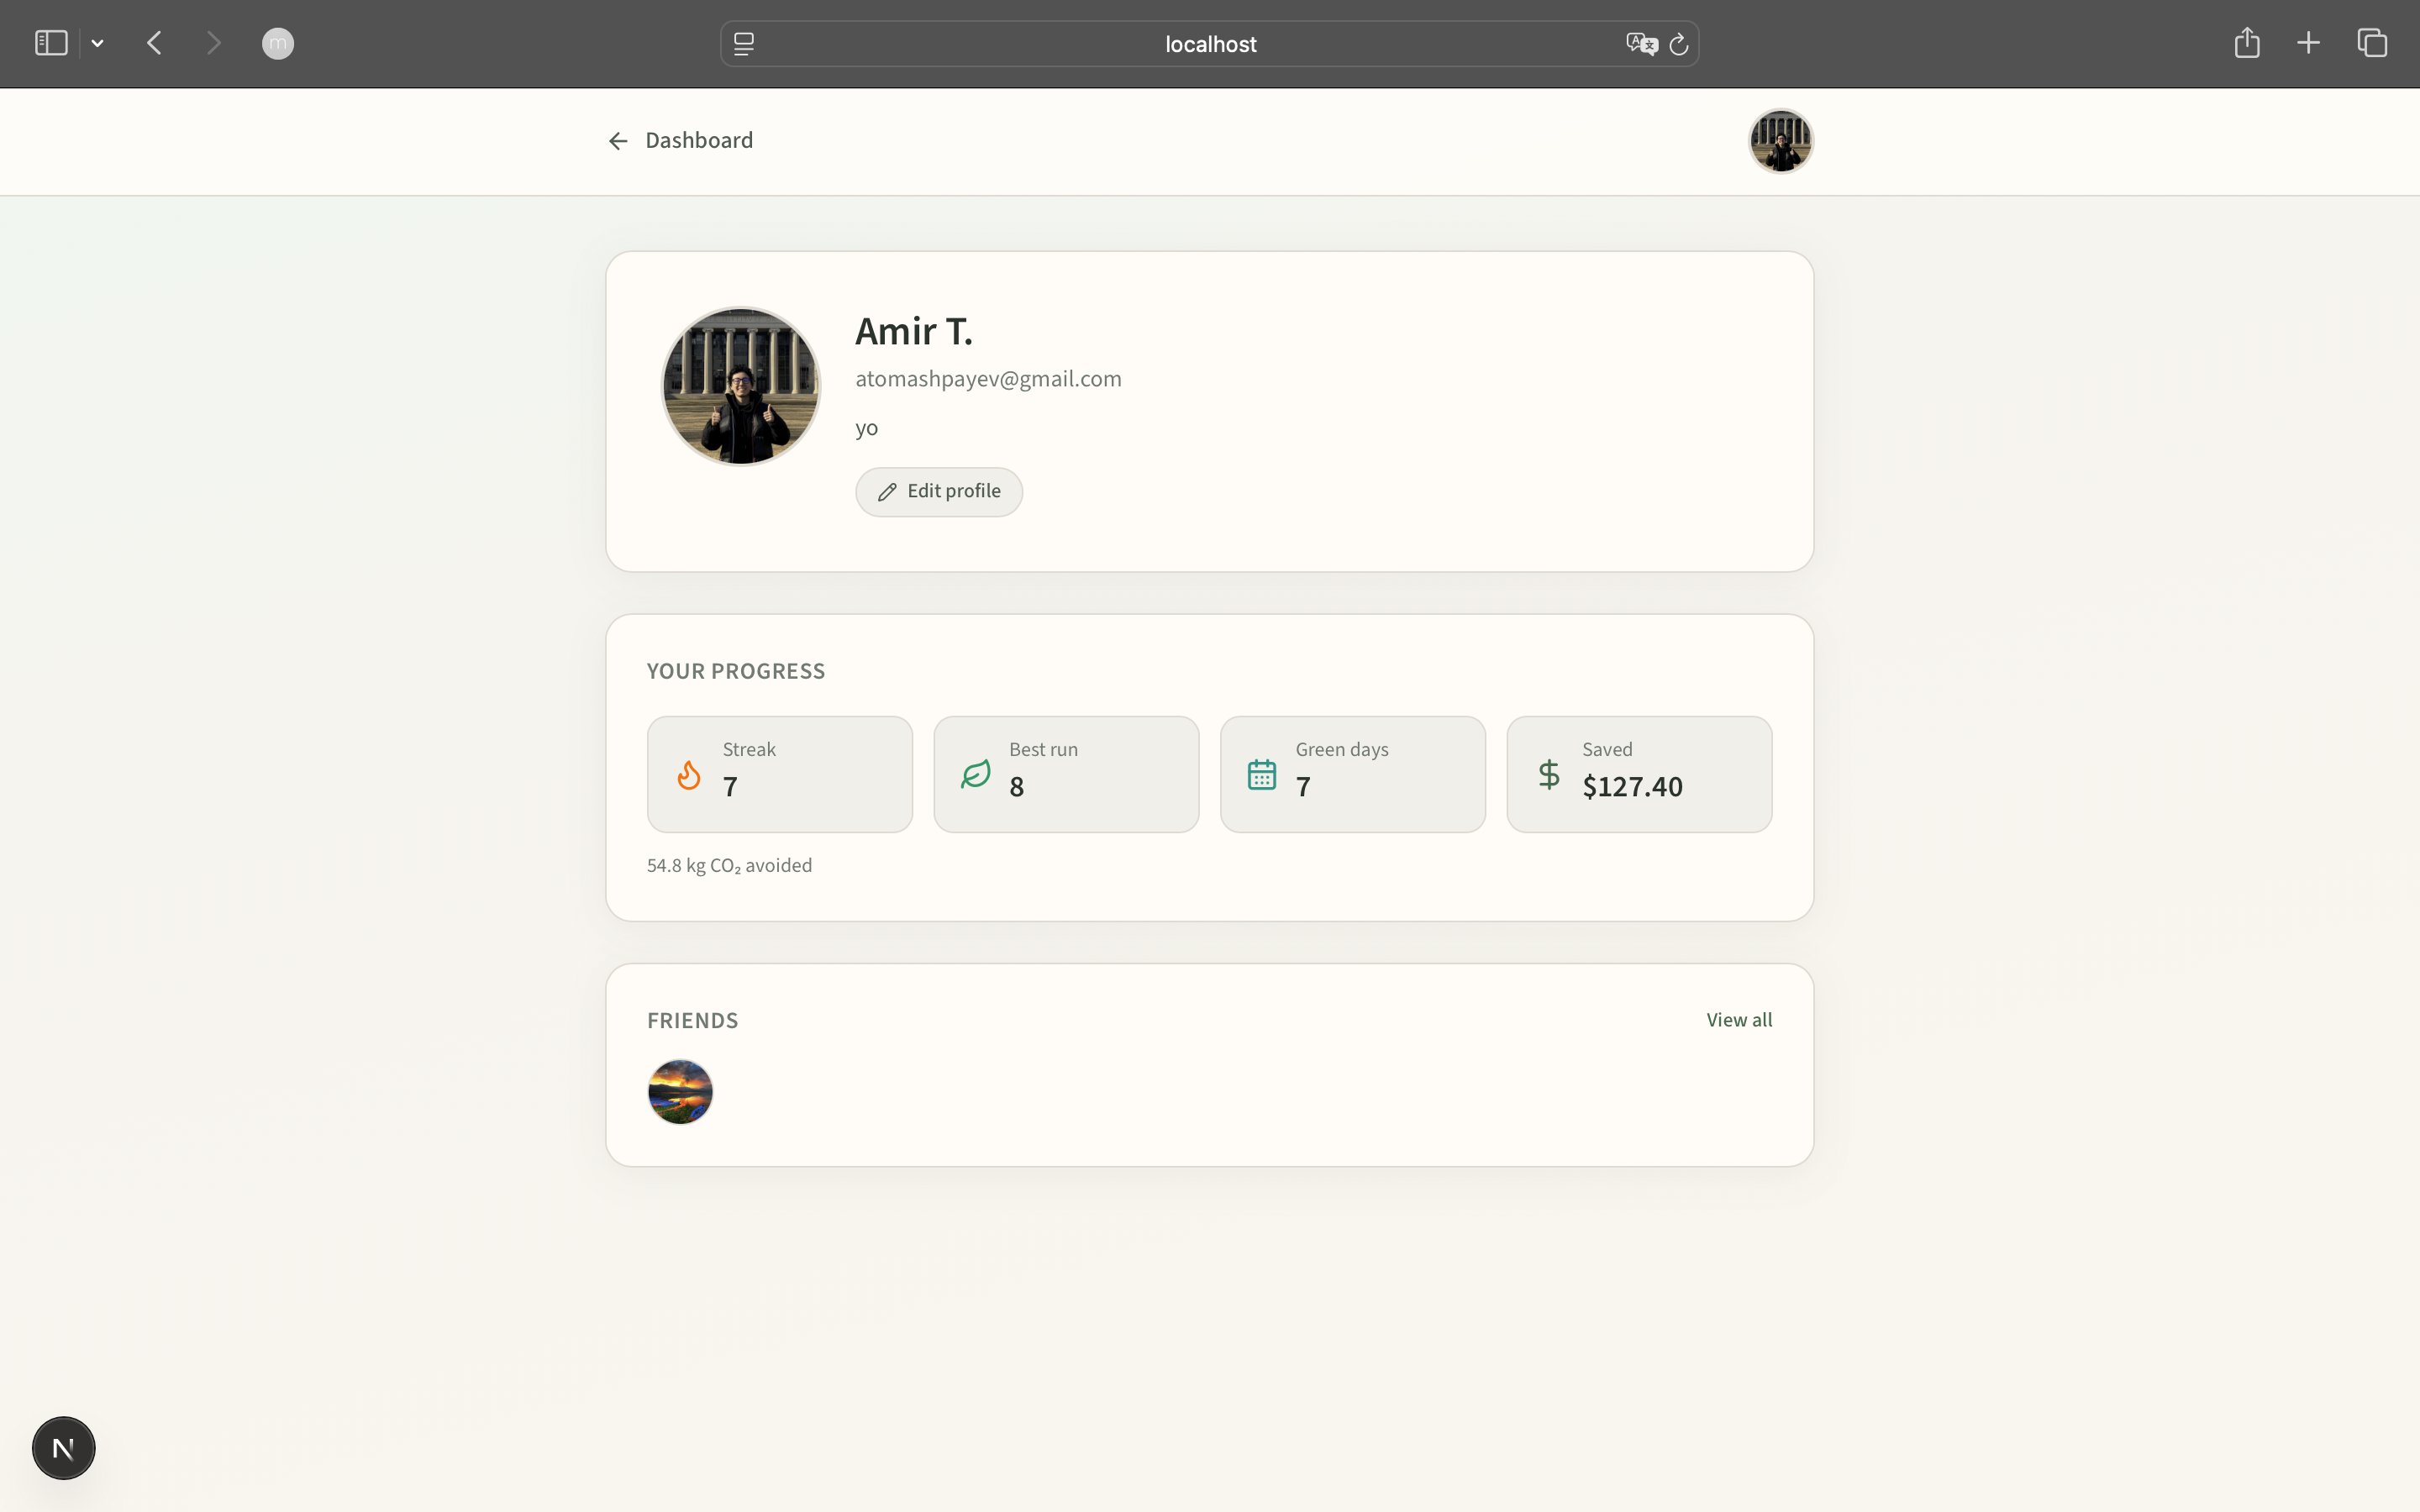
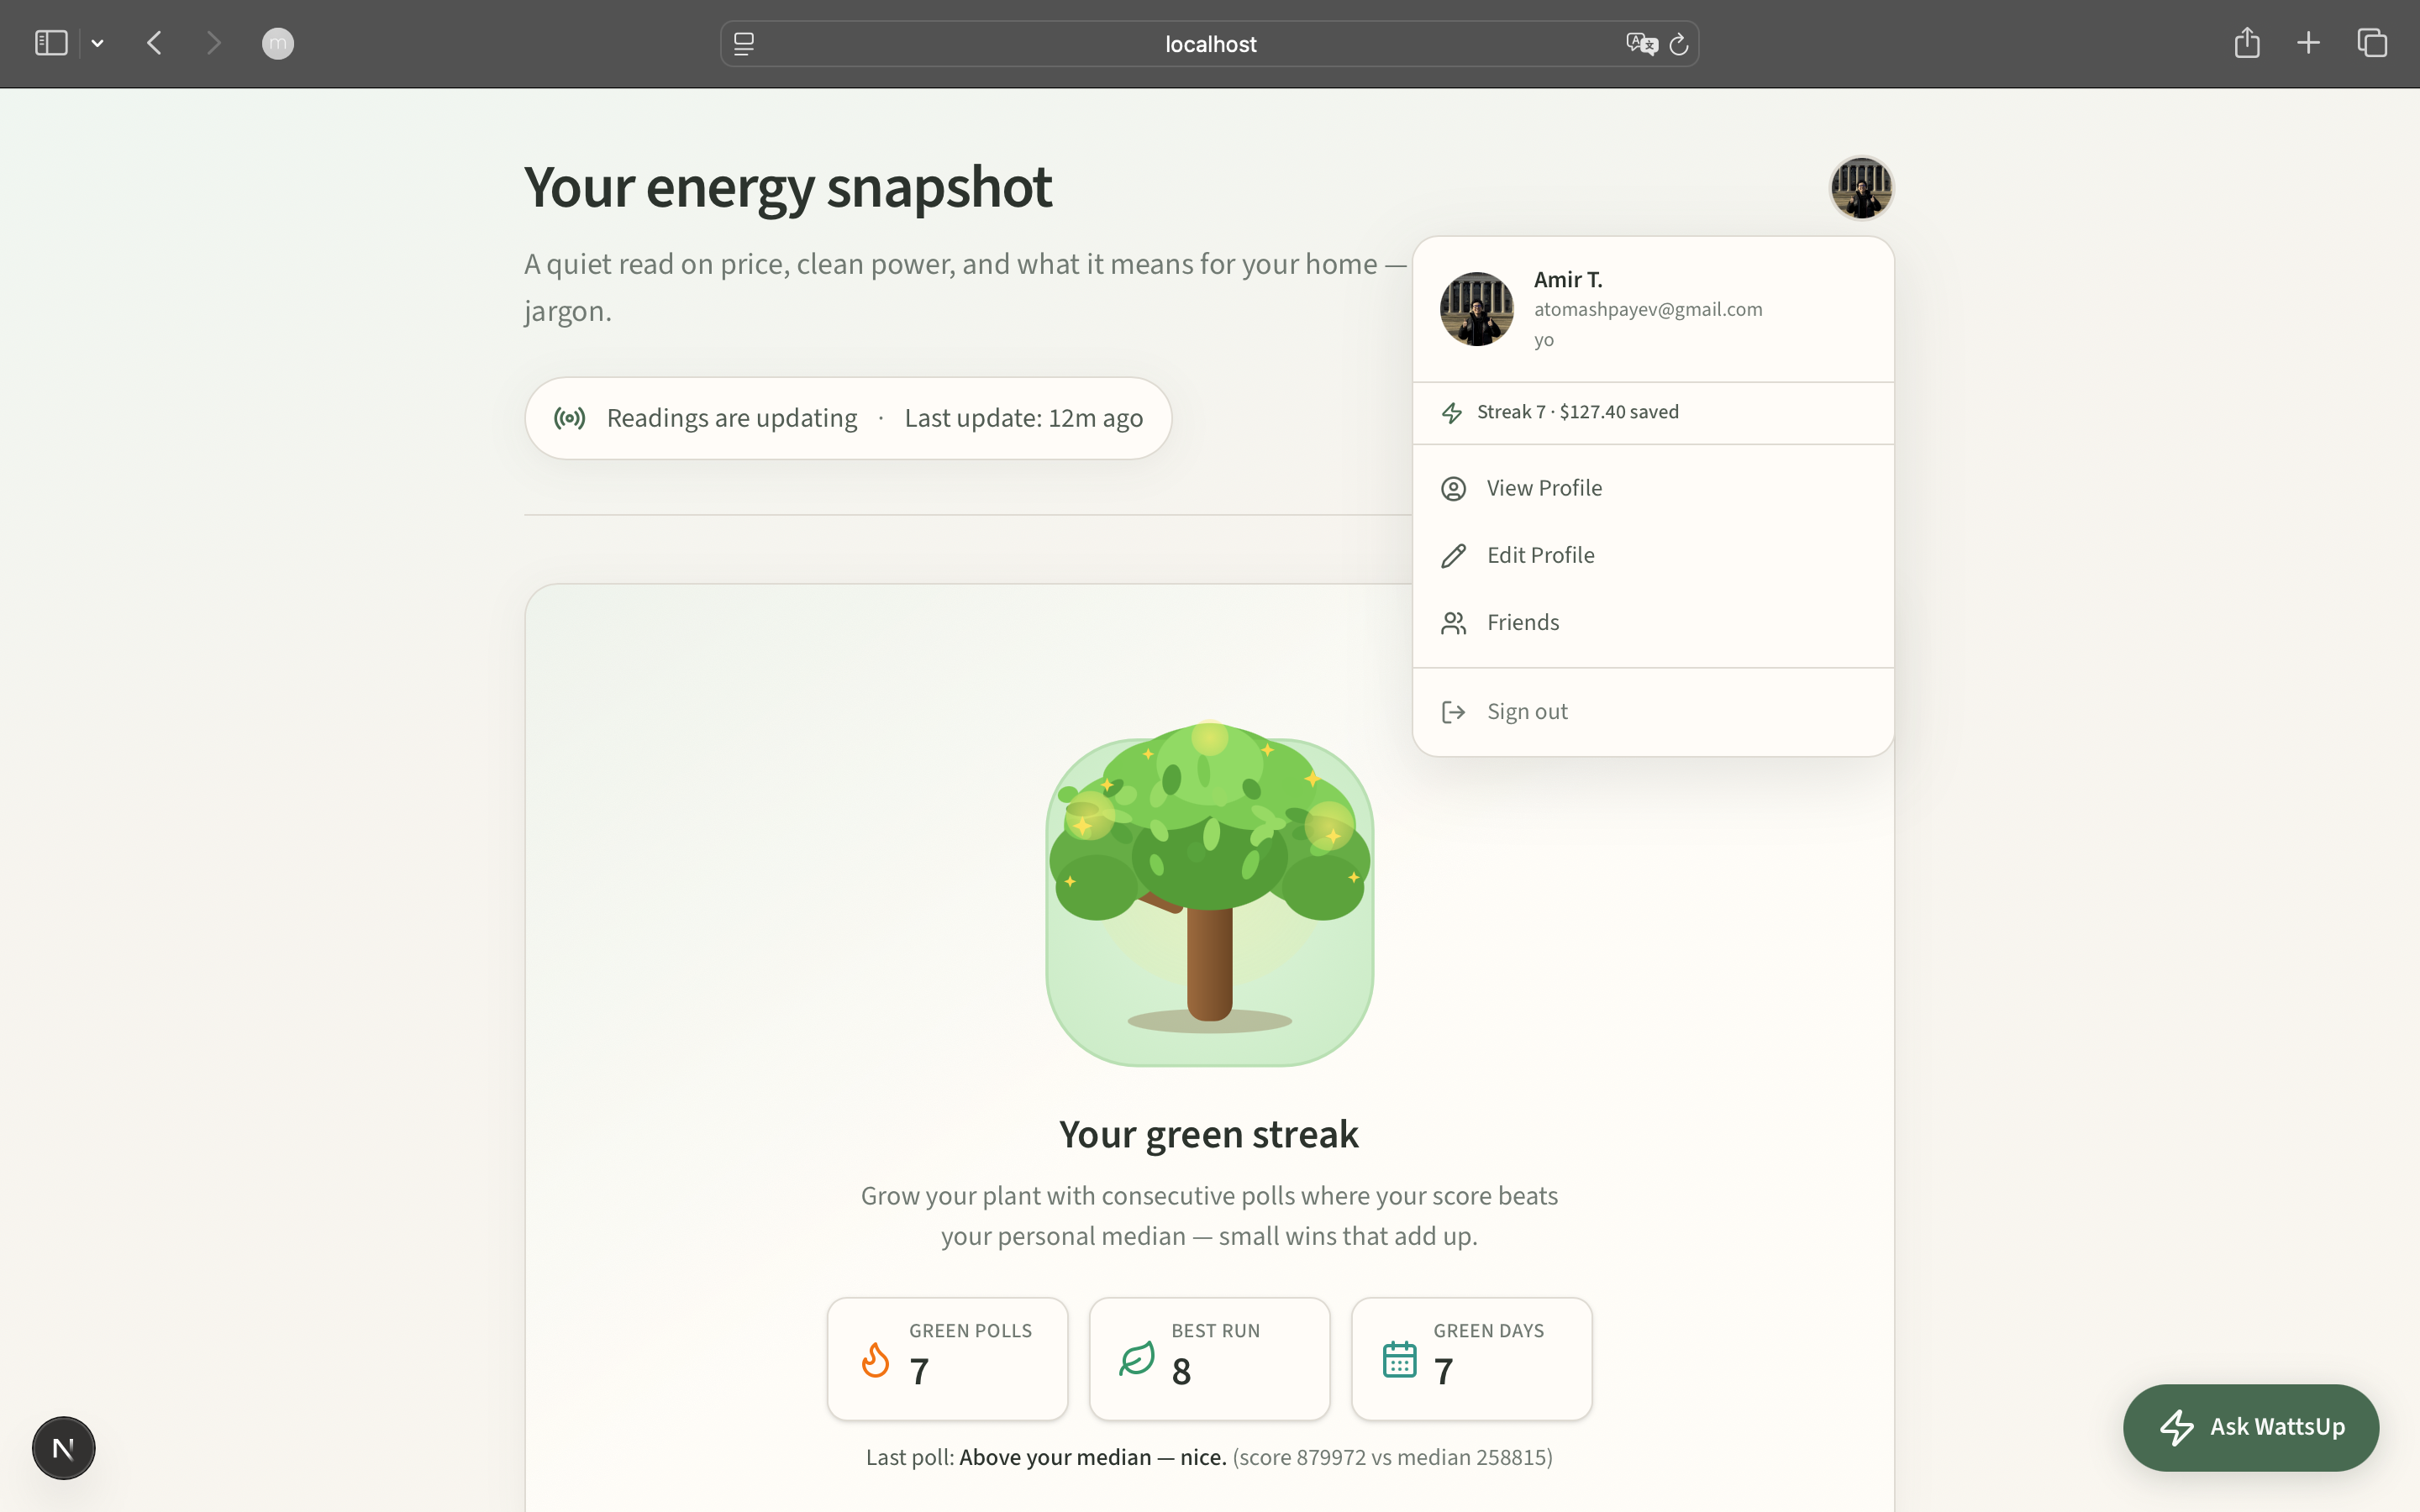
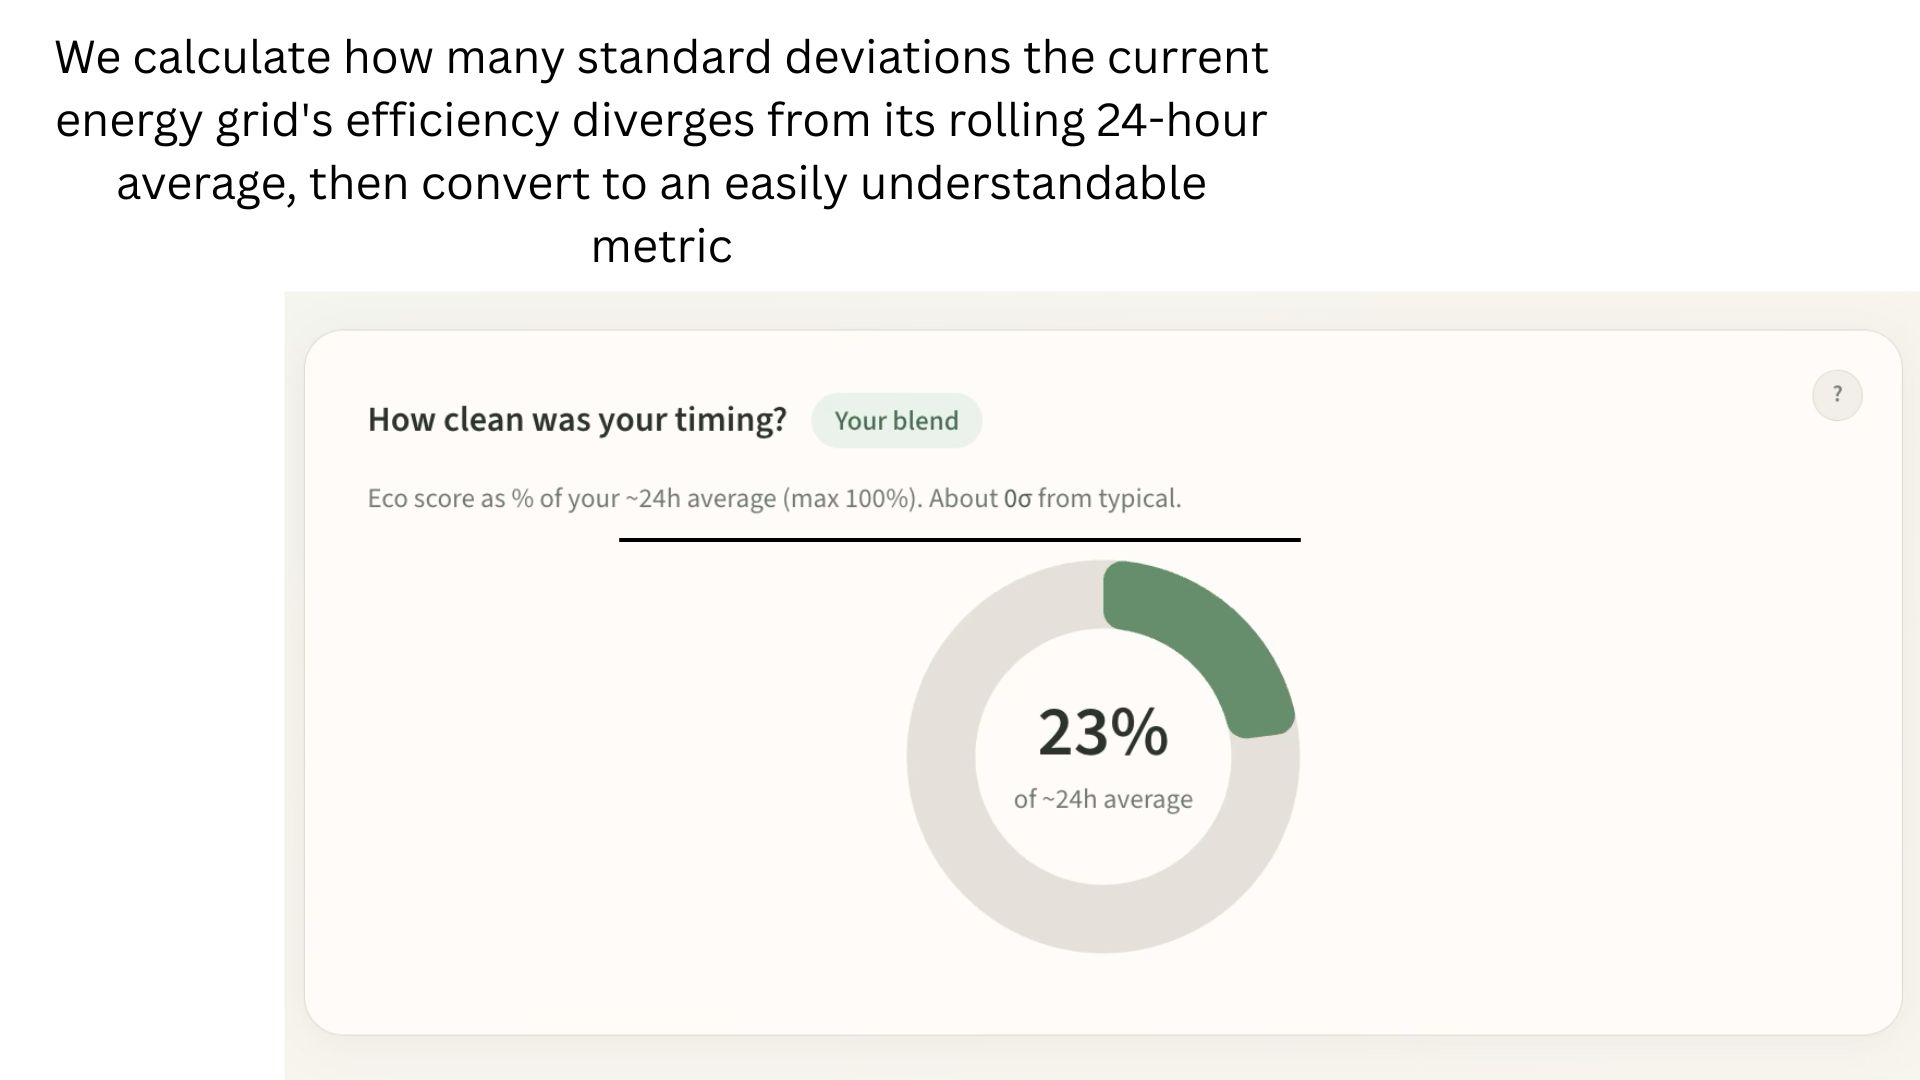
Dashboard with gamified energy streak stats
-
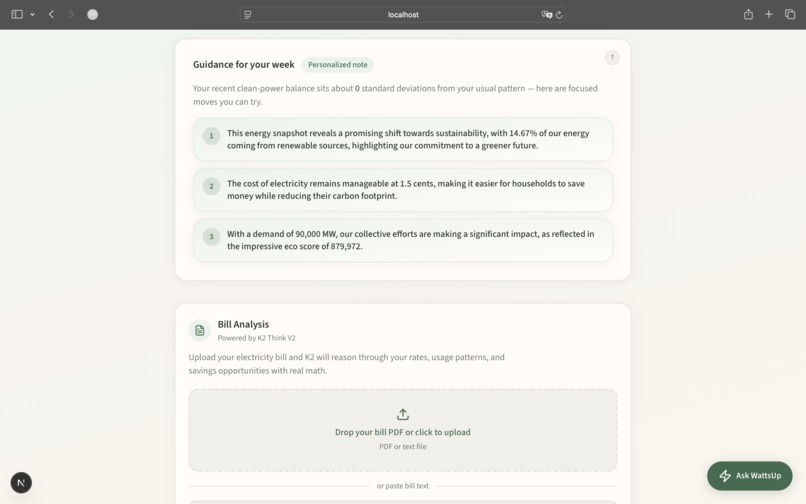
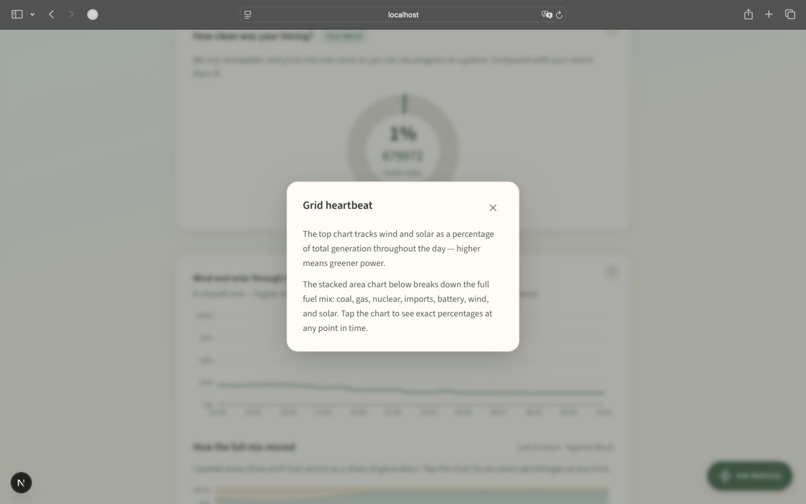
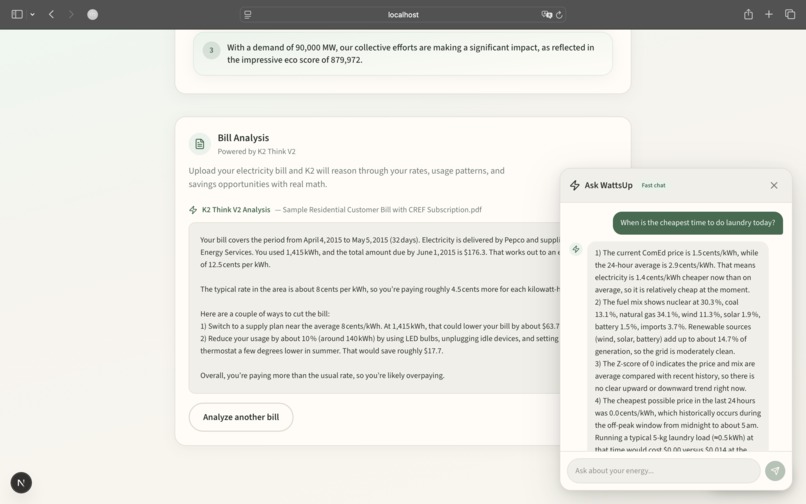
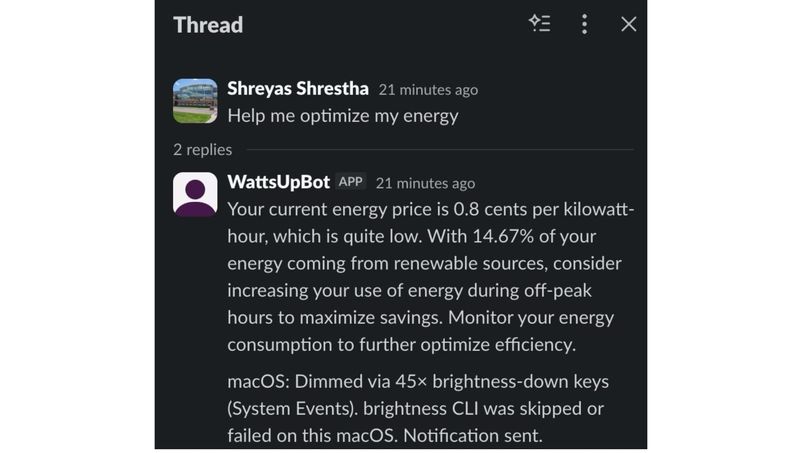
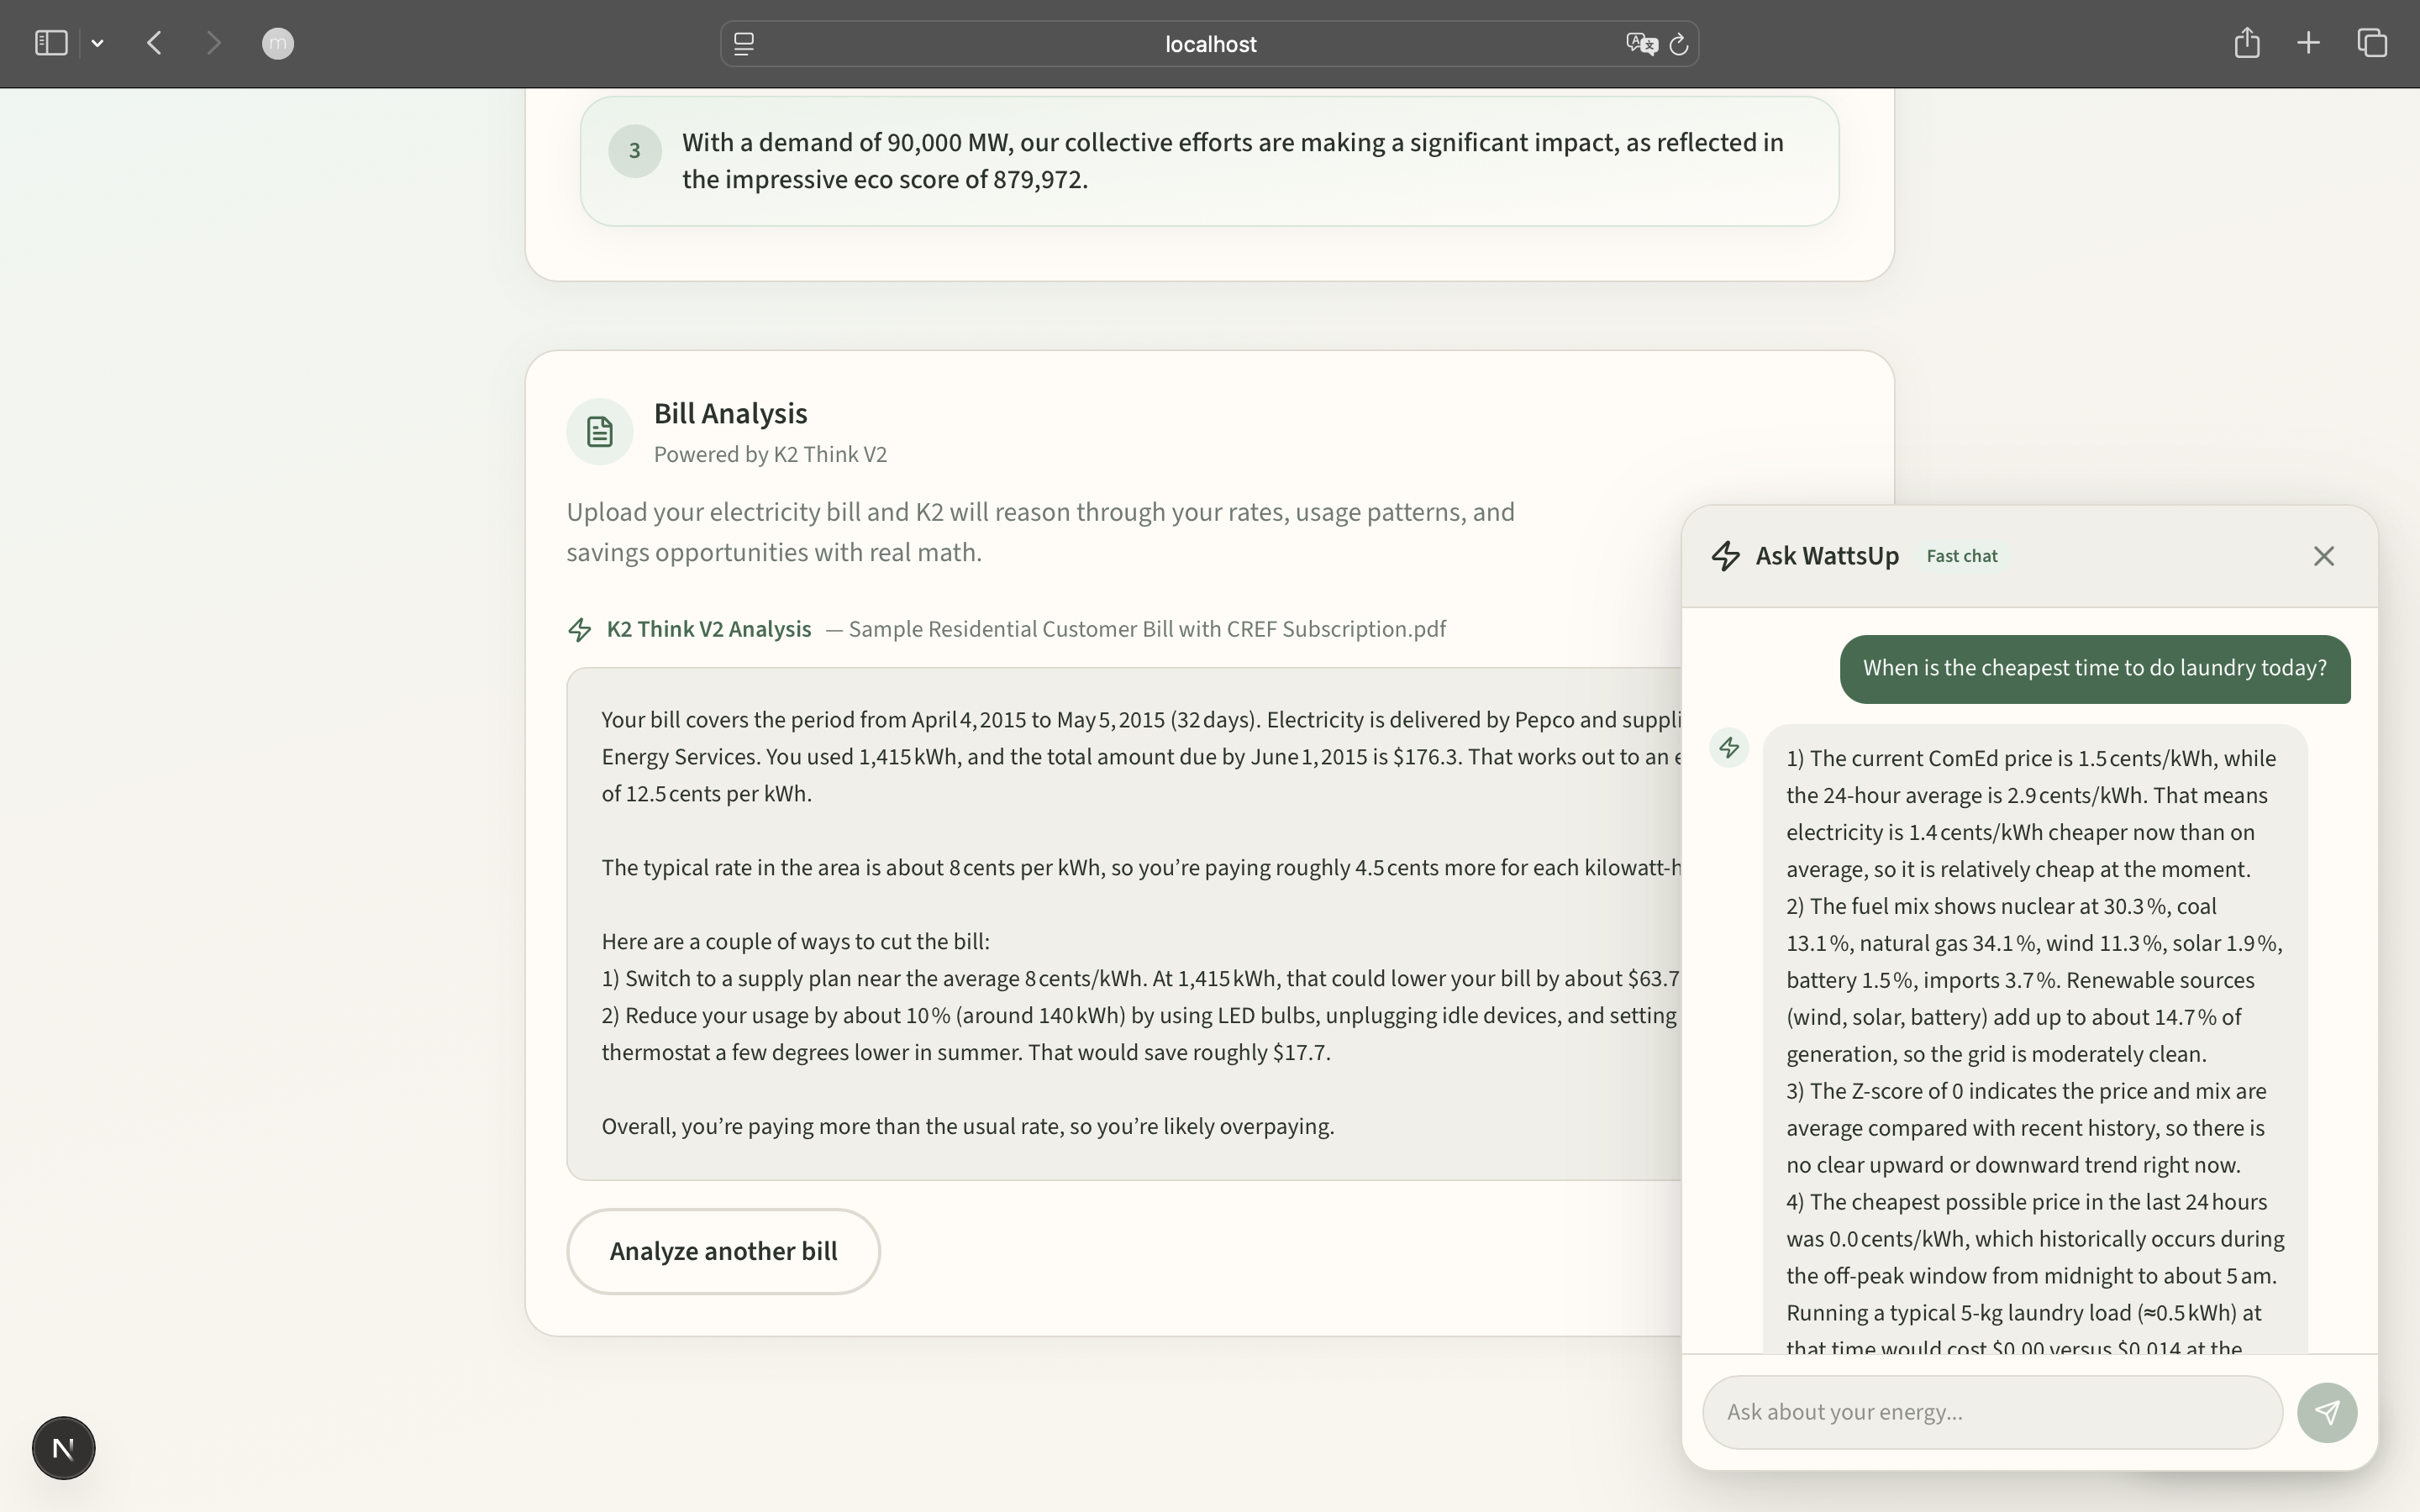
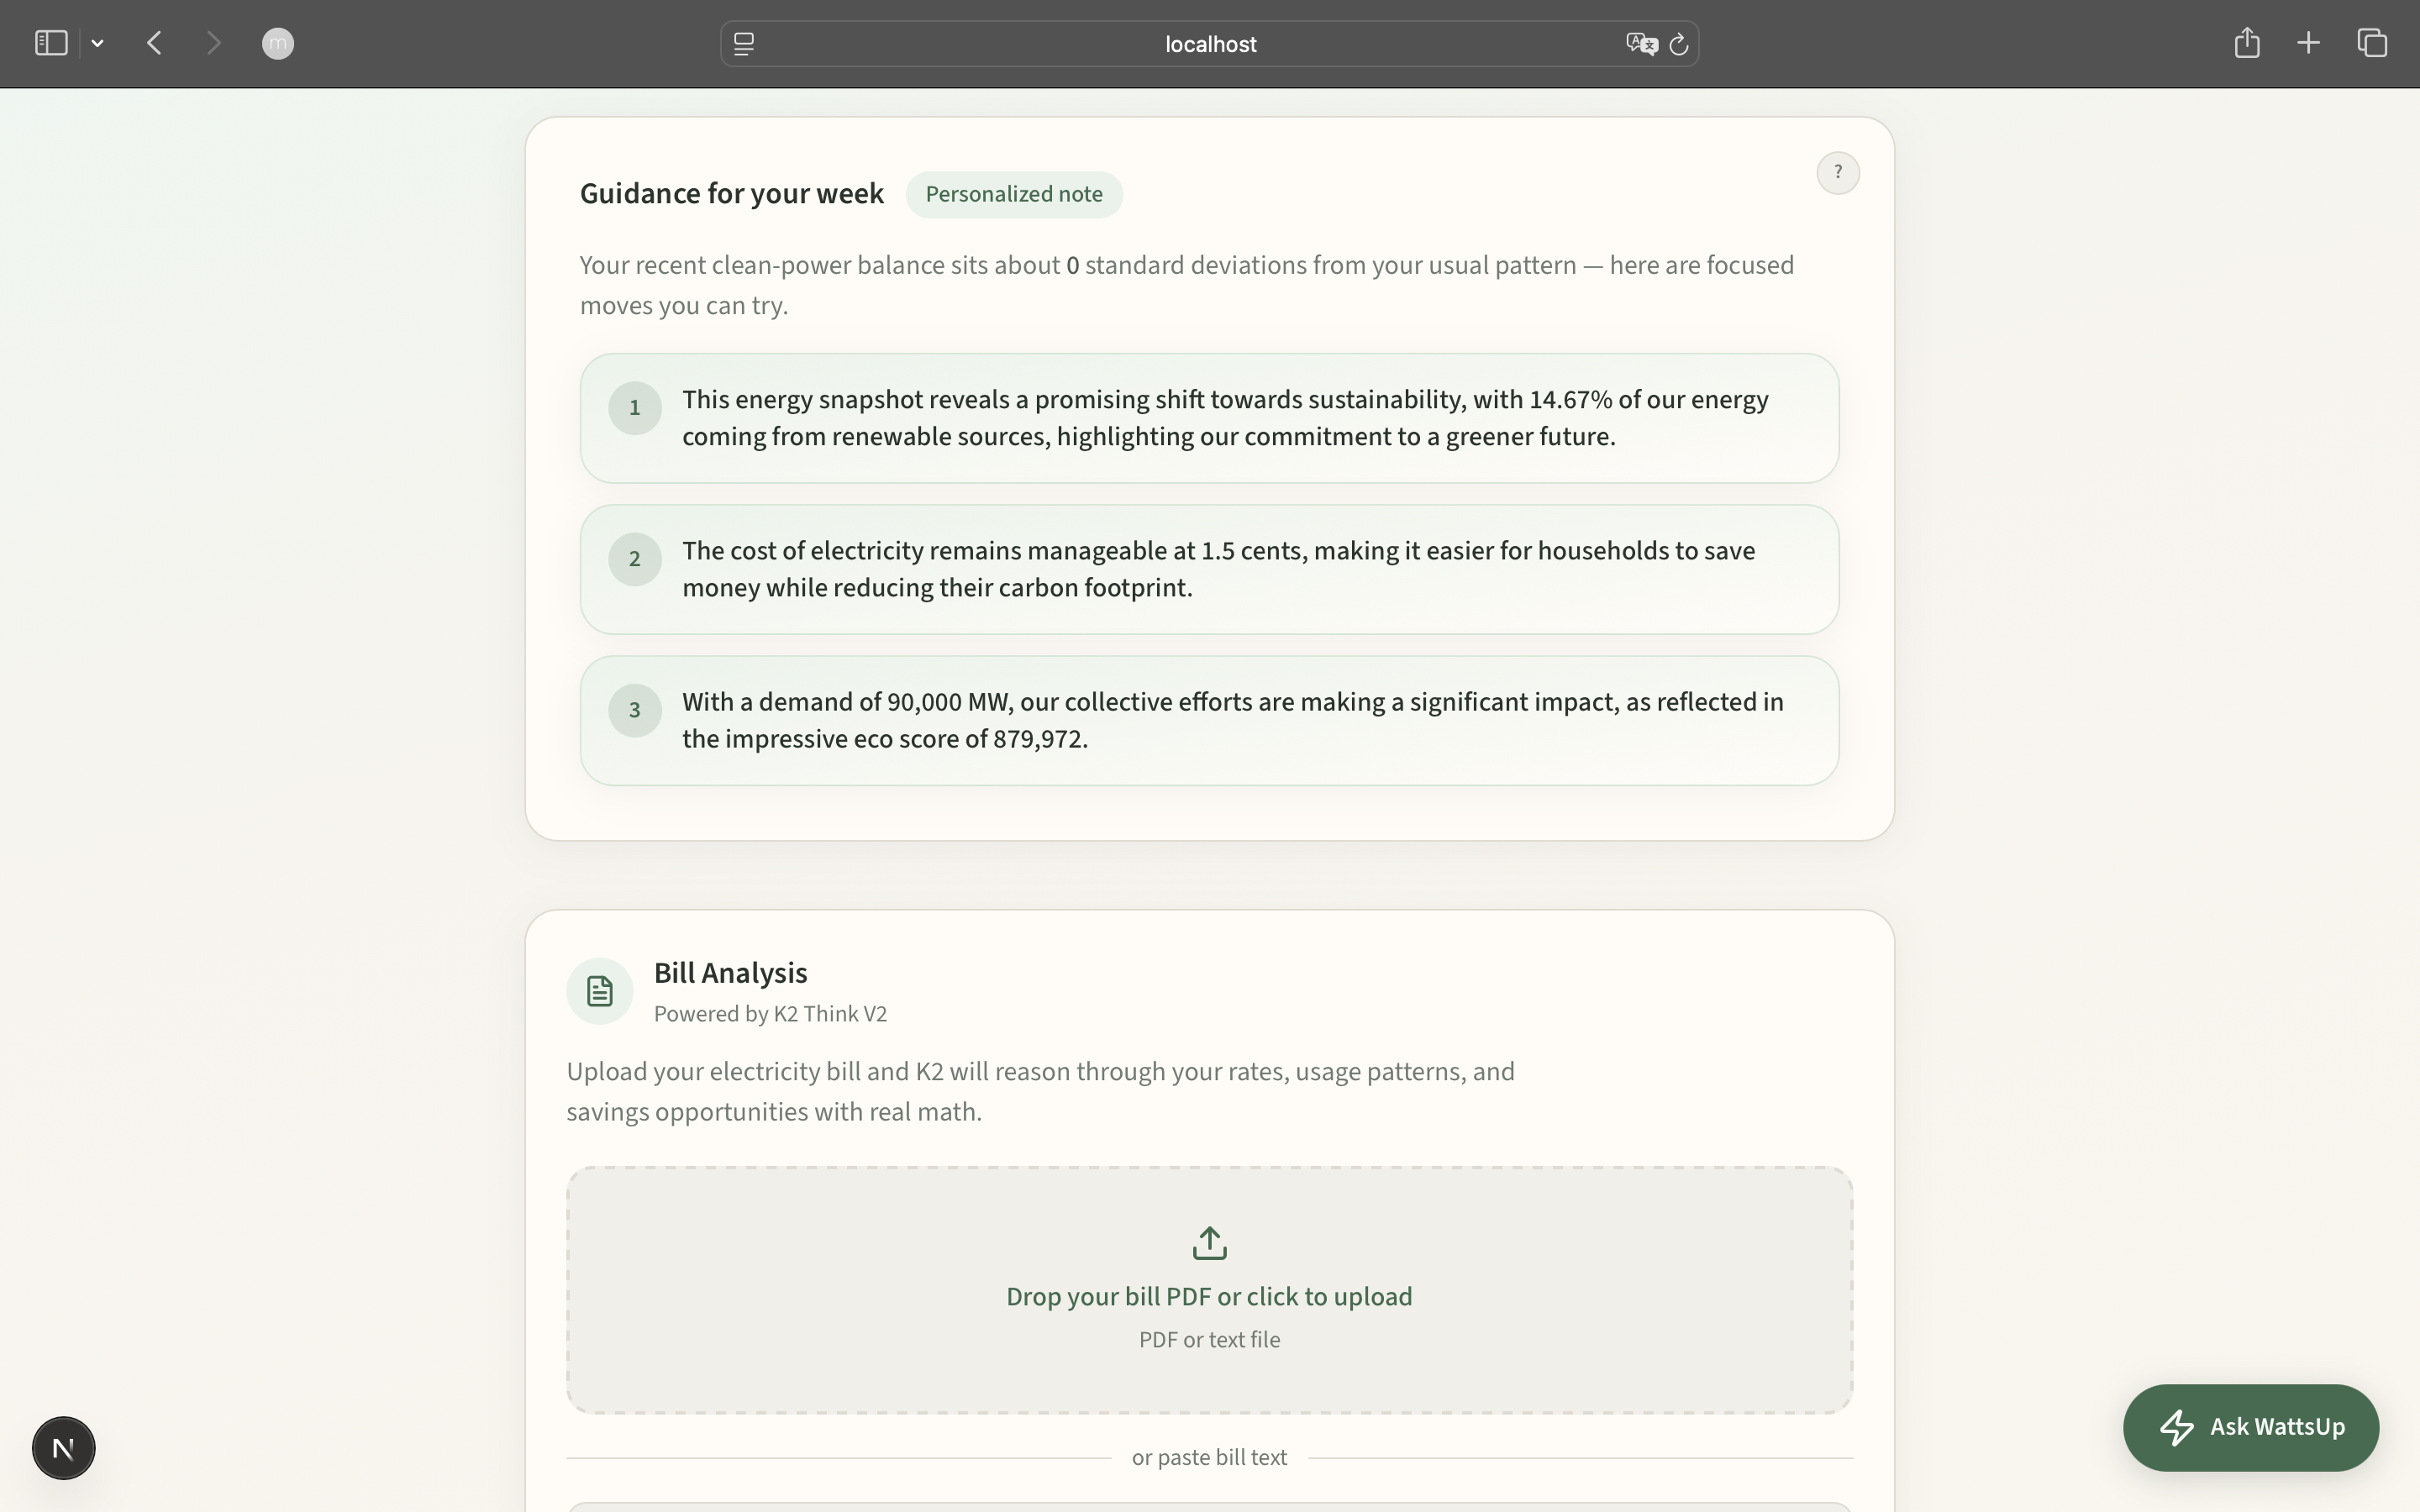
AI agent offers suggestions to optimize energy consumption for the week
-
-
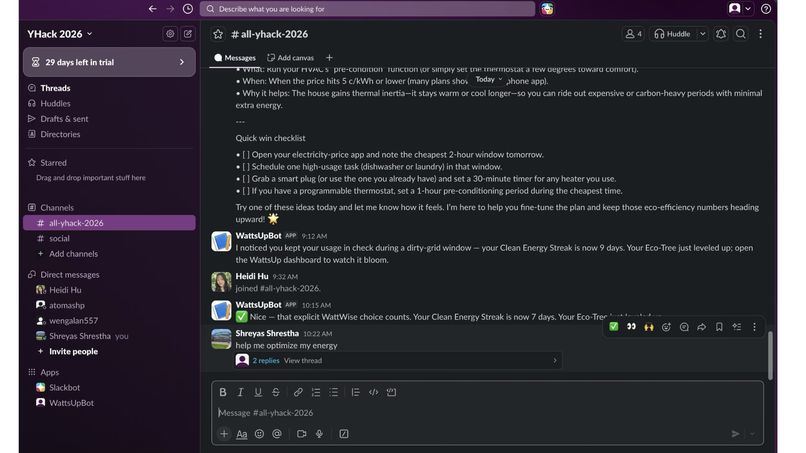
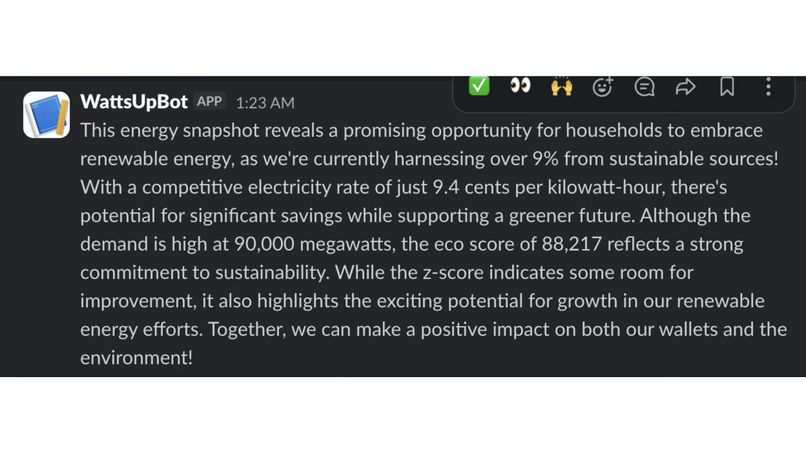
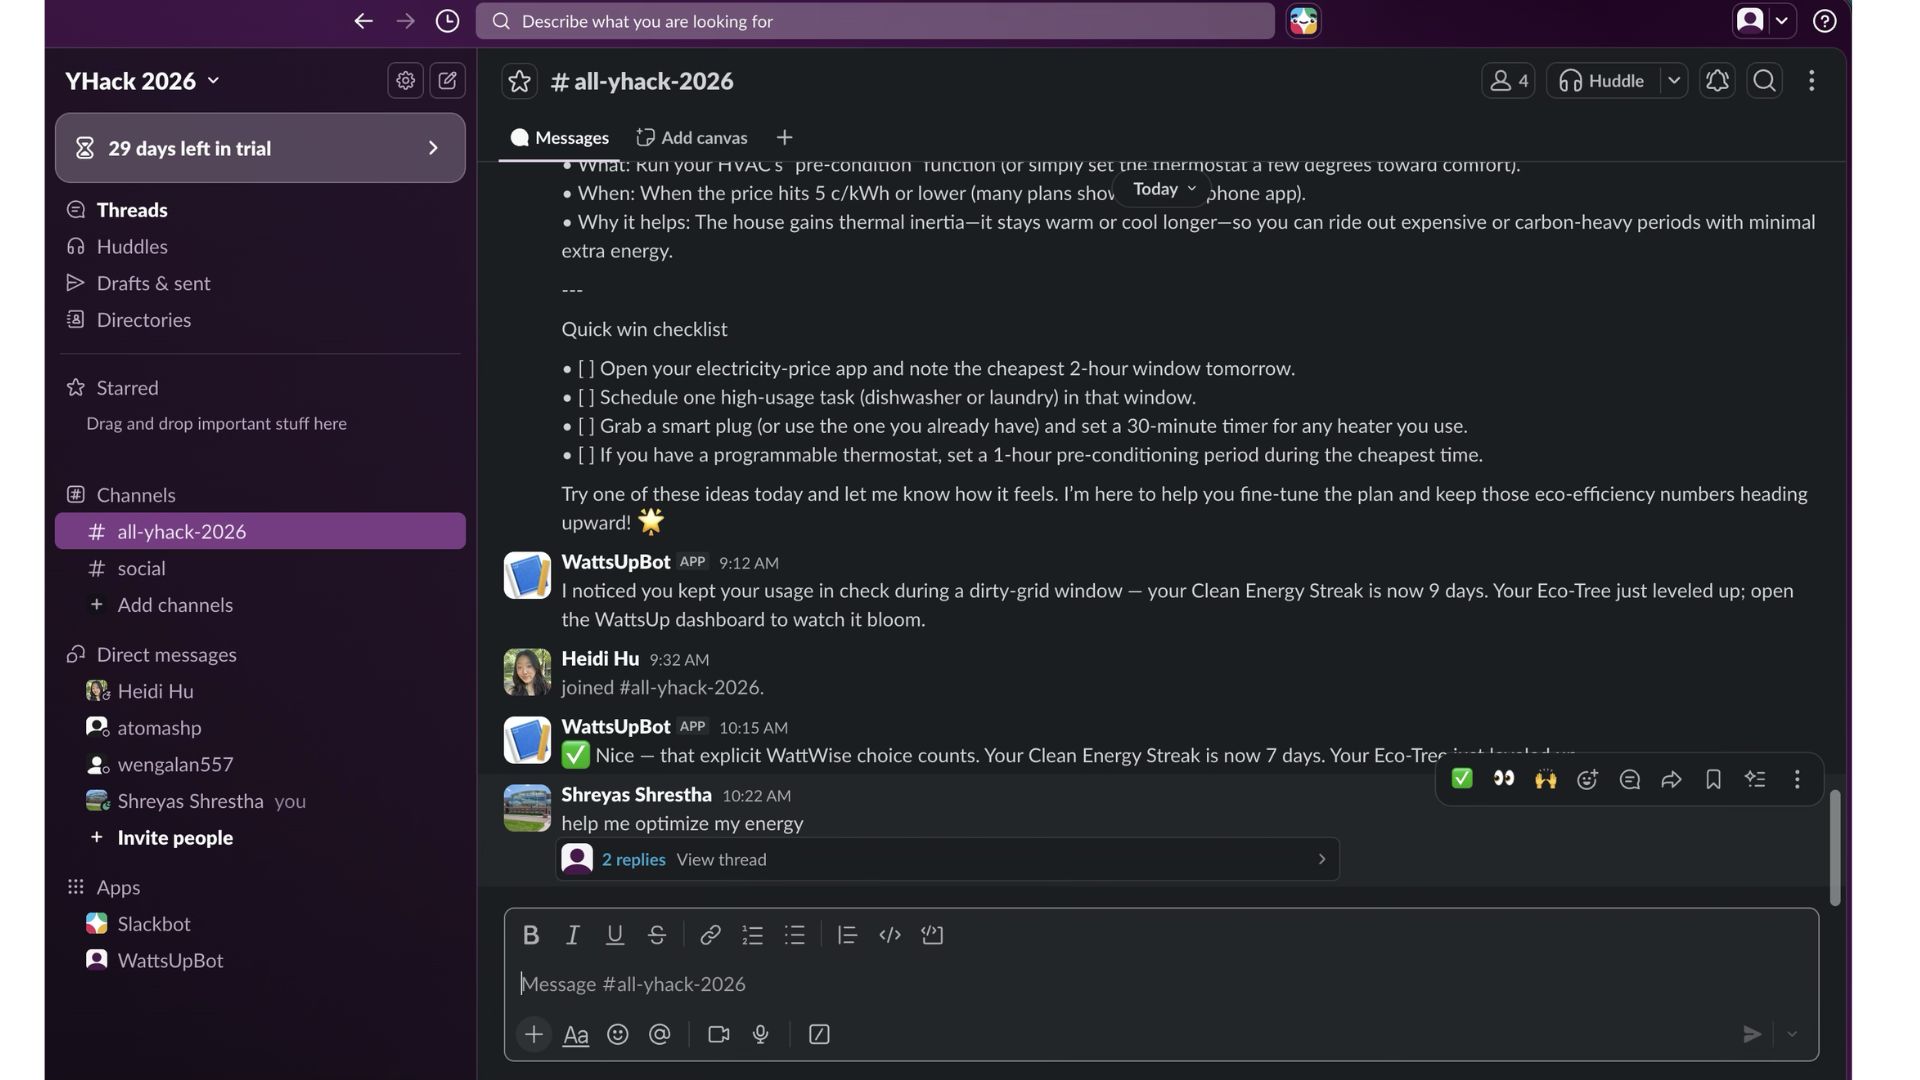
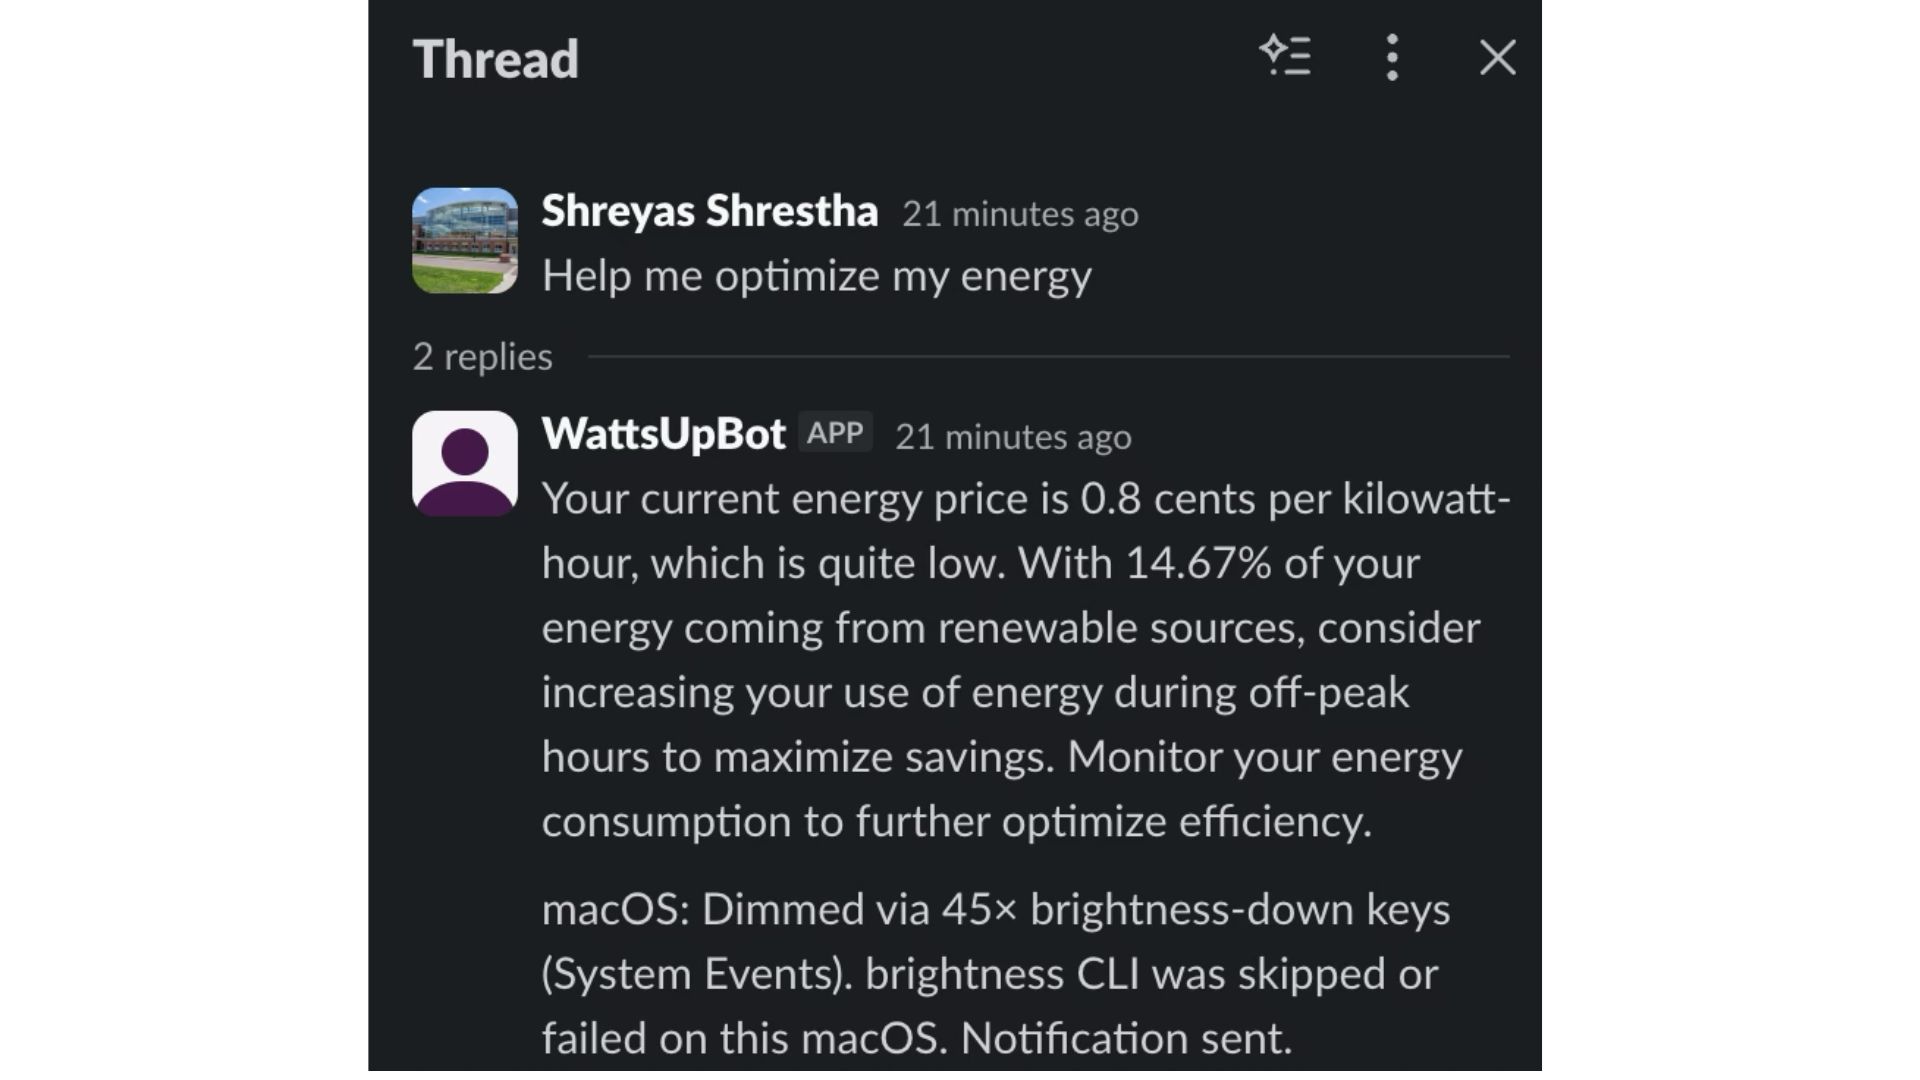
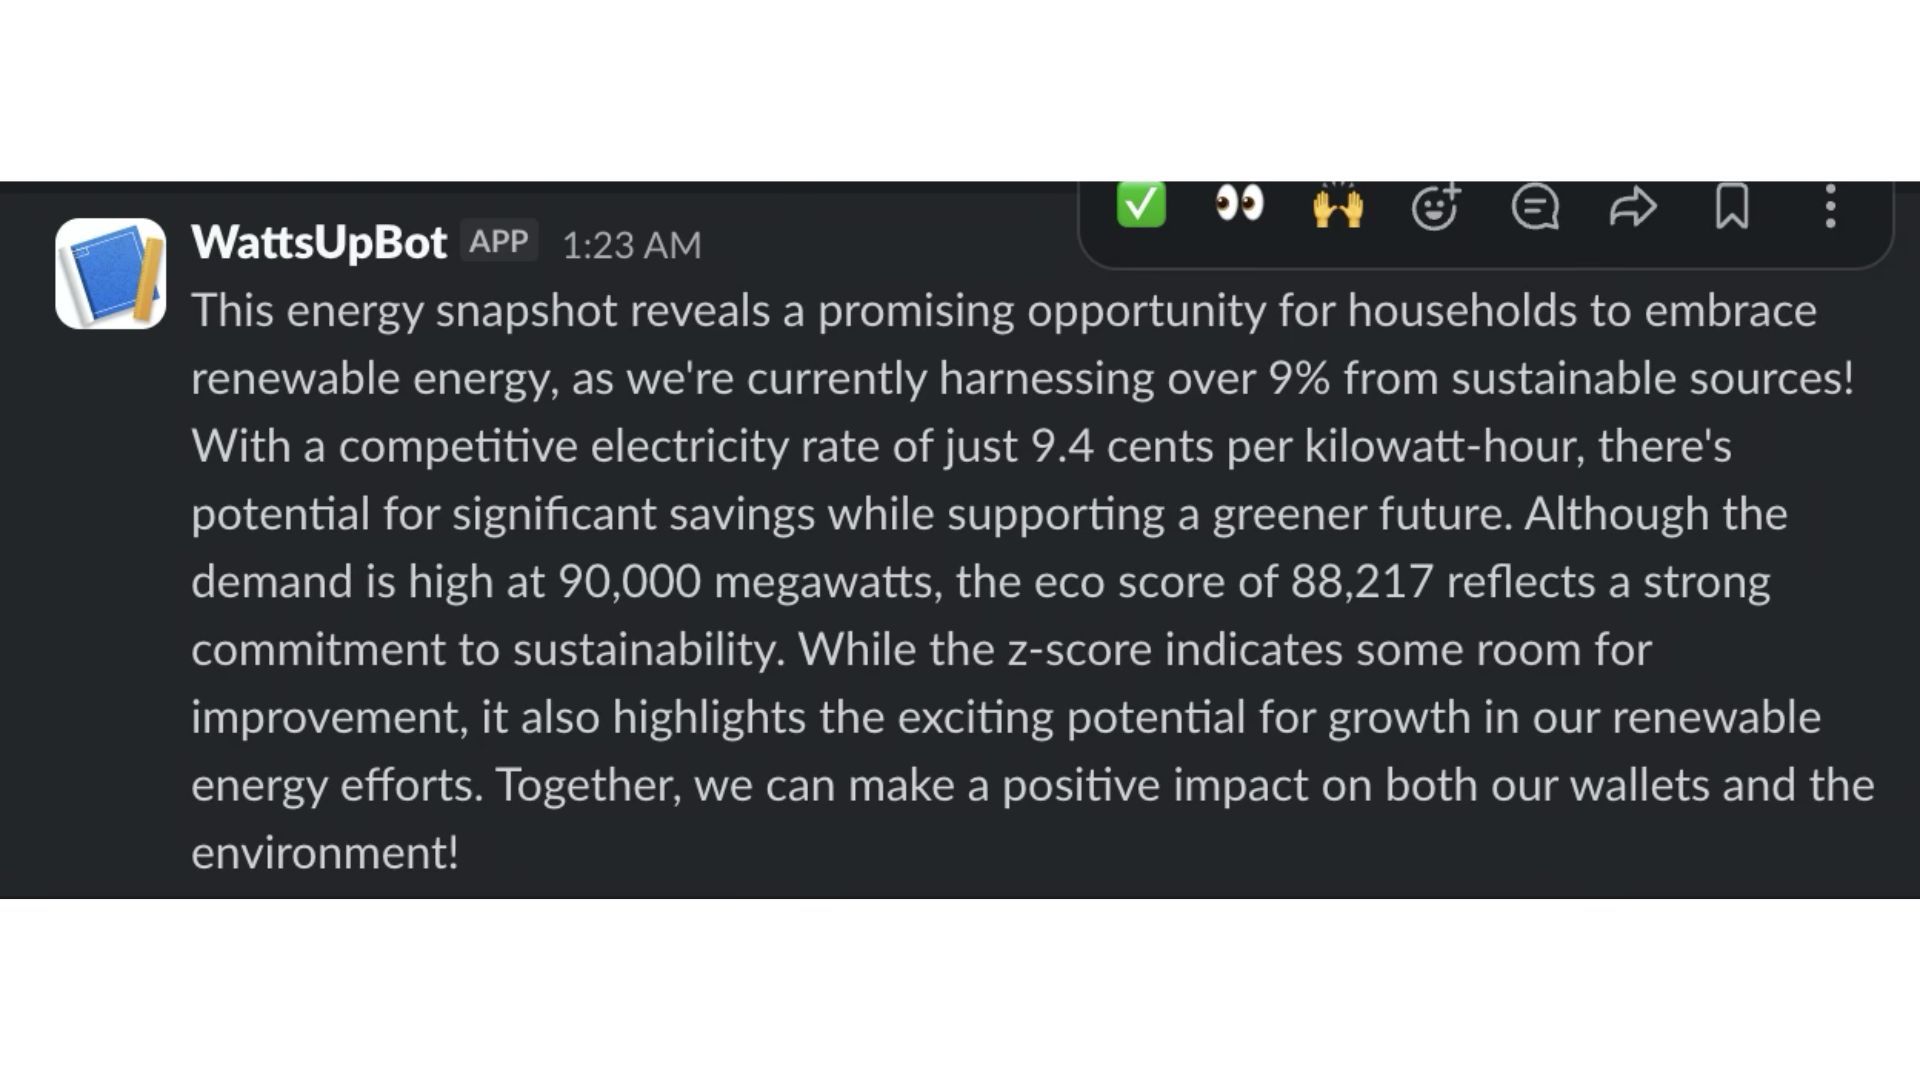
Slack Agent for Push Notifications and Agentic Commands (Control House Appliances → turn a.c. down, computer screen brightness)
-
-
-
-

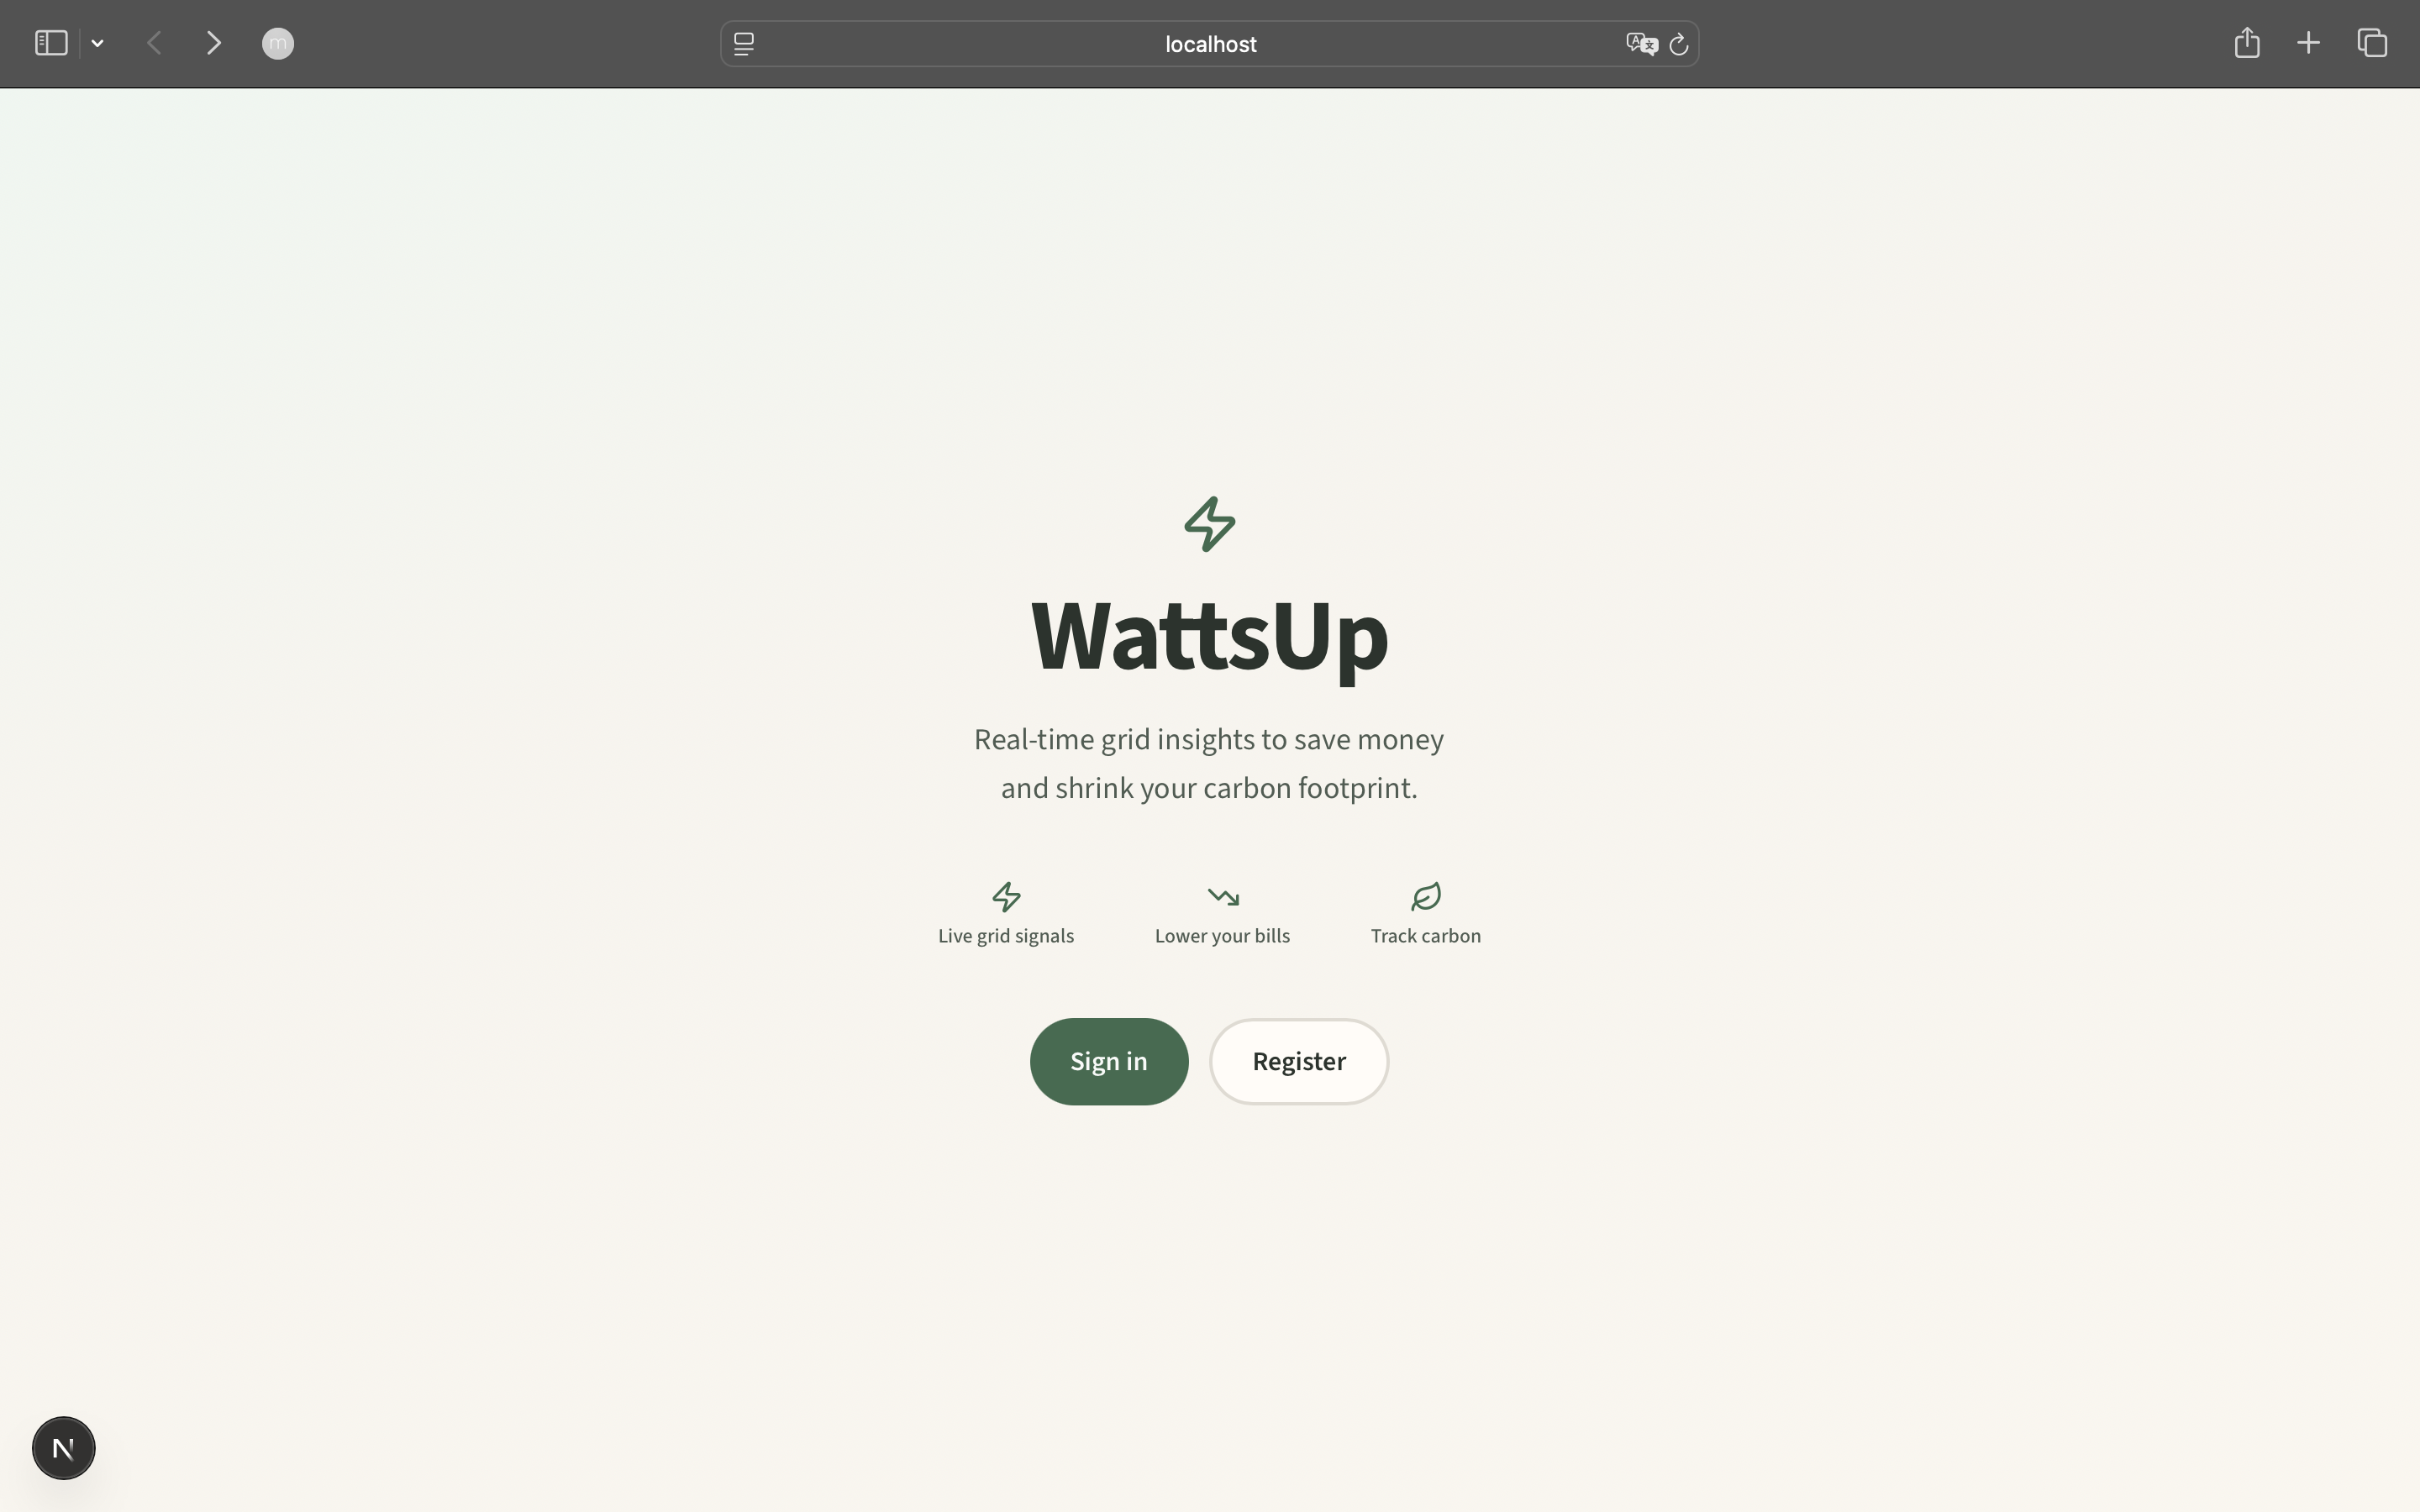


WattsUp
Inspiration
Right before the hackathon, Heidi came from a tour of NYISO, where she got a firsthand look at how grid operators manage demand spikes in real time. One thing that stuck with her was how much stress peak load puts on the grid — and how those same peaks often mean higher electricity prices for consumers. She also learned that the grid’s fuel mix is constantly changing, so electricity is not equally “green” at every moment. As a team of environmentally conscious people, we started thinking: what if ordinary users could actually see when energy is both cleaner and cheaper, and adjust their habits accordingly? That became WattsUp — a way to turn real grid data into actionable, AI-powered suggestions that help people save money and reduce their carbon footprint.
What it does
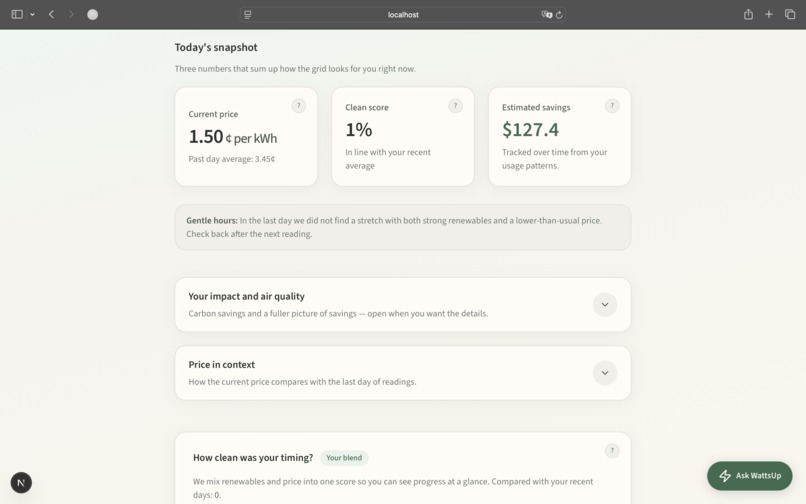
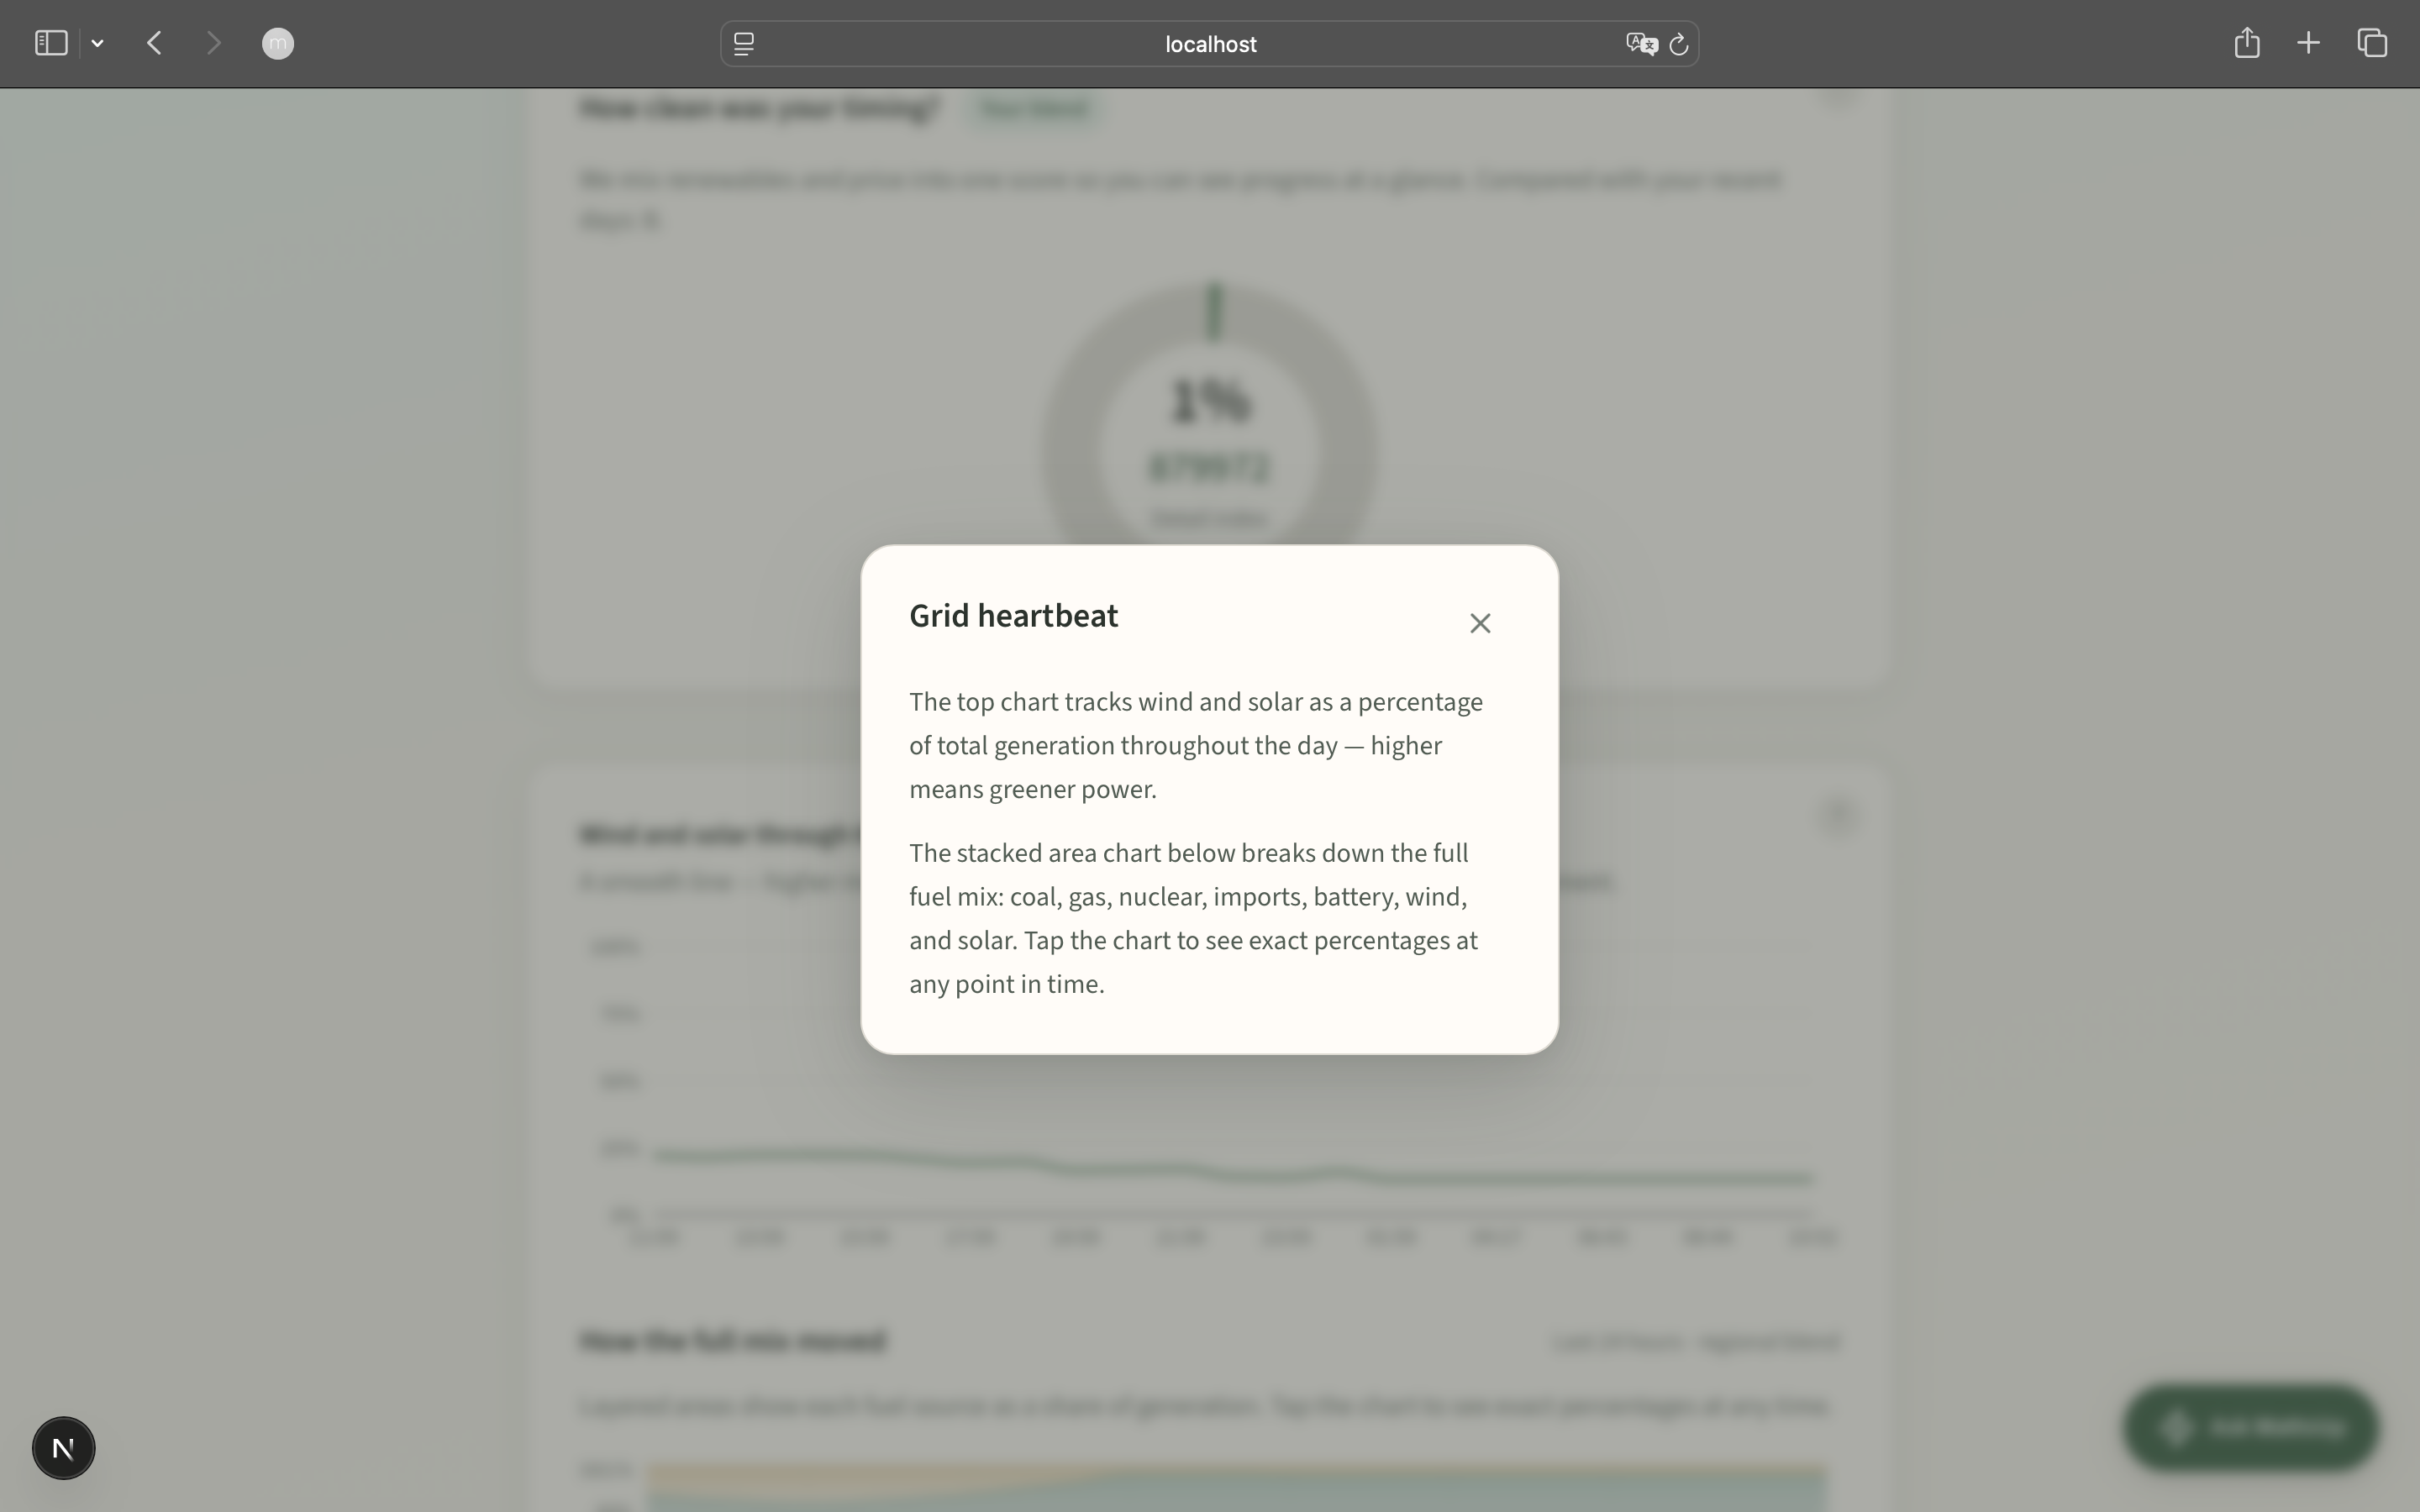
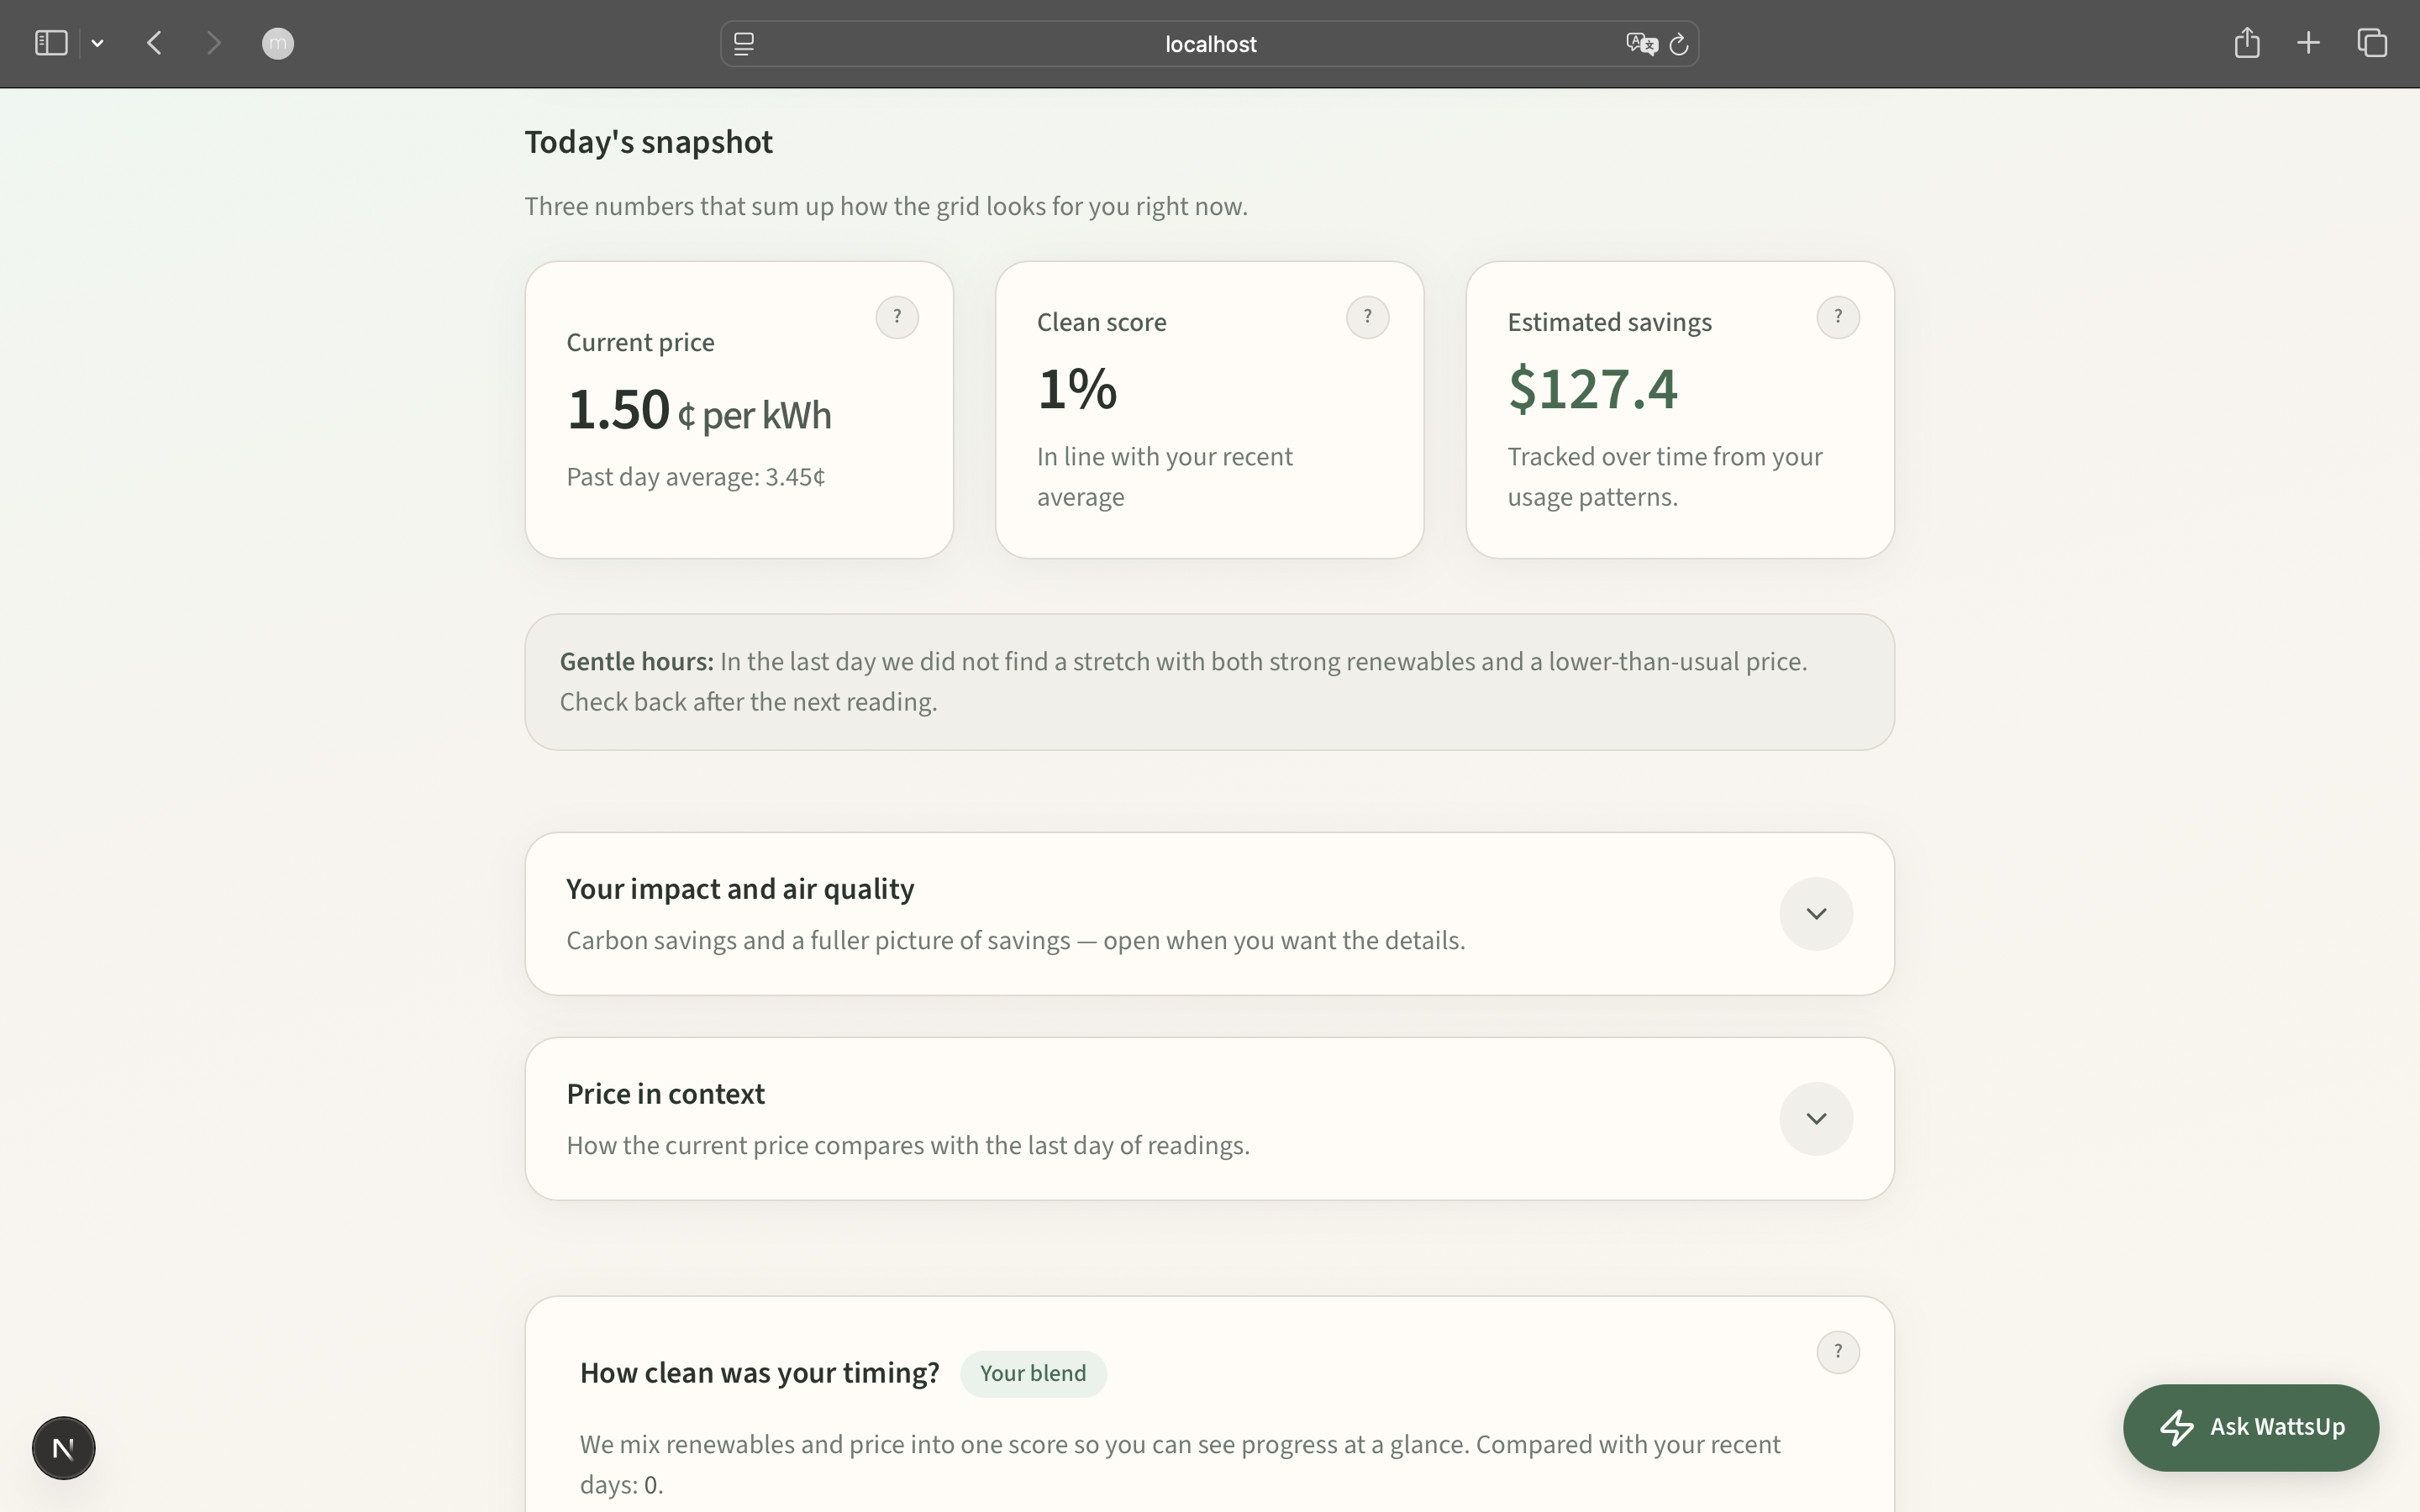
WattsUp is a real-time energy assistant that watches the electricity grid for you. Every five minutes it pulls live ComEd pricing and the regional fuel mix (wind, solar, coal, natural gas, nuclear), scores how green and affordable the grid is right now, and tells you exactly when to use power.
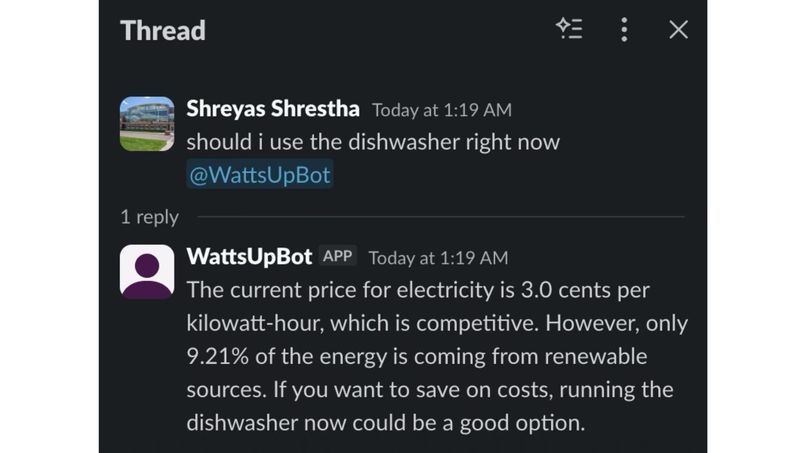
You can chat with the AI agent on the web, Slack, or Telegram — ask "should I run my laundry now?" or upload your electricity bill for a full breakdown.
Green streaks, leaderboards, and friend comparisons turn energy saving into a social challenge.
How we built it
- Backend: Python with FastAPI, a background polling worker that hits the ComEd 5-minute pricing API and GridStatus.io for PJM fuel mix data every 5 minutes, stores everything in MongoDB Atlas time-series collections.
- Frontend: Next.js 15, React 19, TypeScript, Tailwind CSS 4, Recharts for live dashboards.
- Auth & social: Supabase for OAuth, profiles, friends, and leaderboards.
- AI: Two-tier LLM routing — fast queries go through a flash model via the Lava gateway, deep analysis (bill breakdowns, anomaly explanations, proactive alerts) routes to K2 Think v2 by MBZUAI, a deep reasoning model built for scientific and quantitative domains. The chat agent plans tool calls (MongoDB queries, live grid snapshots, user stats) so the LLM always reasons over real data, never hallucinated numbers.
- Alerts: Edge-triggered push notifications via Slack and Telegram — fires once when prices drop into your target band or the z-score crosses a threshold, then stays quiet.
Challenges we ran into
- ComEd's 5-minute pricing API occasionally returns stale or missing data — we had to build carry-forward logic for fuel mix and graceful fallbacks so the dashboard never shows blanks.
- Routing between the fast flash model and K2 Think v2 required careful prompt engineering — the deep model needs full historical context (up to 36 polling intervals) to reason well, but sending all that to the flash tier would kill latency.
- Getting the green streak math right was tricky. Mean-based thresholds were unfair because energy price data is heavily skewed — a few extreme spikes made streaks impossible. Switching to rolling median gave users a fair, personalized baseline.
- Deploying auth across the Python backend and Next.js frontend with Supabase required careful middleware coordination, especially for protected routes and session refresh.
Accomplishments that we're proud of
- The AI never guesses — it always has real numbers in front of it. The multi-step agent queries MongoDB, pulls a live grid snapshot, and checks your stats before answering. Zero hallucinated prices.
- K2 Think v2 doing genuine scientific reasoning over grid data, not just parroting averages. It catches pricing anomalies and explains why the grid looks the way it does.
- The z-score alert system adapts automatically to seasons and time of day — no hardcoded thresholds that break when summer hits.
- The social layer actually works. Friends, green streaks, leaderboards — sustainability stops being invisible when you can see your friends doing it too.
What we learned
- Real-time energy data is messier than we expected — APIs go down, data arrives late, prices occasionally go negative. Building for reliability matters as much as building for features.
- Deep reasoning models like K2 Think v2 shine when you give them structured, real data to reason over. The quality gap between
"here's a generic prompt"and"here's 3 hours of 5-minute interval data with fuel mix breakdowns"is massive. - Gamification needs fair math. If your streak system punishes users for things outside their control (grid conditions), they stop caring. The rolling median made it feel achievable.
- Two-tier LLM routing is worth the complexity — users expect instant responses for simple questions but appreciate depth for real analysis.
What's next
- Expand beyond ComEd to support more utilities and ISOs nationwide.
- Smart home integrations — automatically shift smart plugs, thermostats, and EV chargers to green windows.
- Bill forecasting — predict next month's bill based on your usage patterns and projected grid conditions.
- Mobile app with native push notifications.
- Team/household mode — track and compete as a family, not just individuals.
Built With
- 18+
- comed-5-minute-pricing-api
- fastapi
- gridstatus.io-(pjm-fuel-mix)
- httpx
- javascript
- k2-think-v2-(mbzuai)
- lava
- lava-gateway
- mongodb-atlas
- mongodb-atlas-(time-series-collections)
- next.js-15
- node.js
- pandas
- postgresql
- pydantic
- python
- react-19
- recharts
- slack-events-api
- slack-socket-mode
- sql
- supabase
- tailwind-css-4
- typescript
- vercel


Log in or sign up for Devpost to join the conversation.