-
-
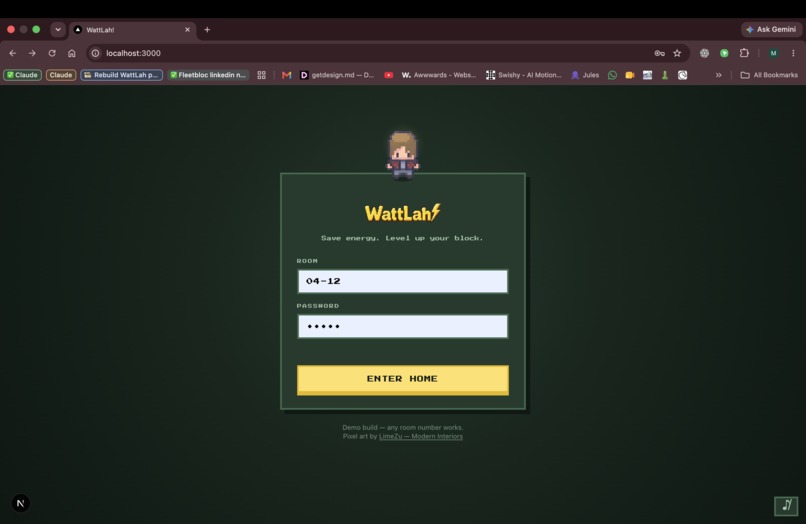
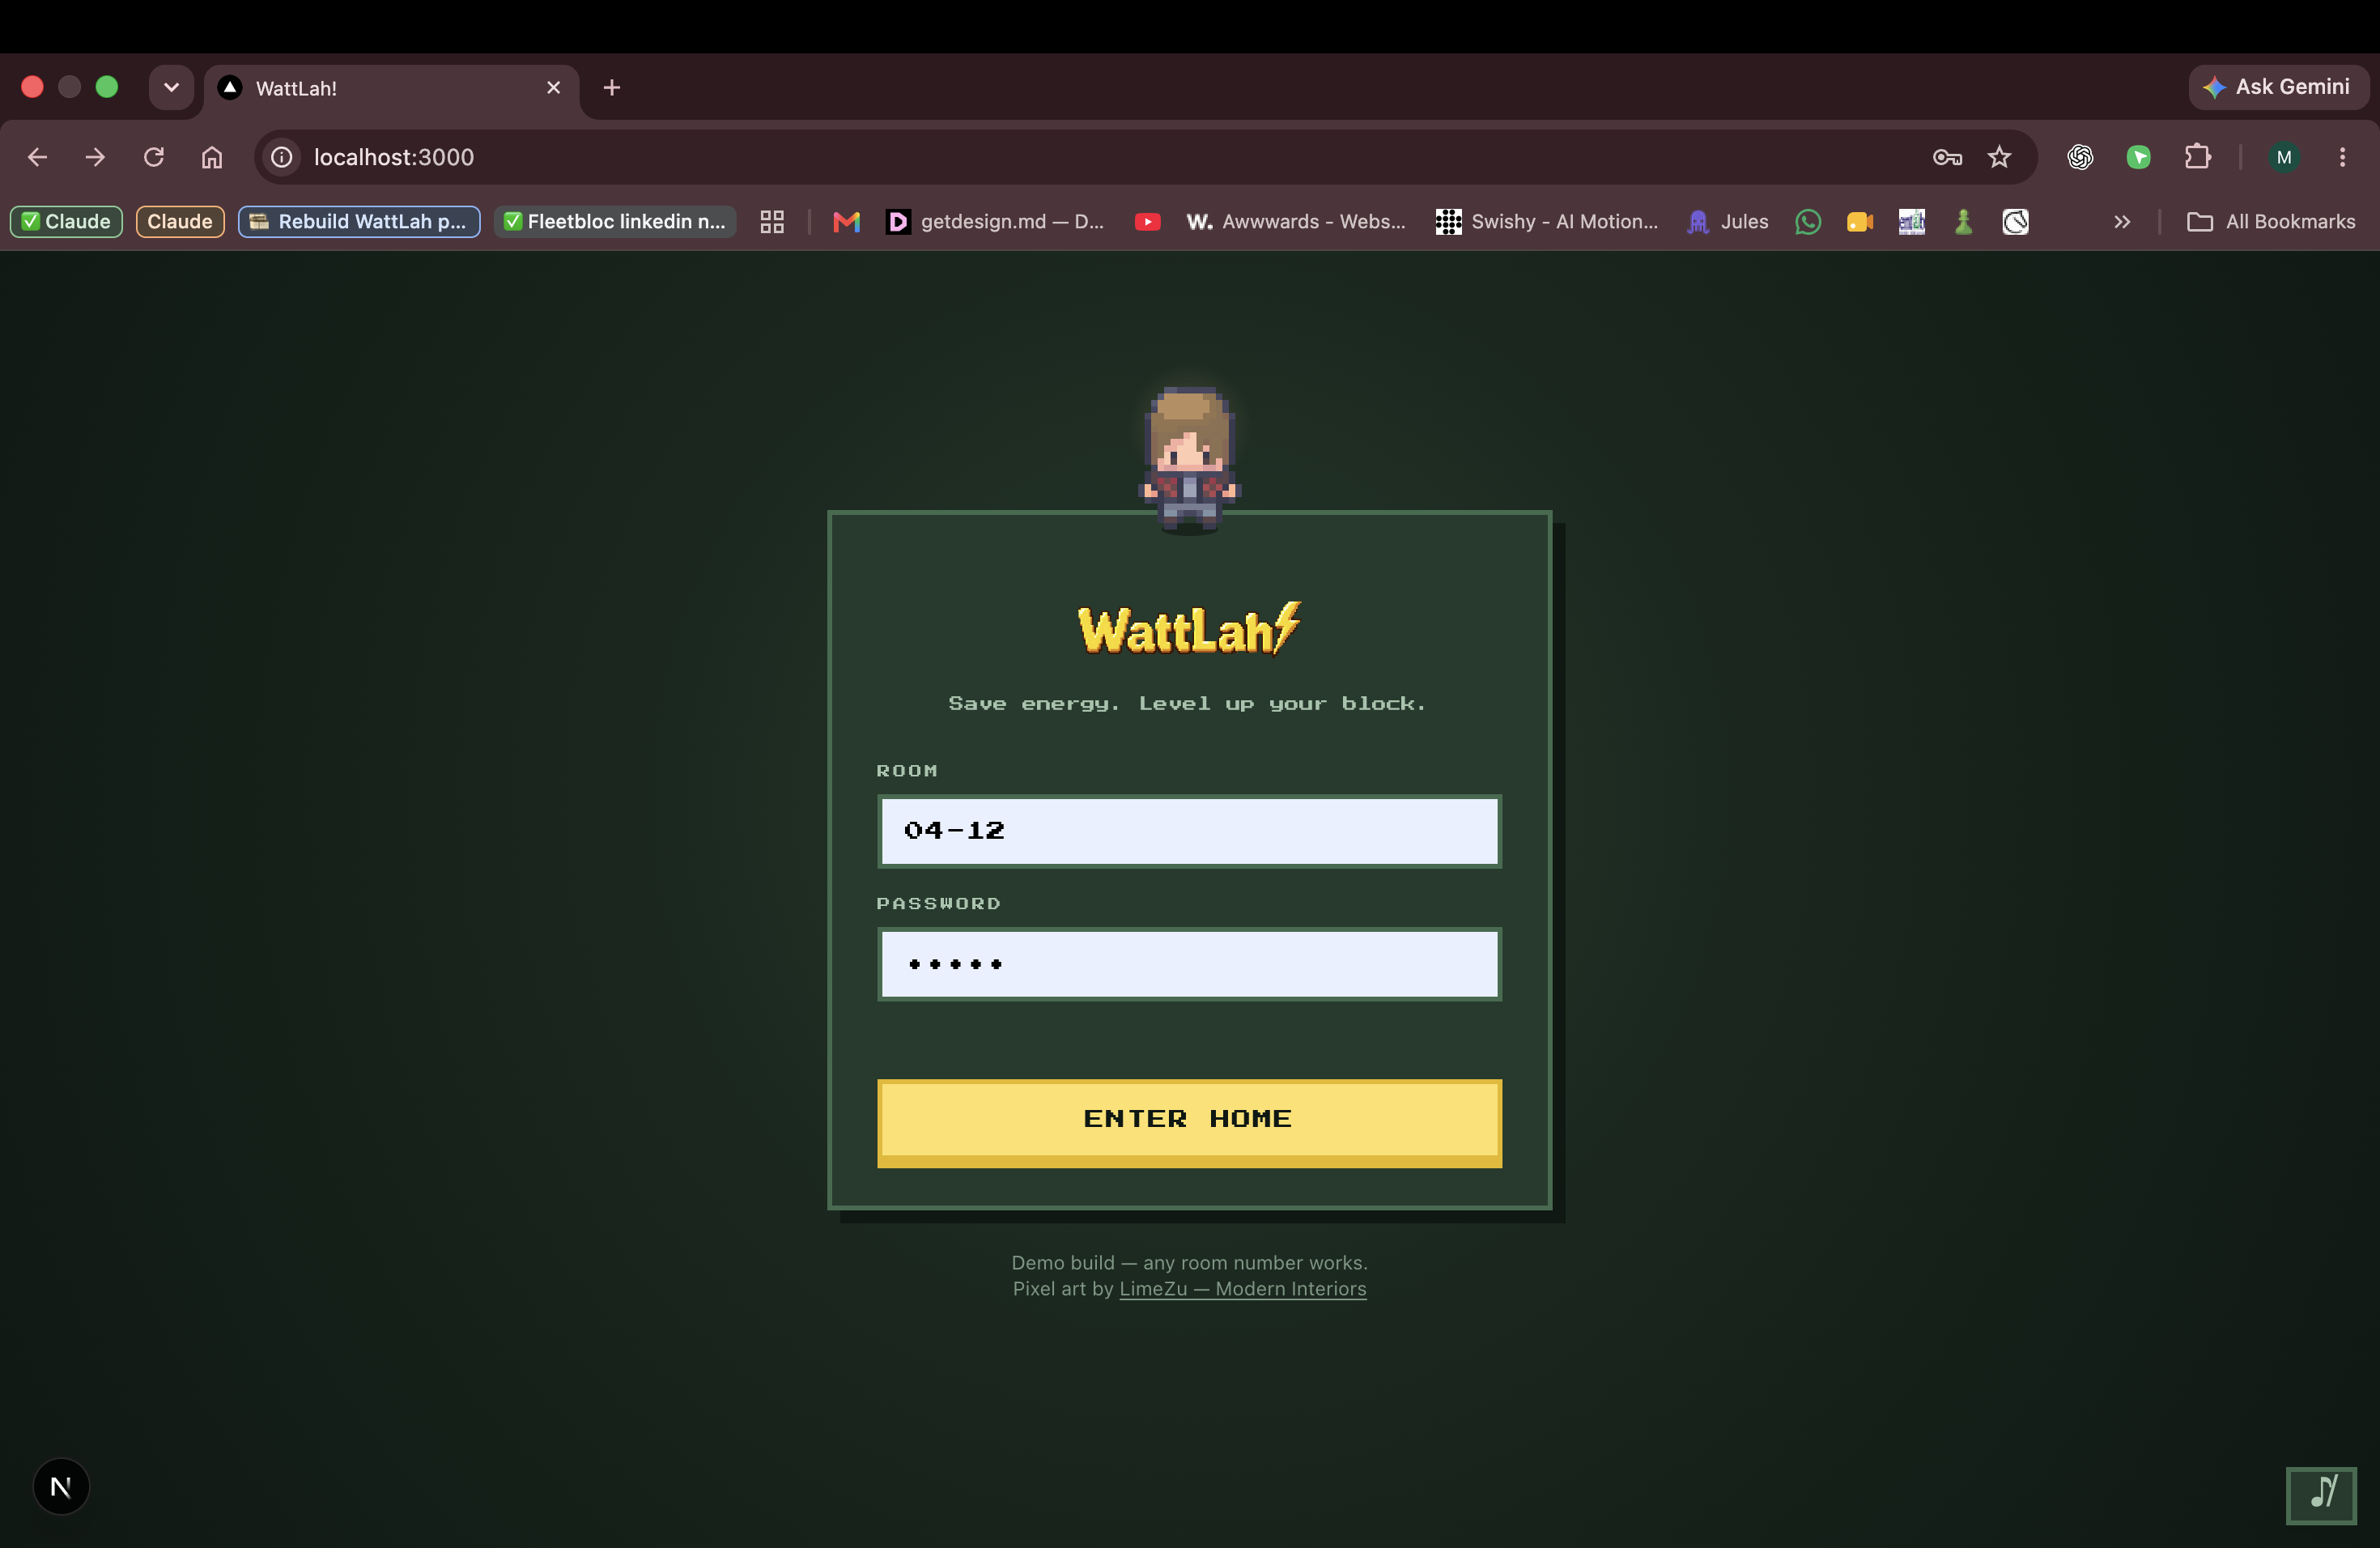
A room number gets you in. No account, no setup, no seventeen-step onboarding.
-
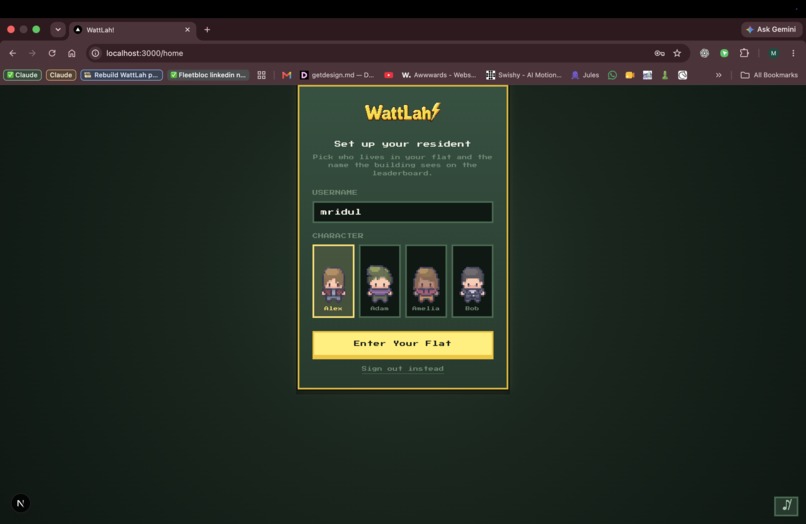
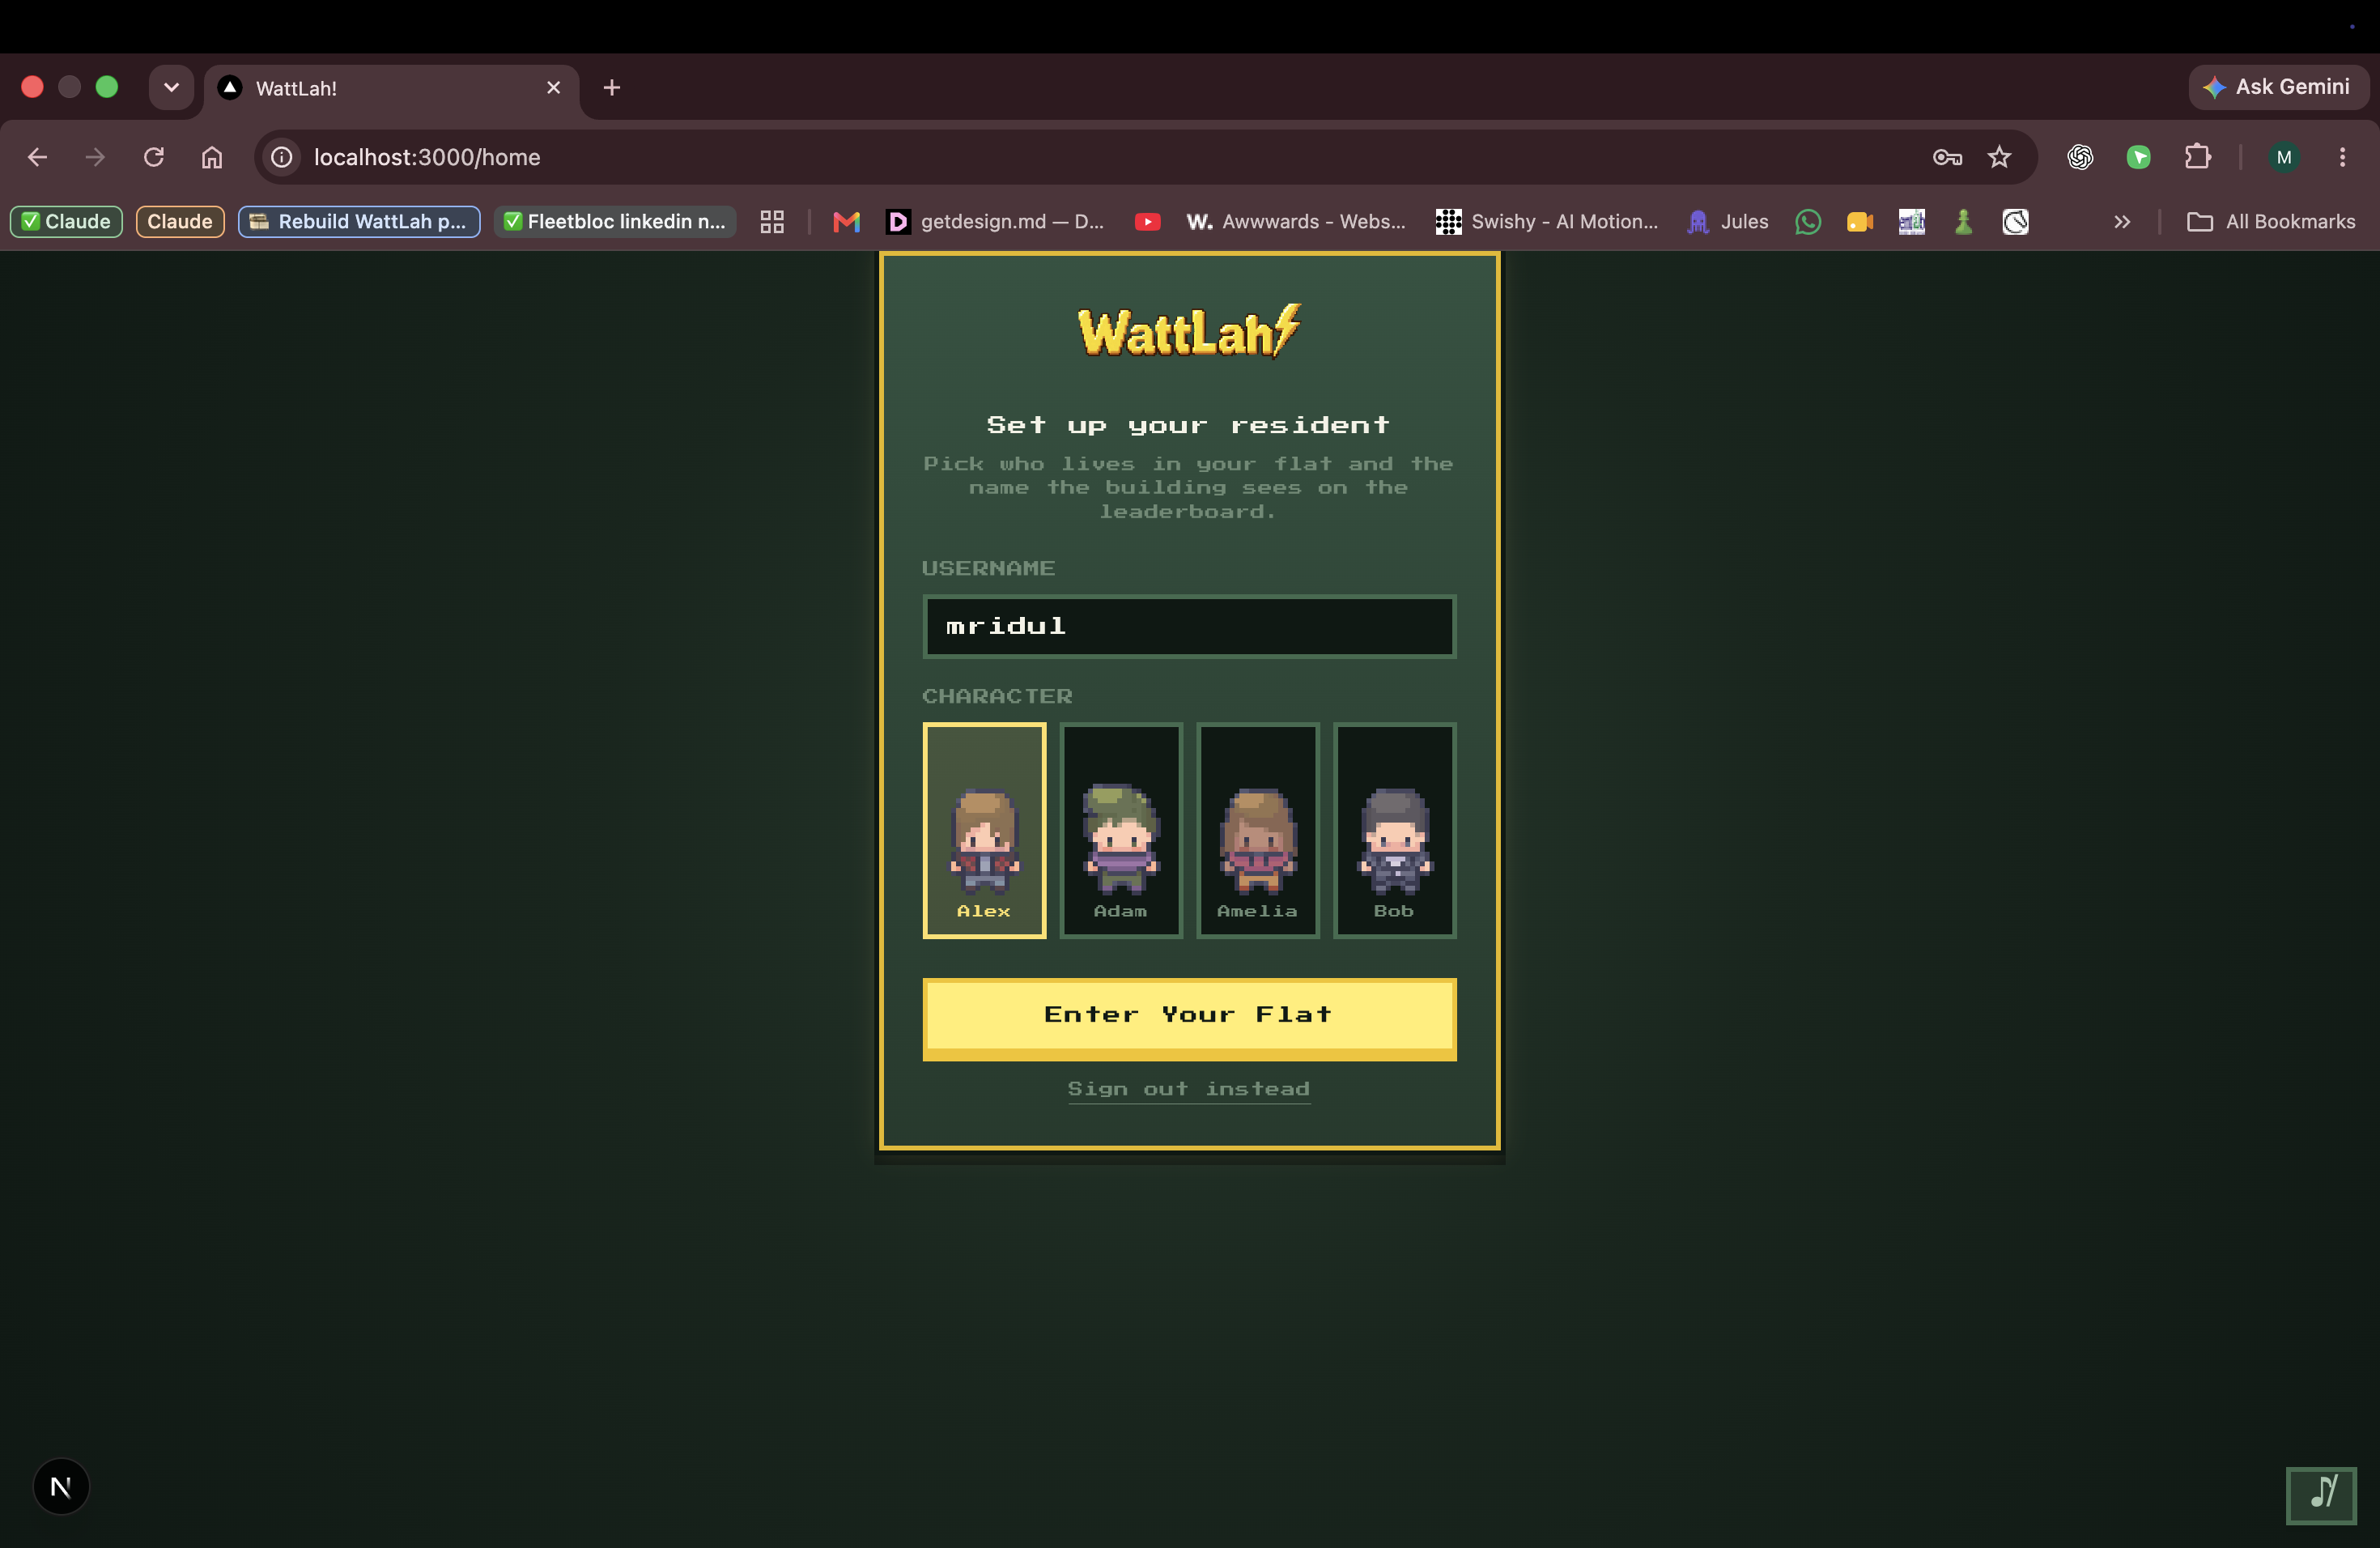
Pick your resident and the handle your block sees — never your unit number.
-
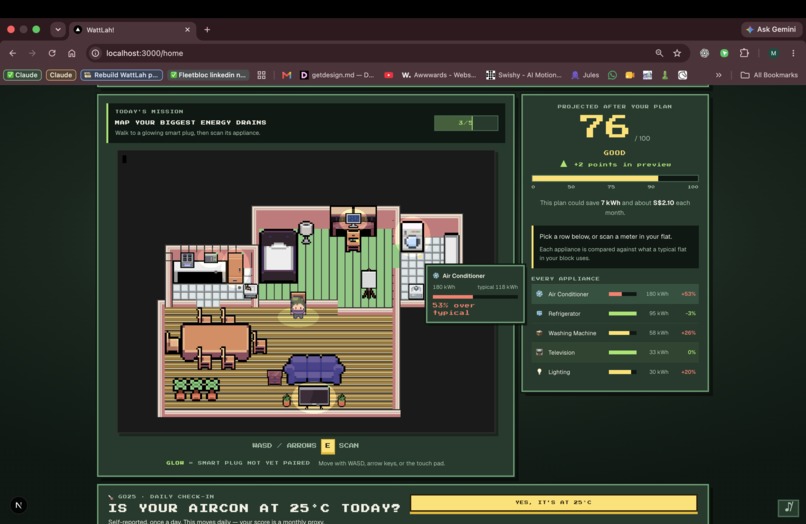
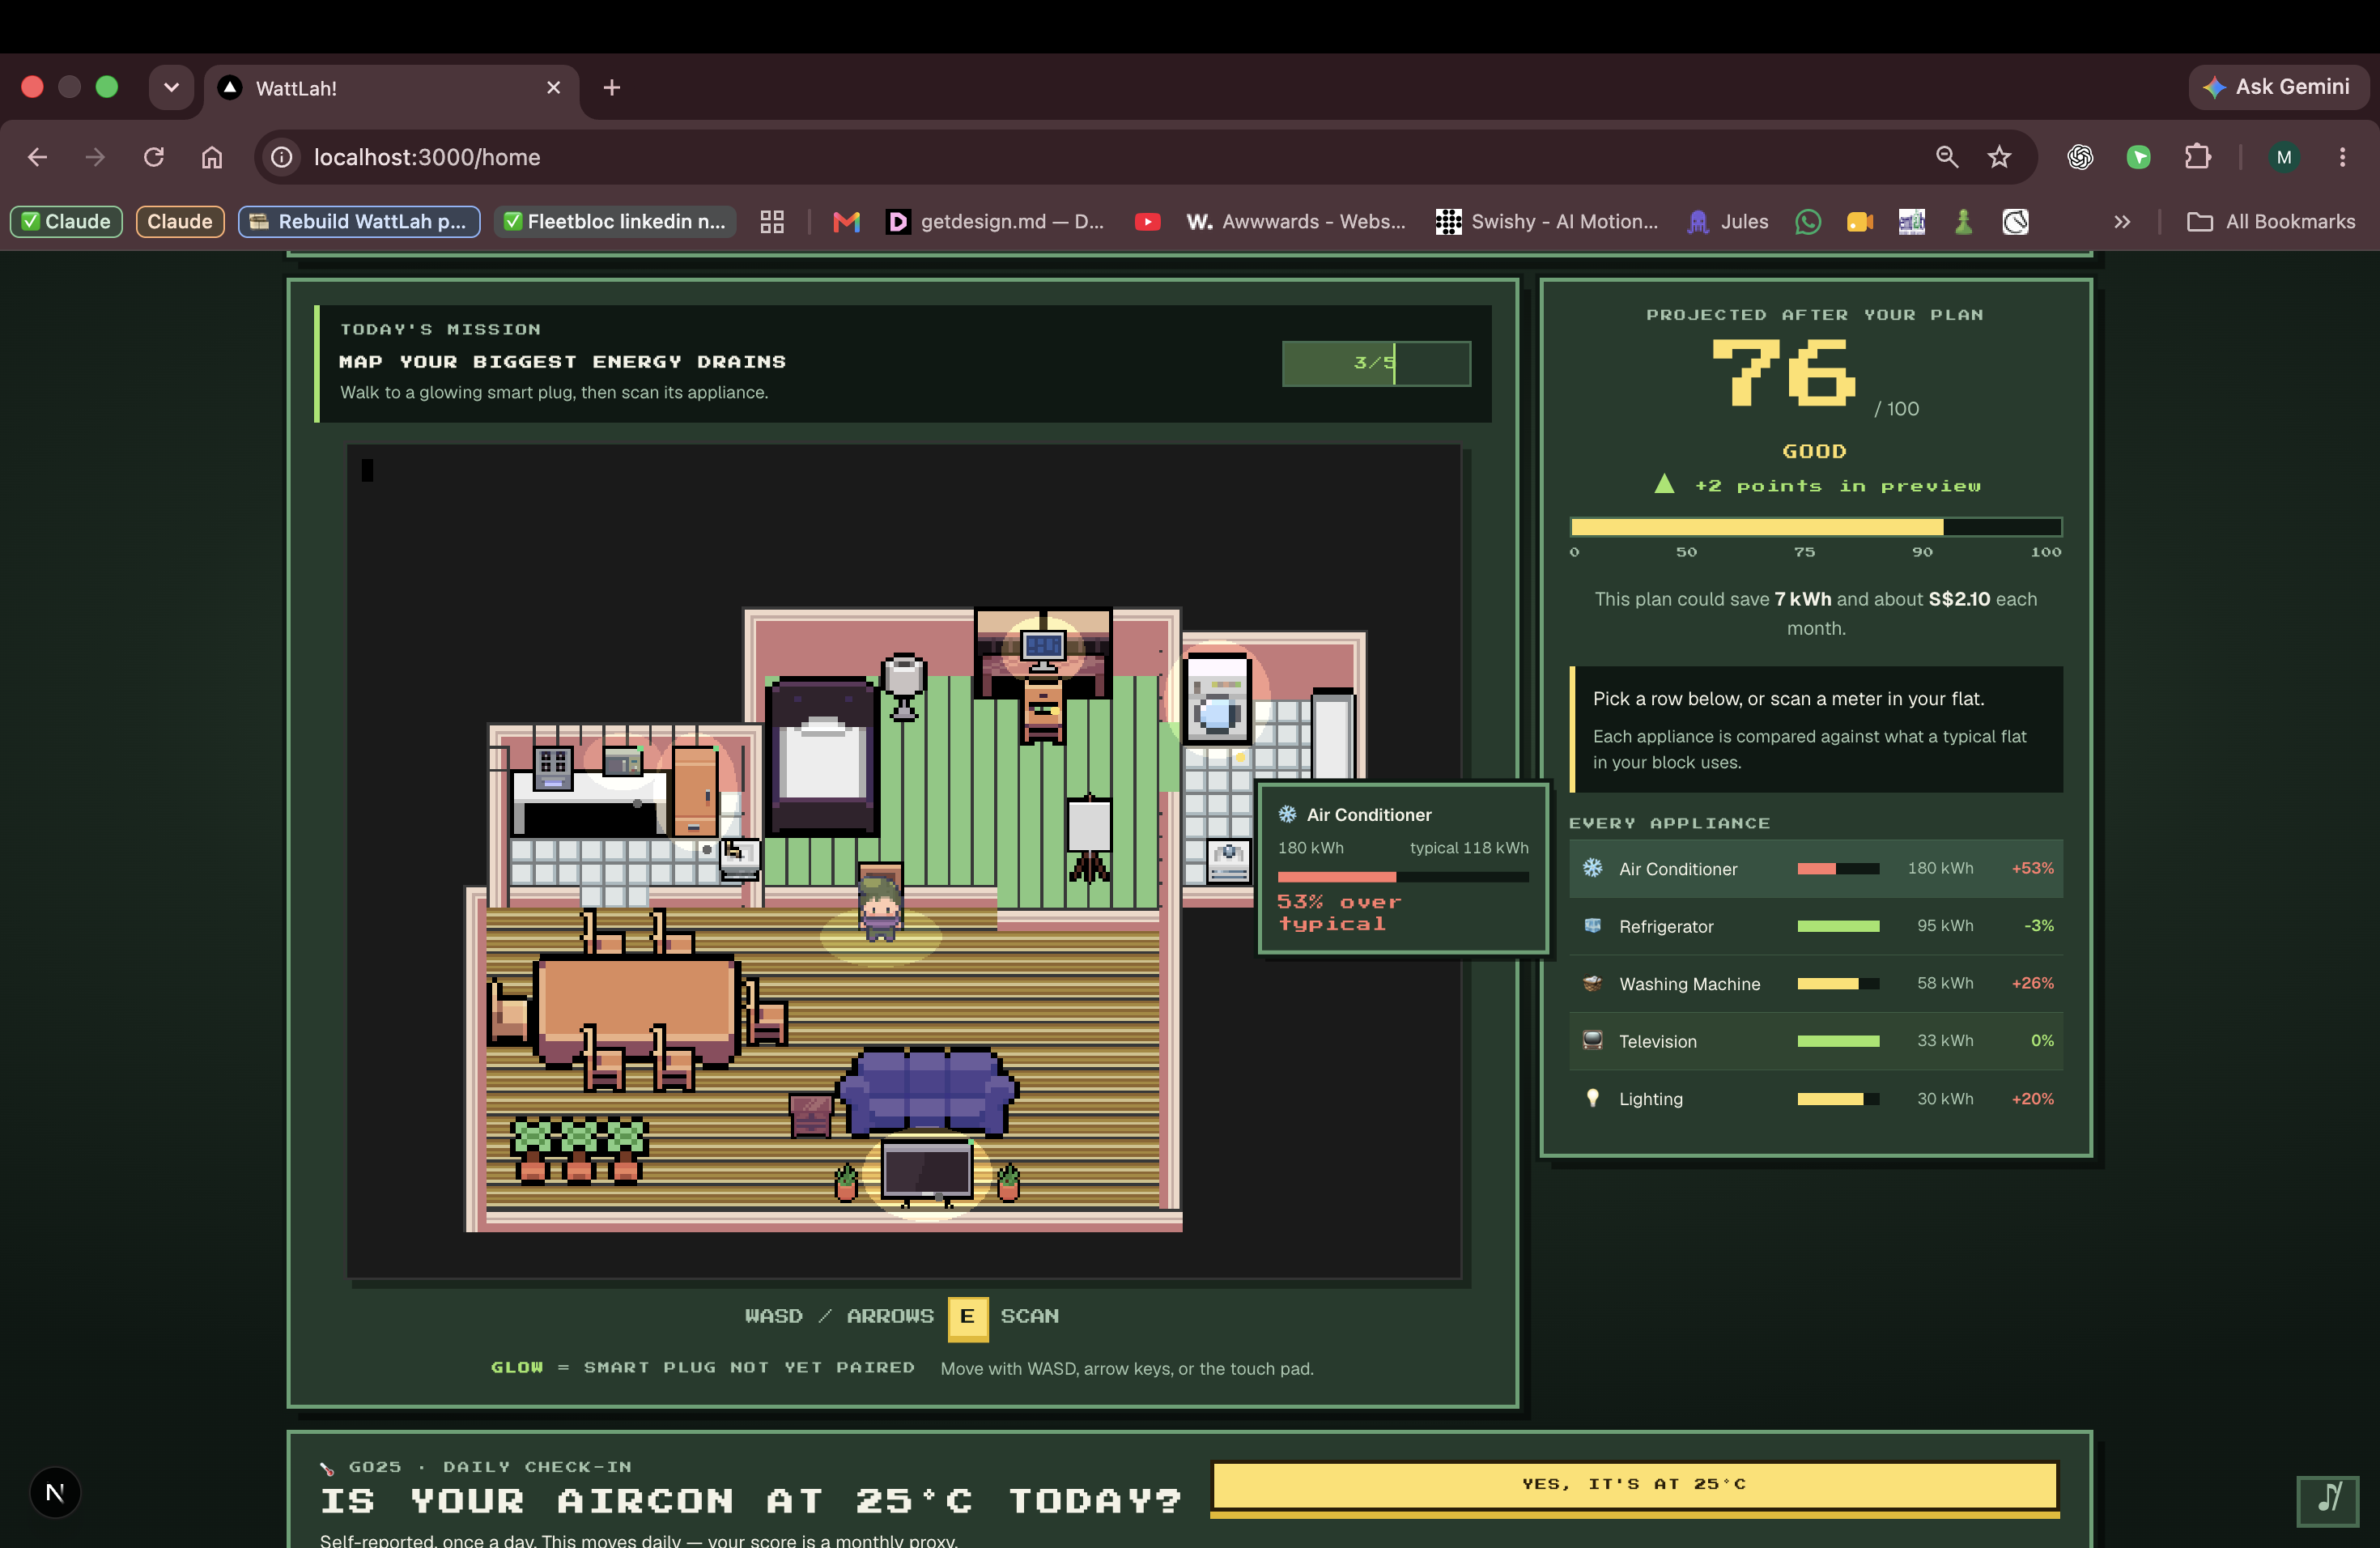
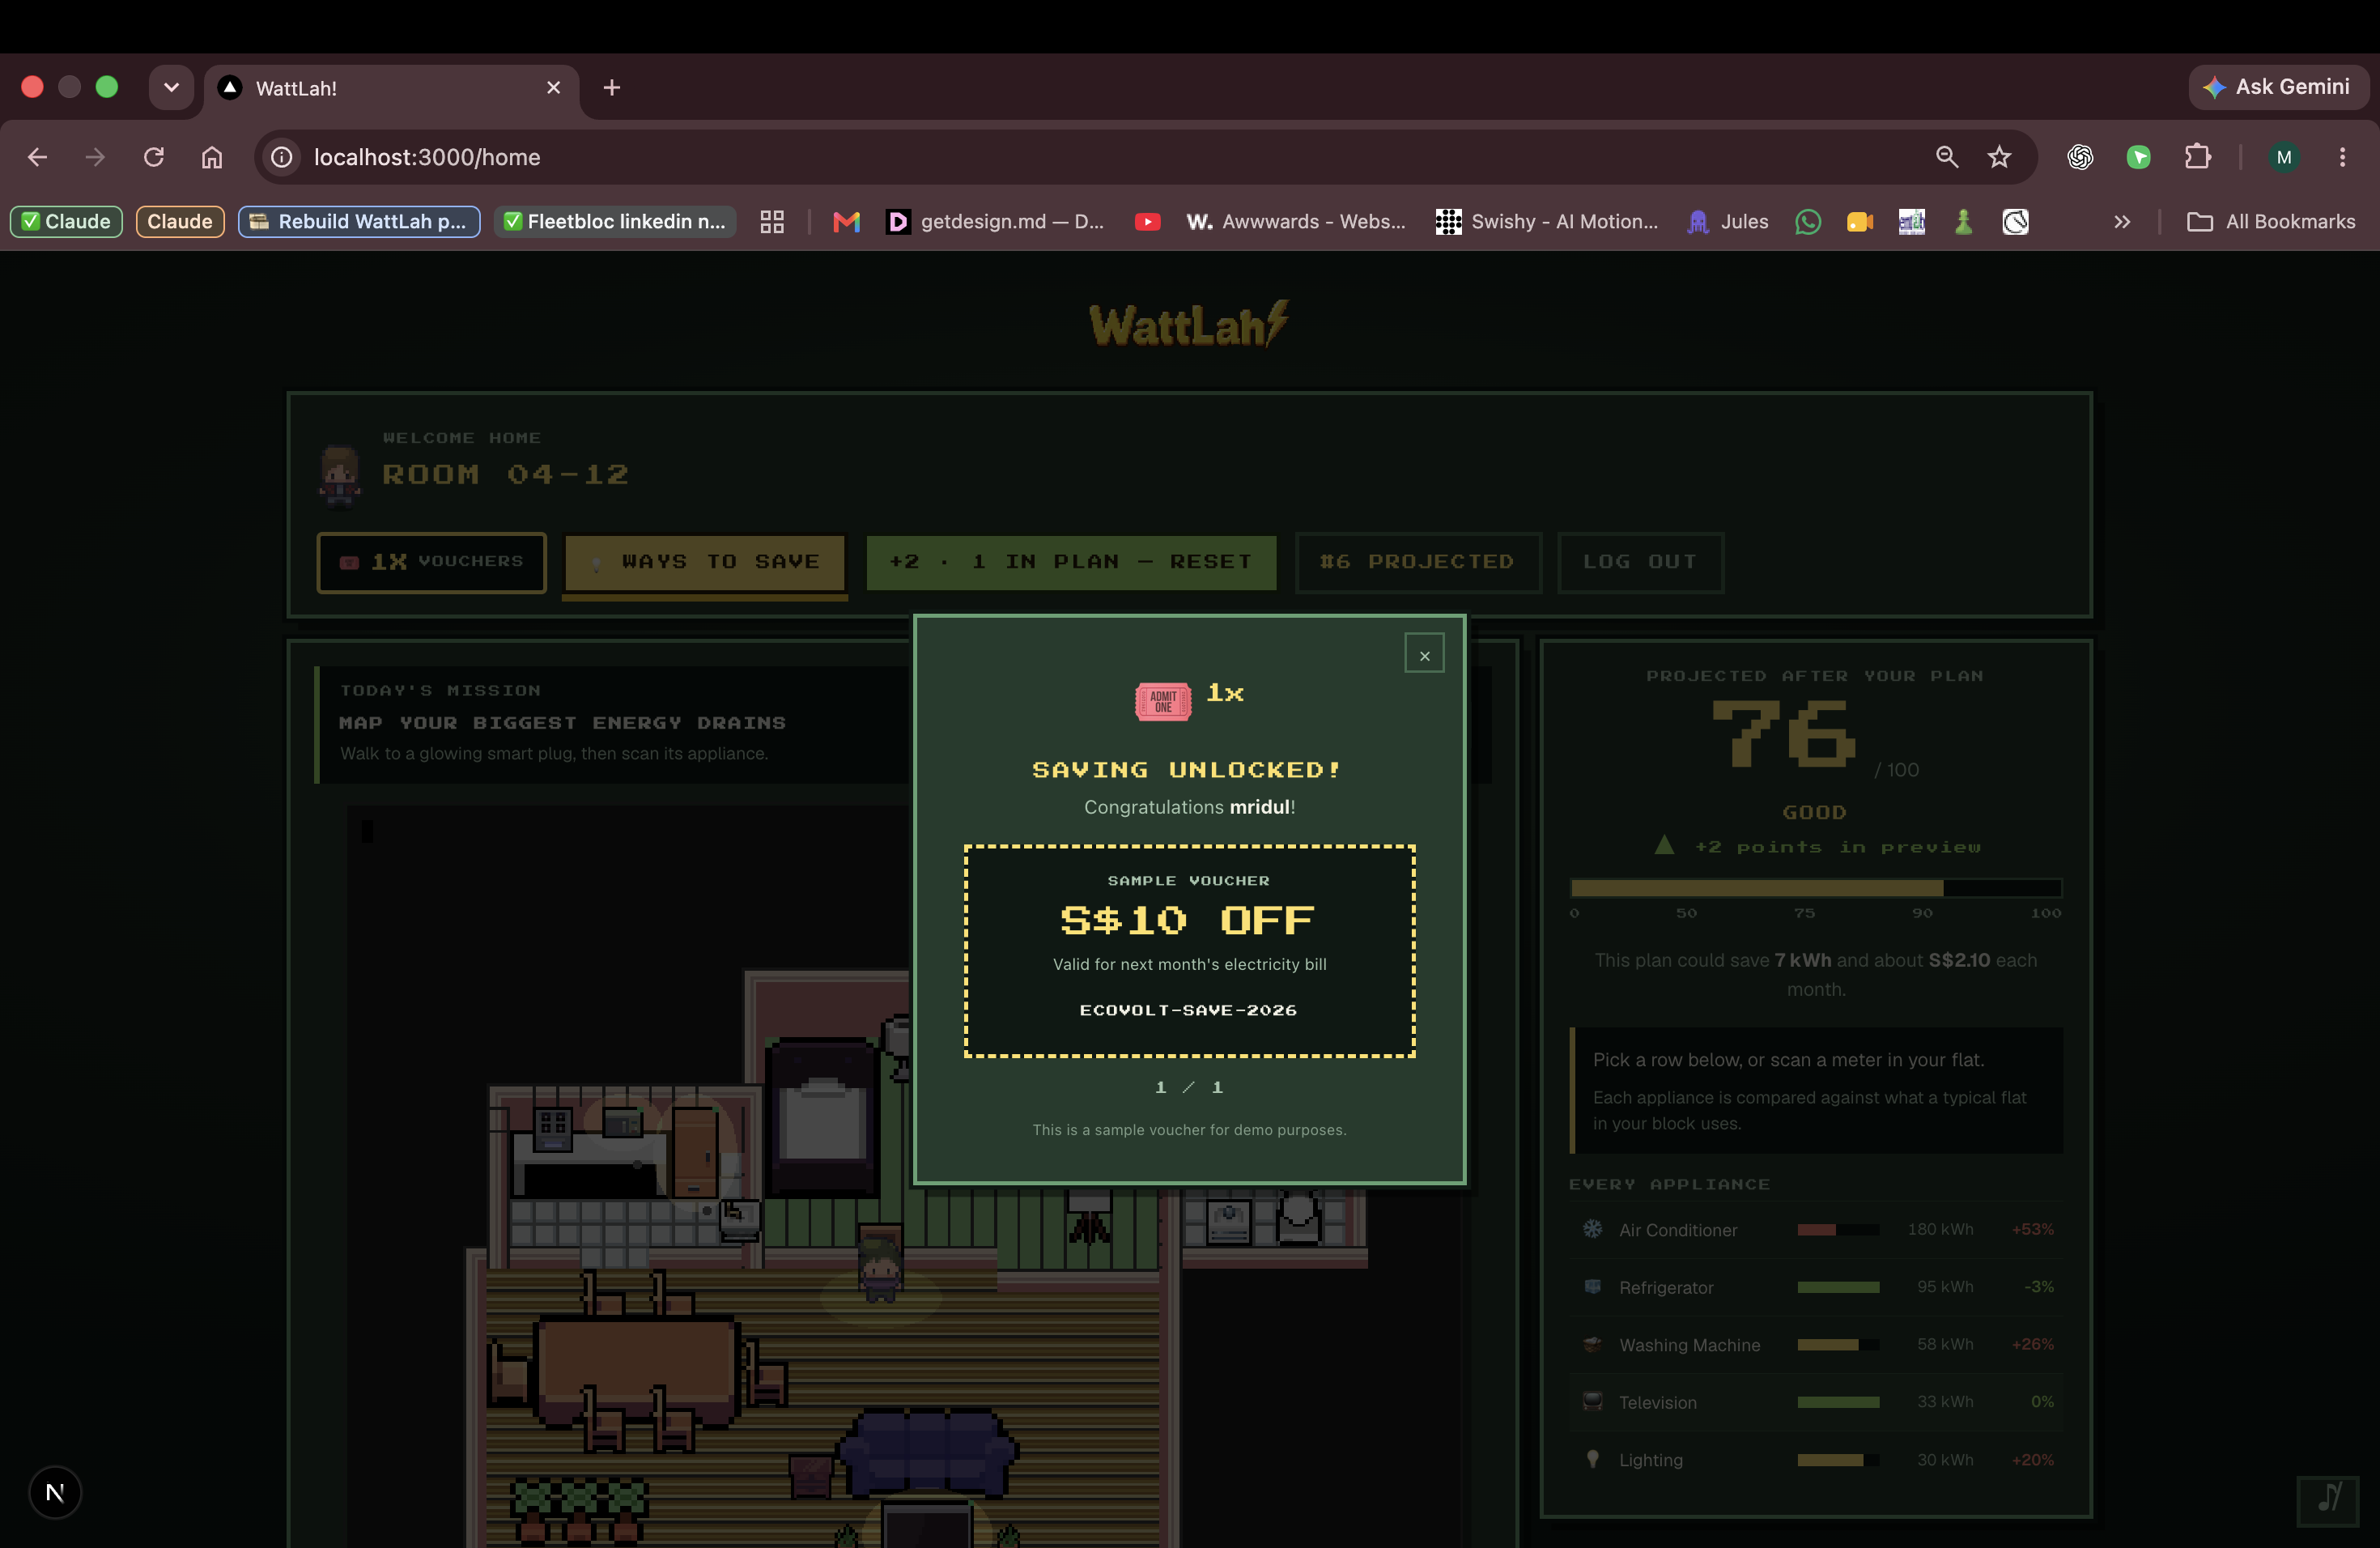
Your flat, not a chart. The air conditioner names itself: 180 kWh against a typical 118.
-
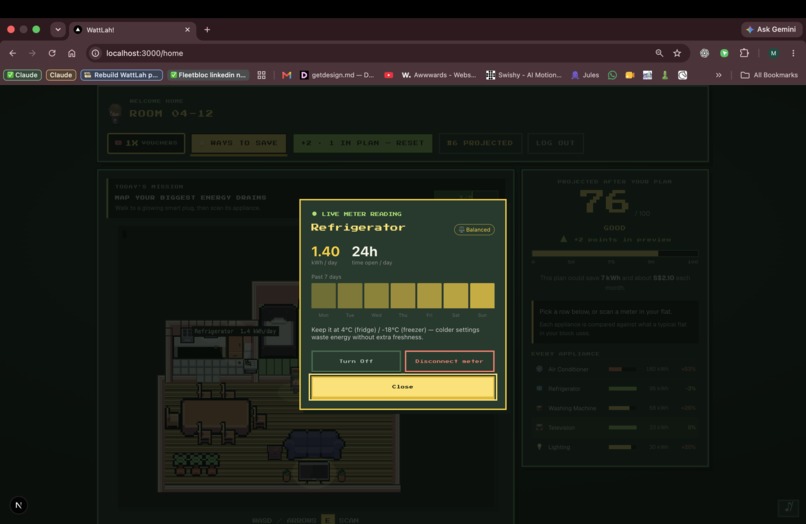
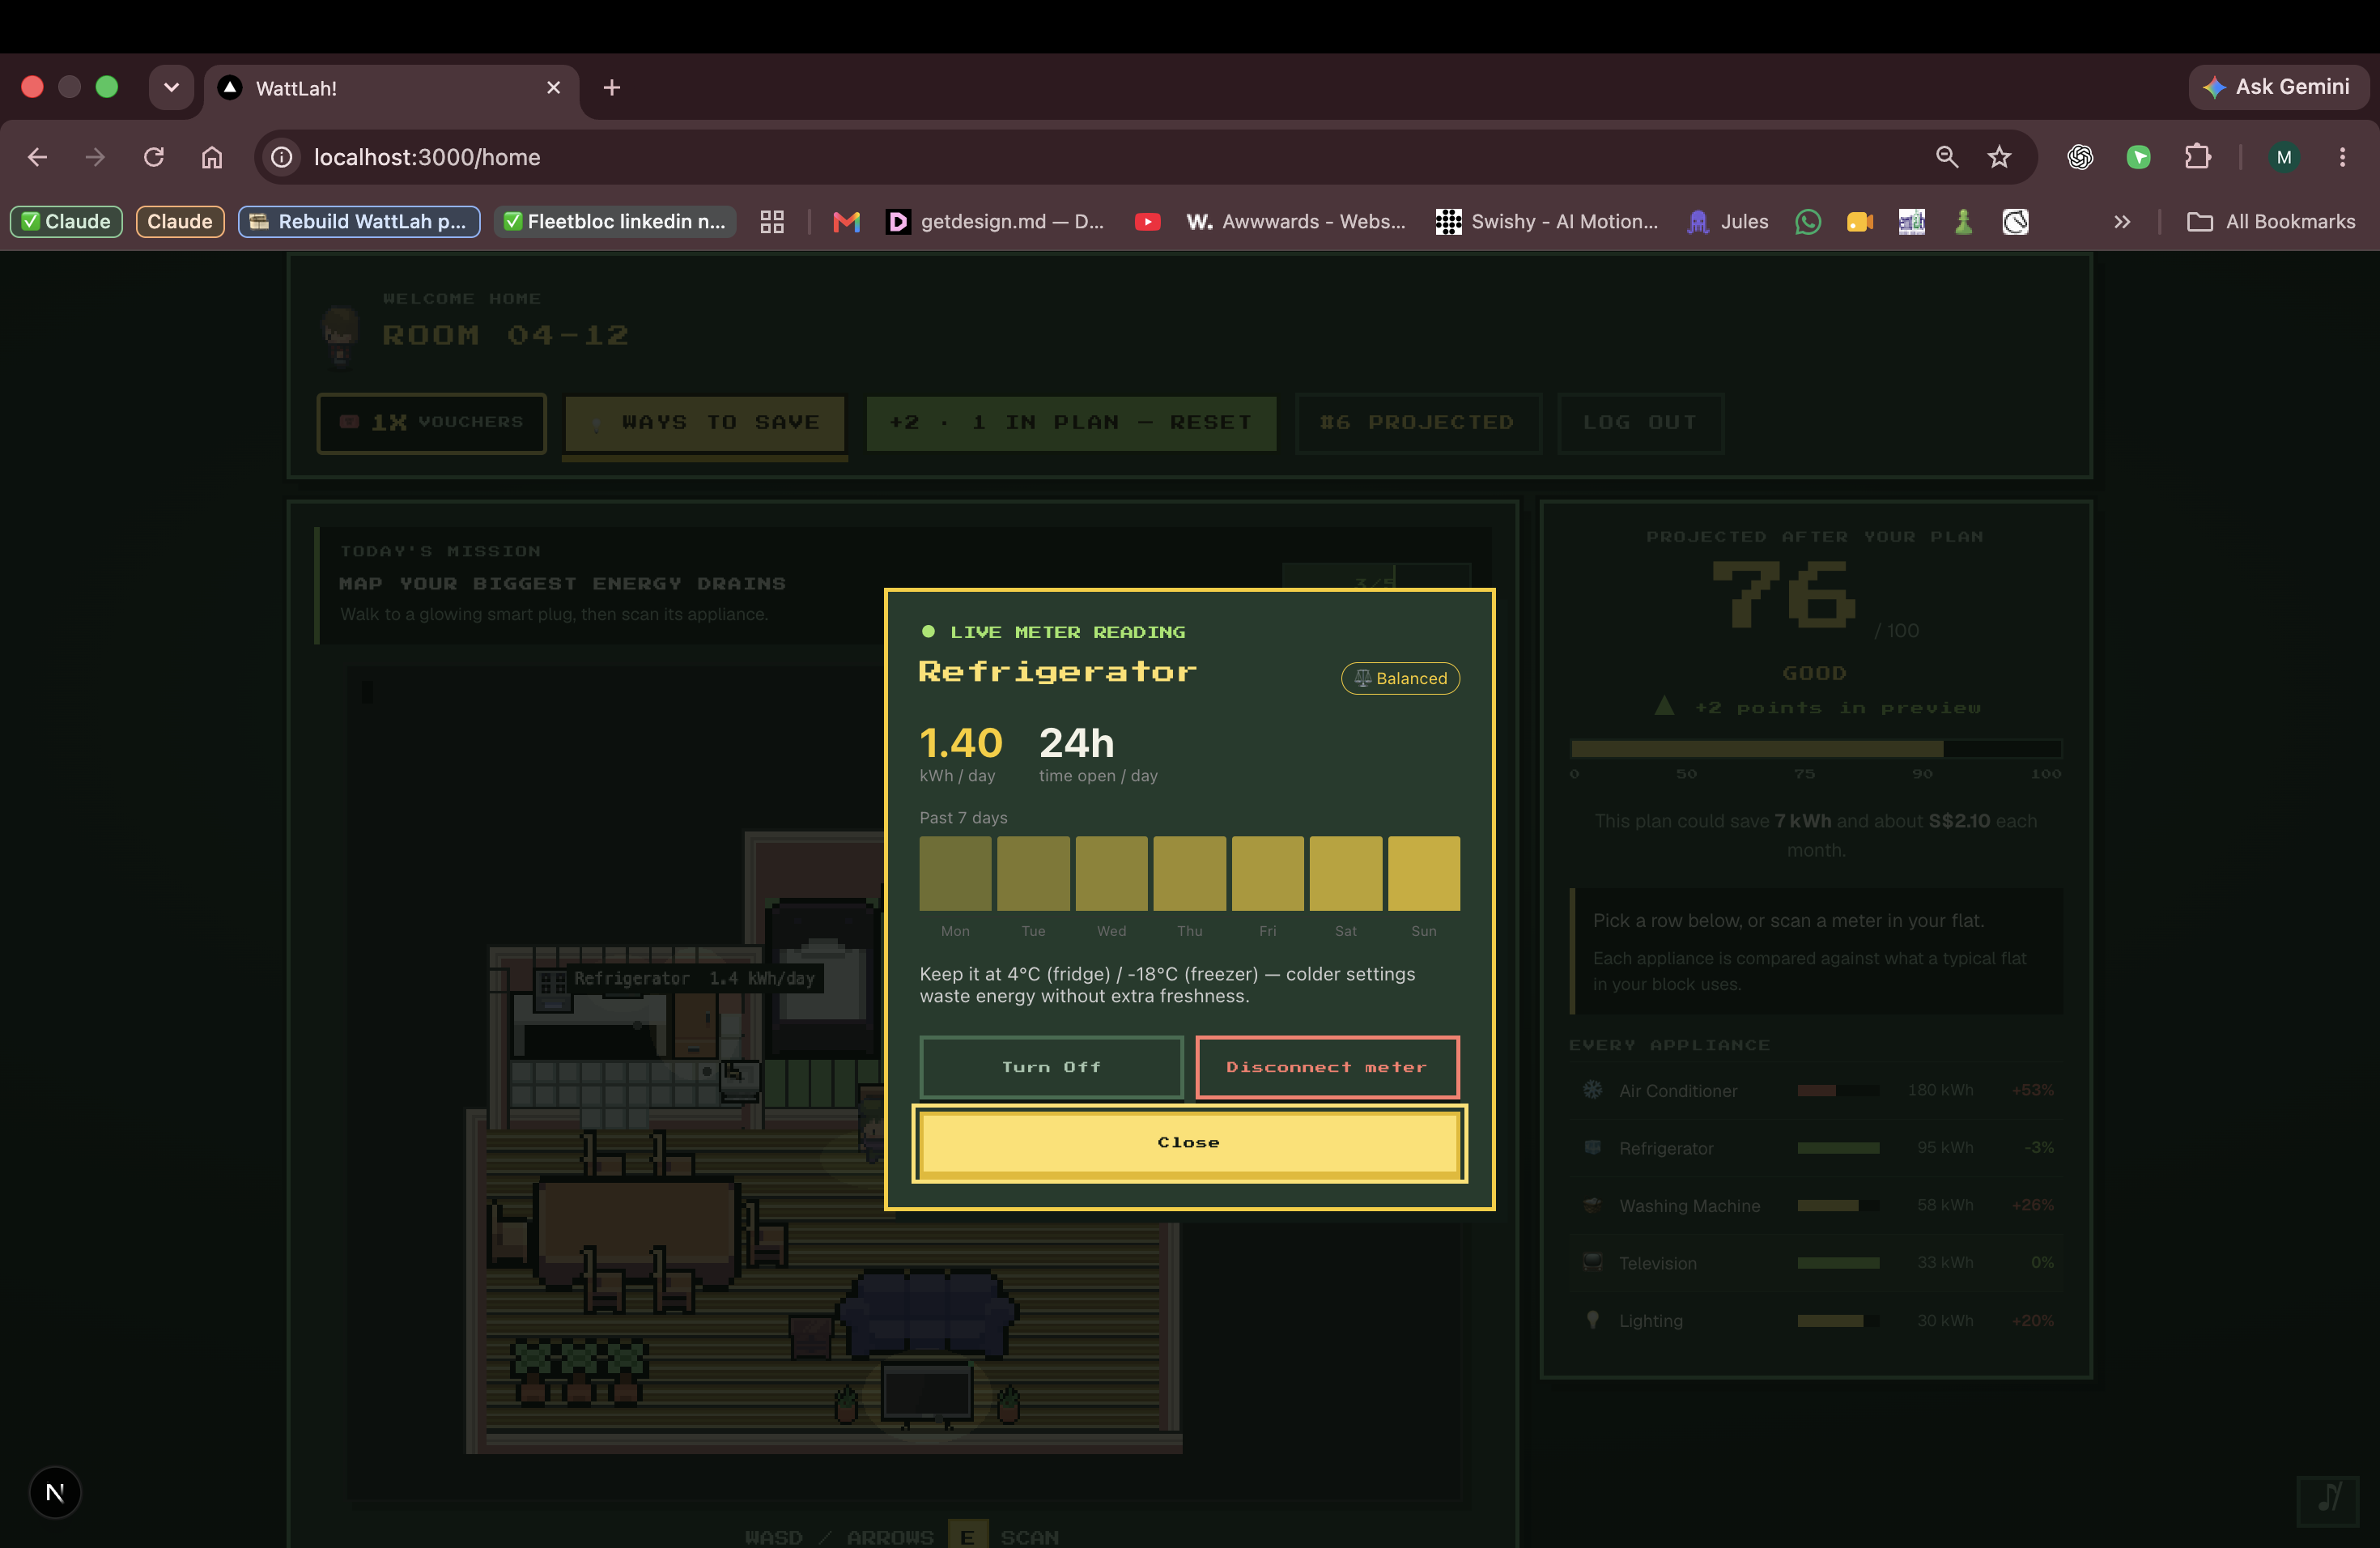
A live reading per appliance: 1.4 kWh a day, with the fix in one plain sentence.
-
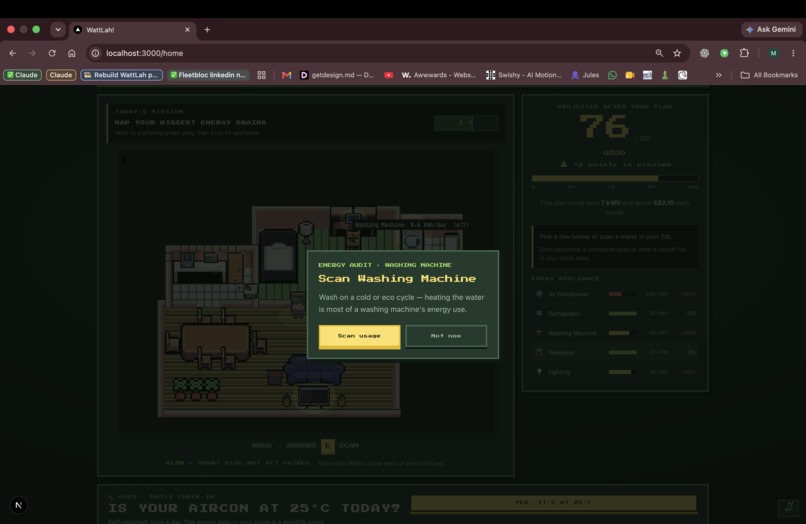
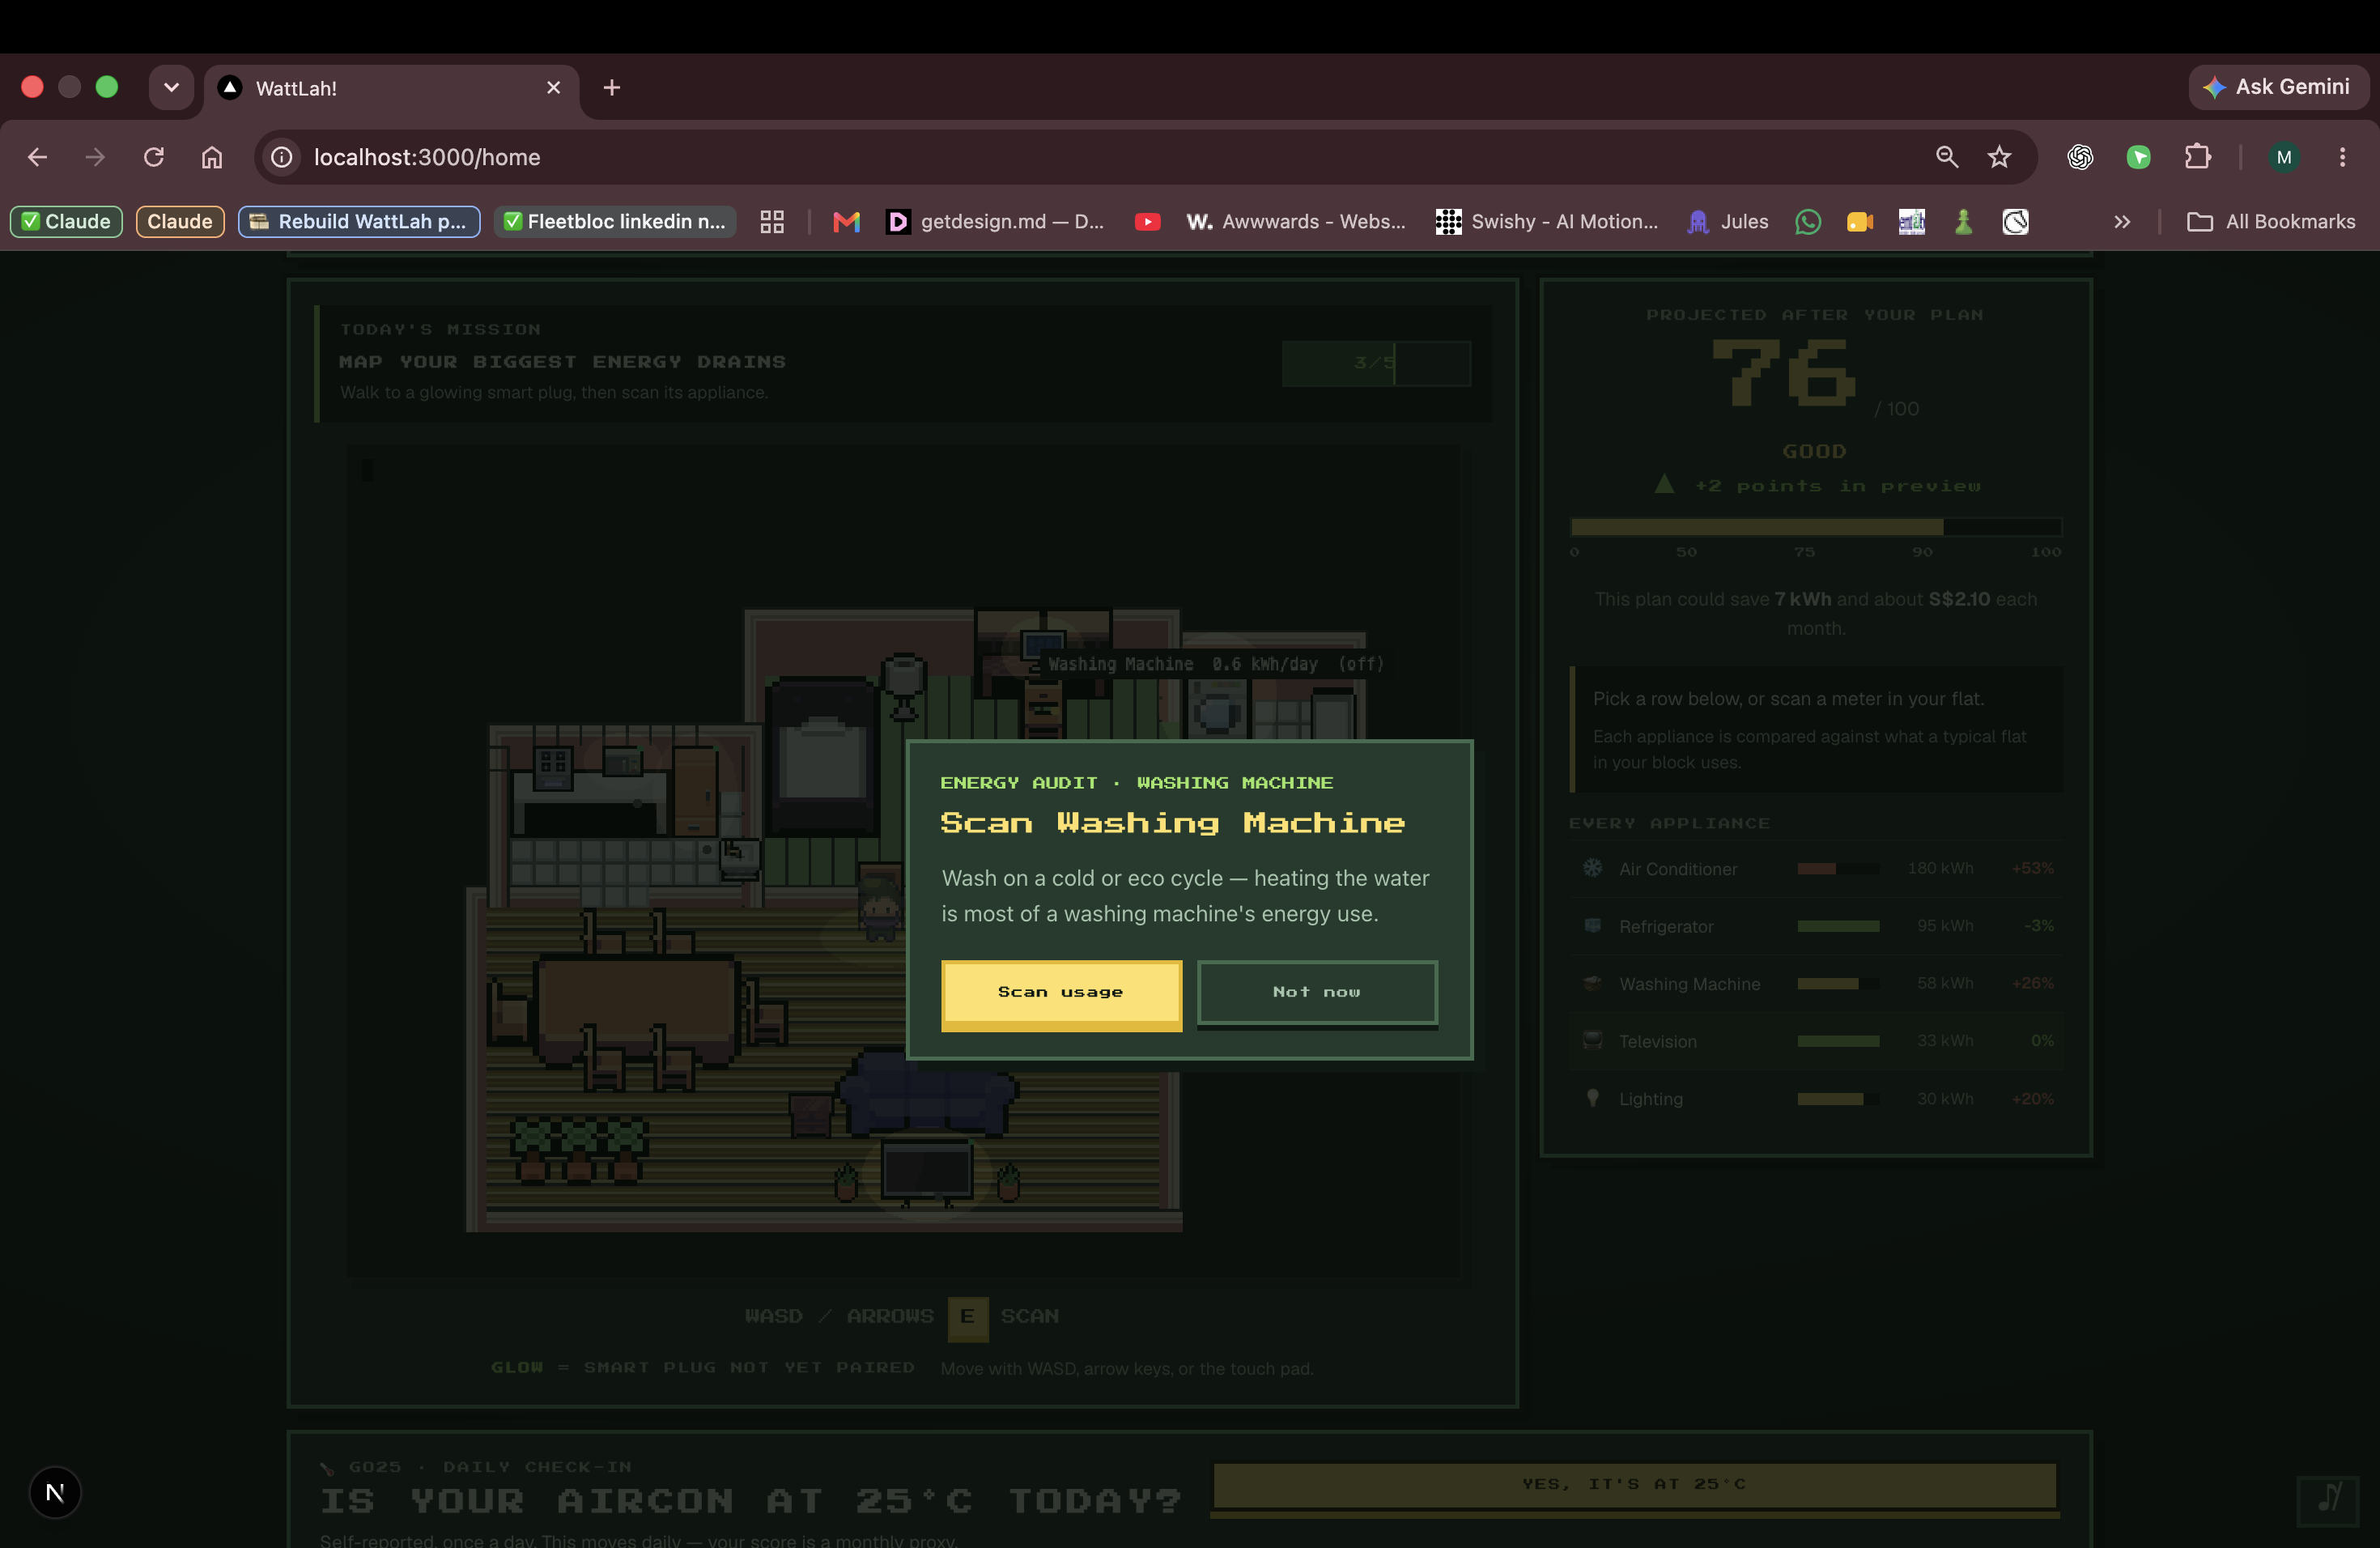
Every socket hides a fix — heating the water, not the spinning, is where a washer's energy goes.
-
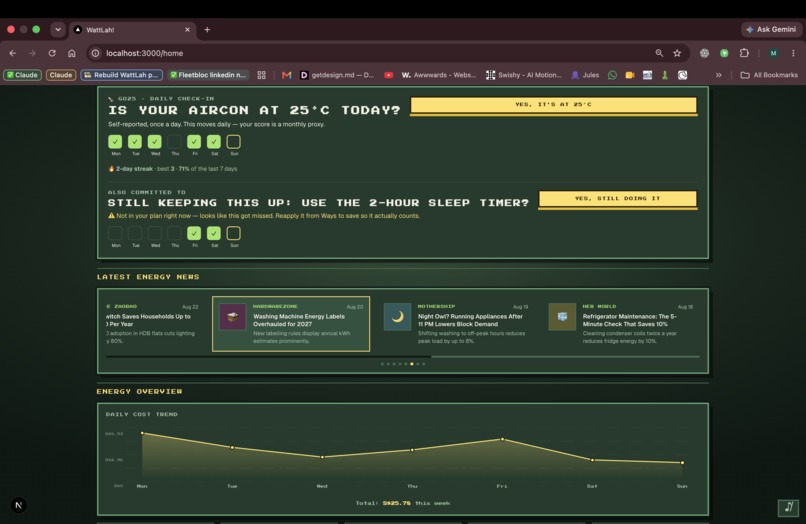
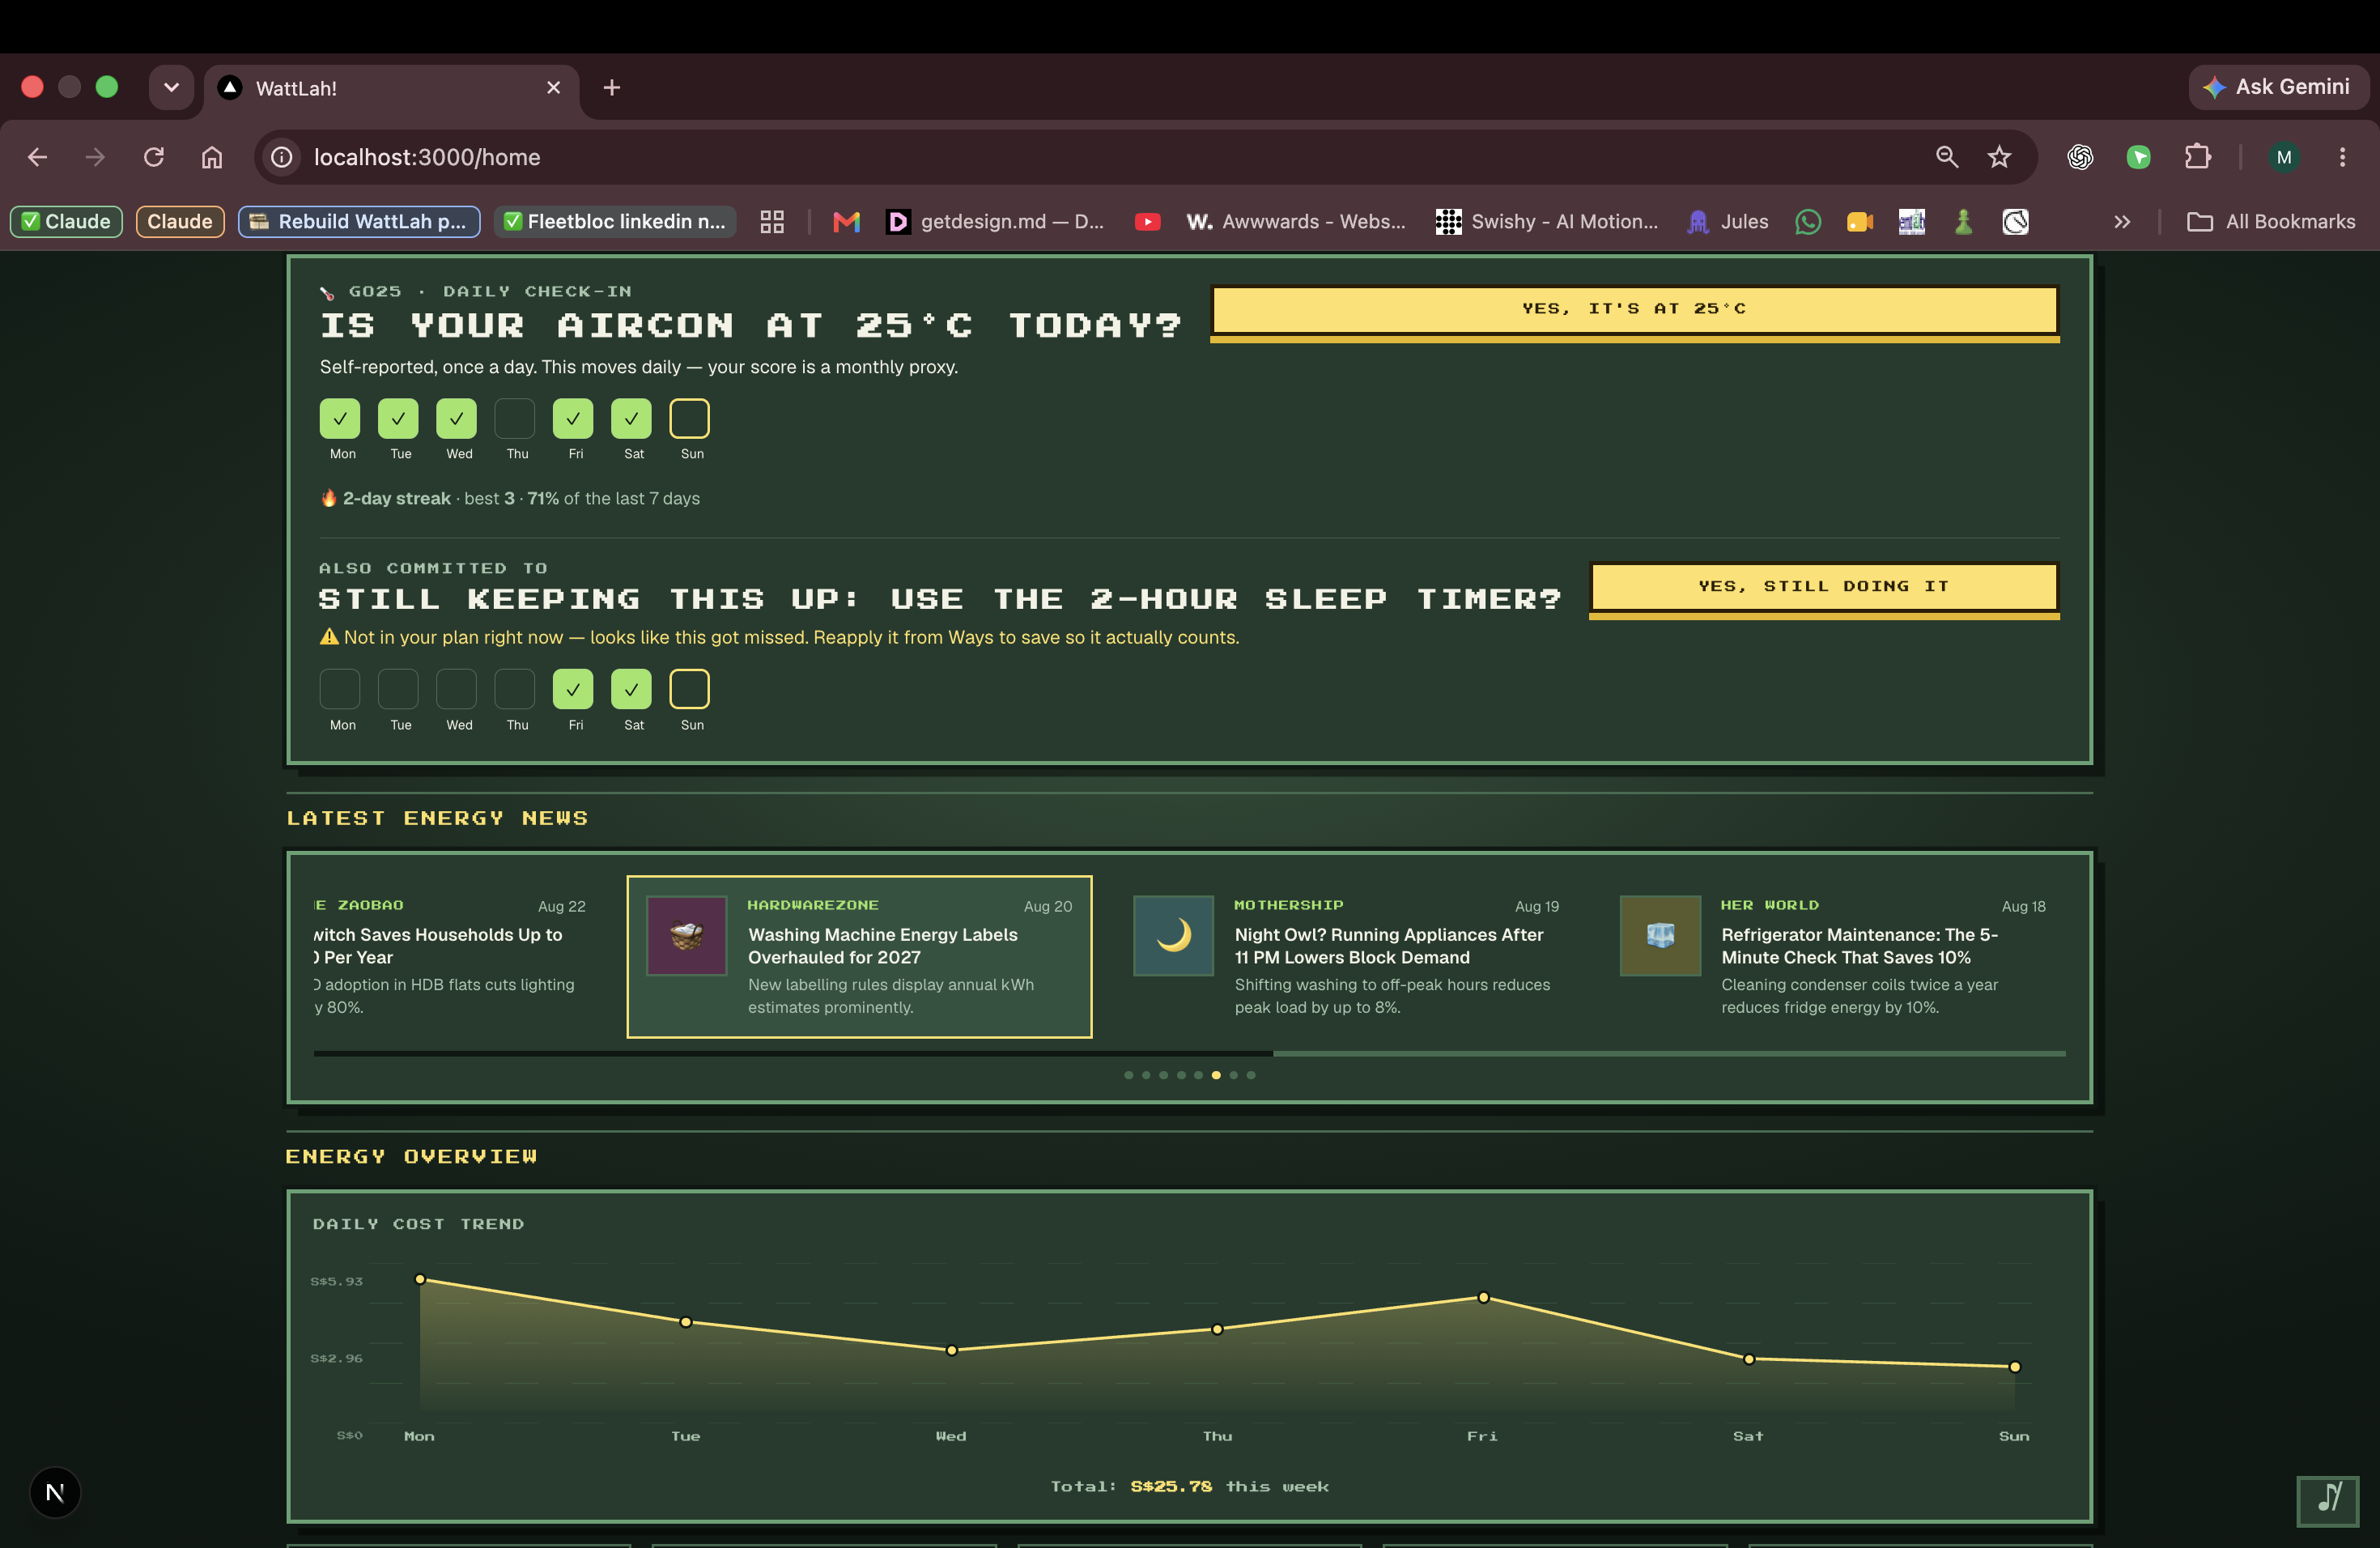
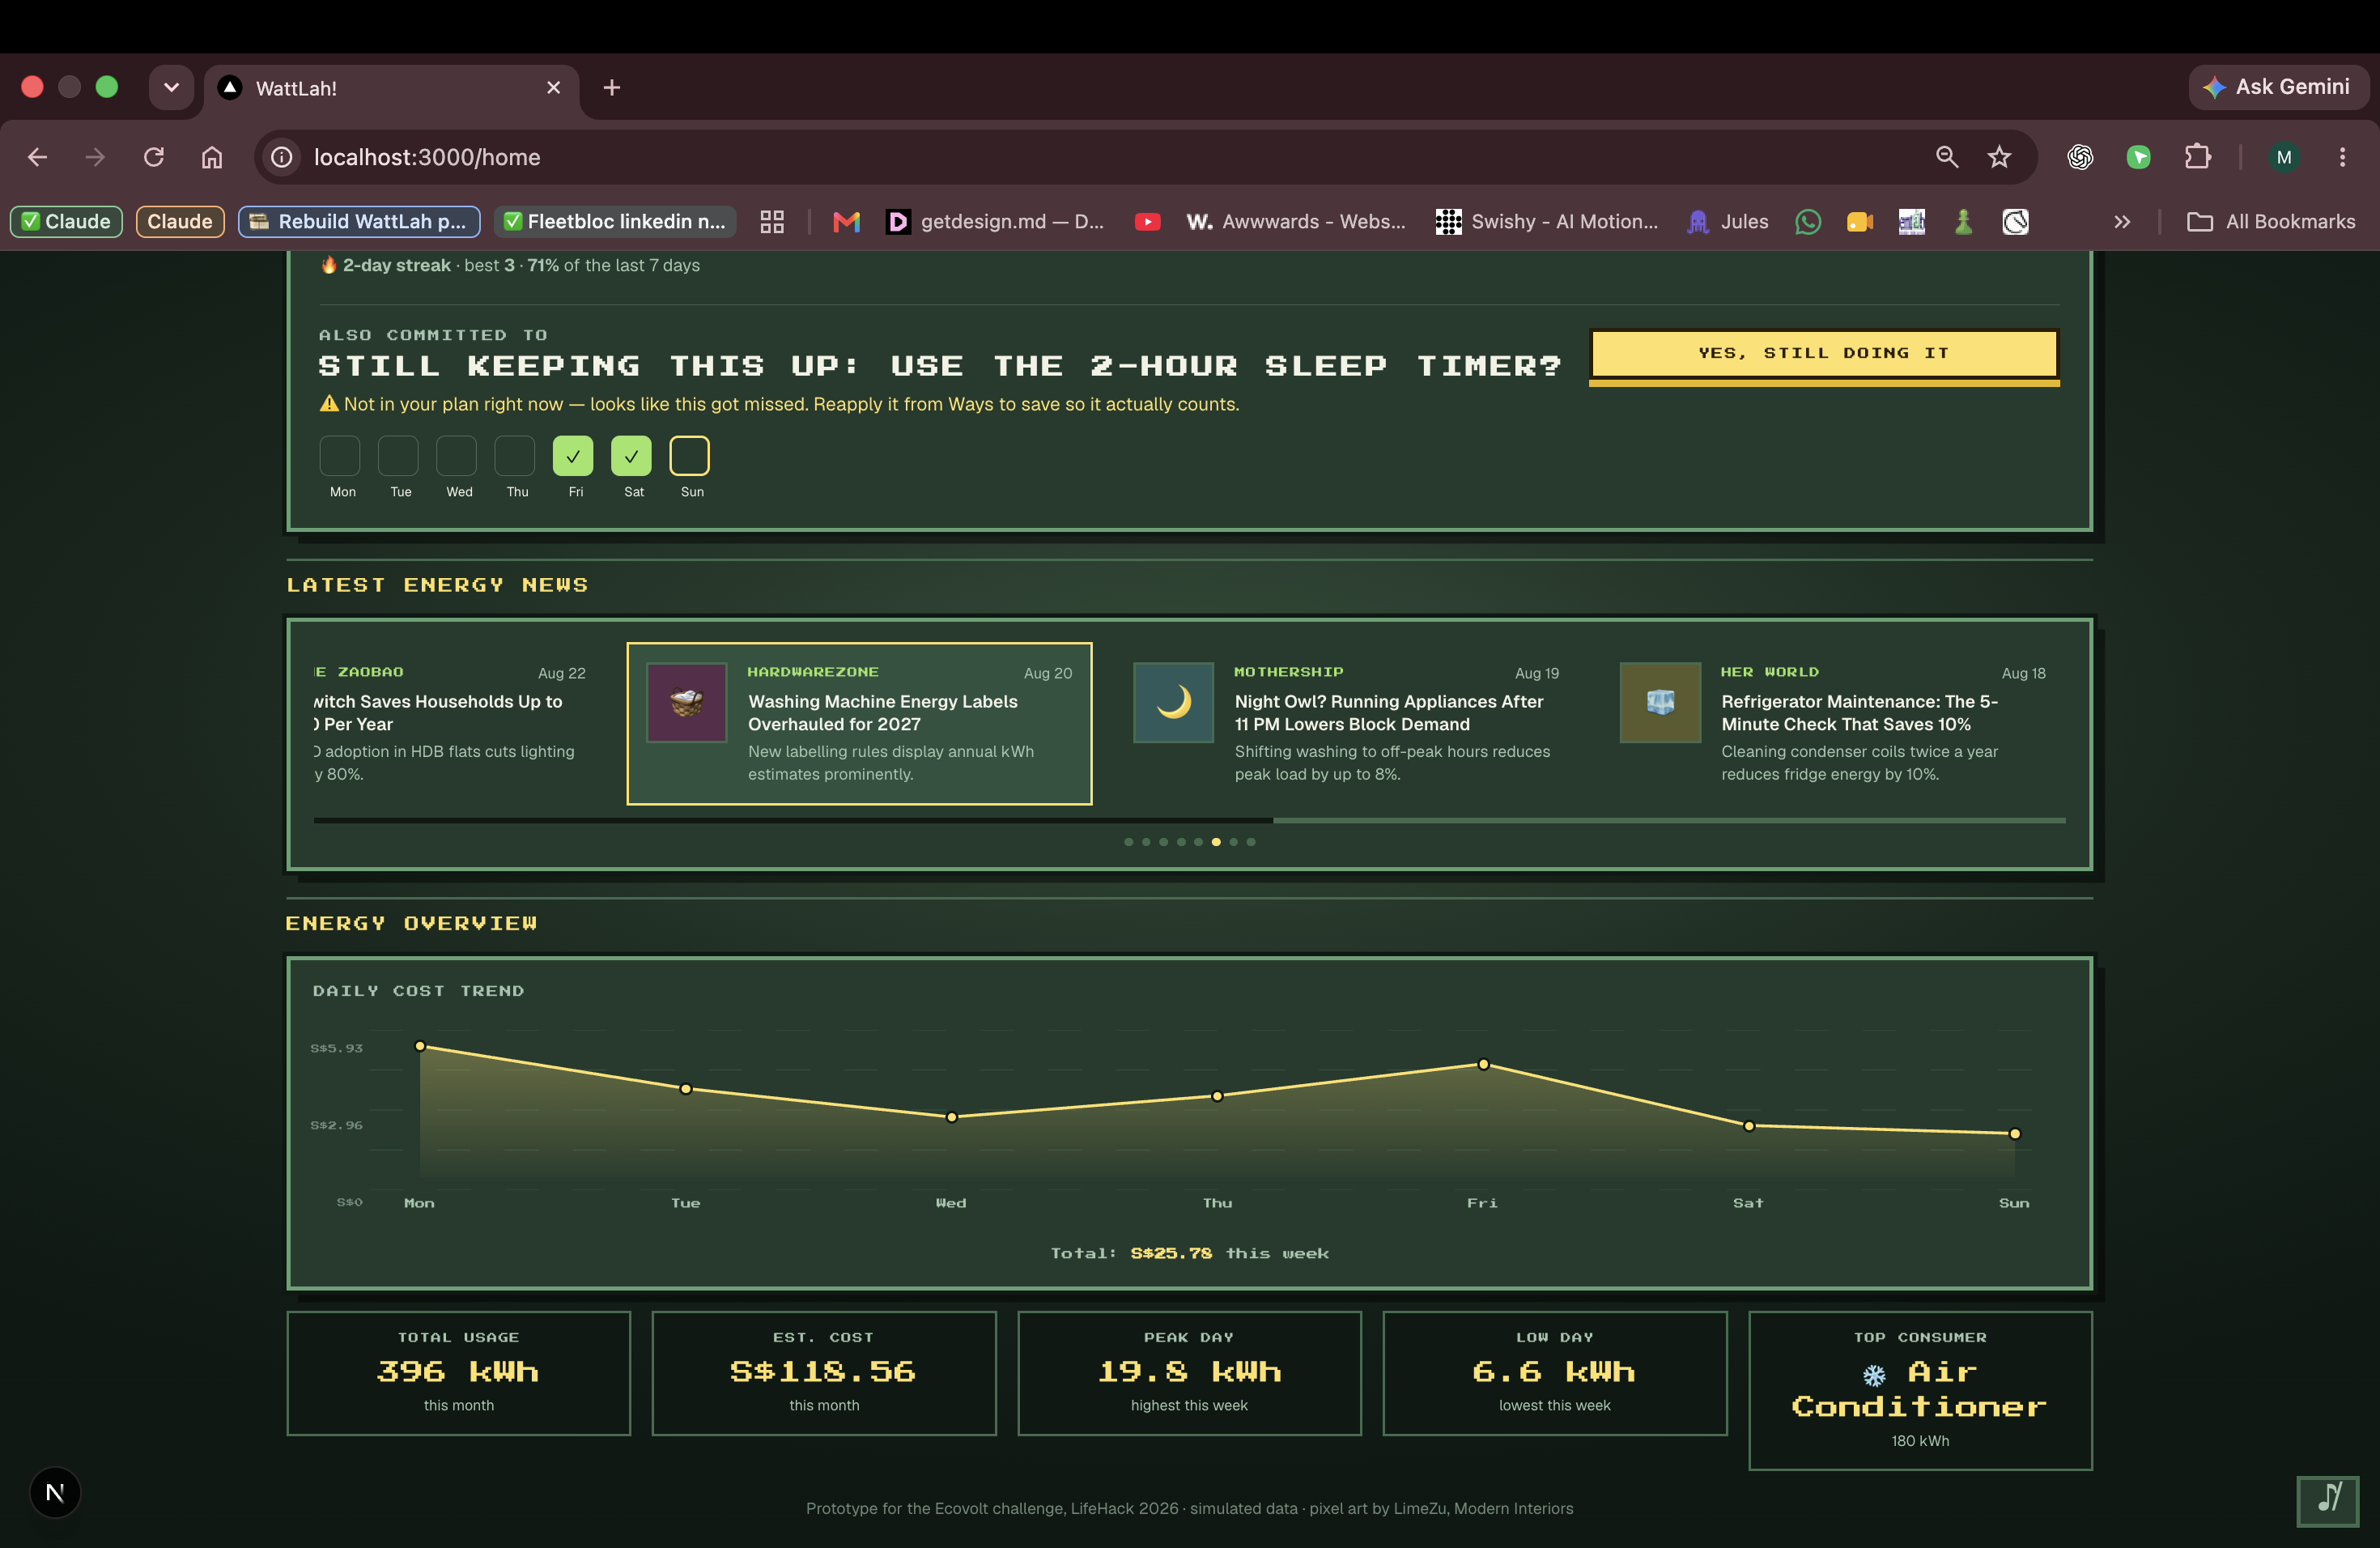
One question a day keeps the habit honest, and every fix you commit to gets its own check-in.
-
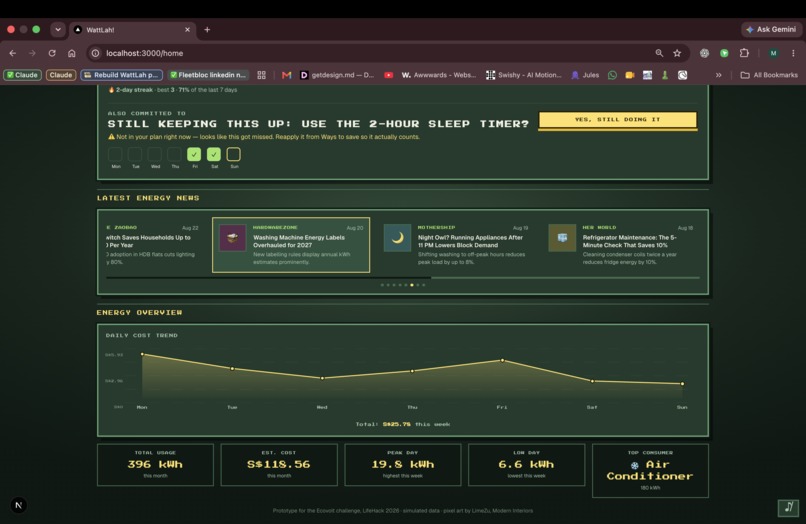
Underneath the game, the real numbers: what you used, what it cost, and which appliance ate it.
-
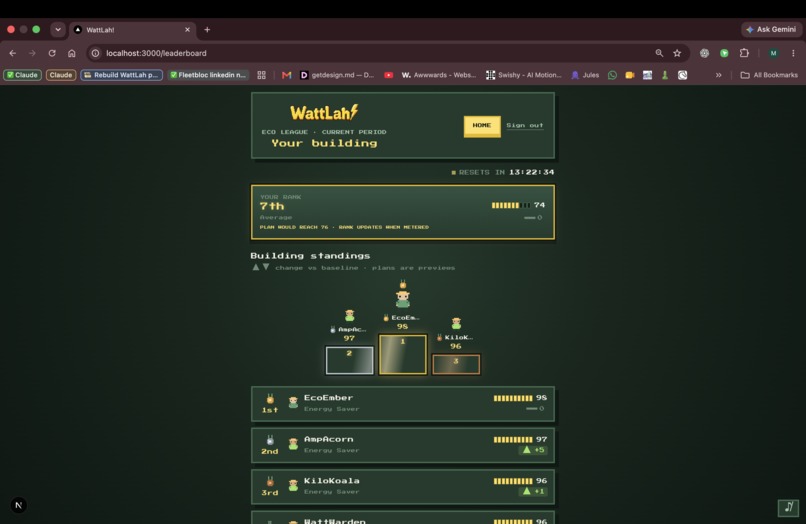
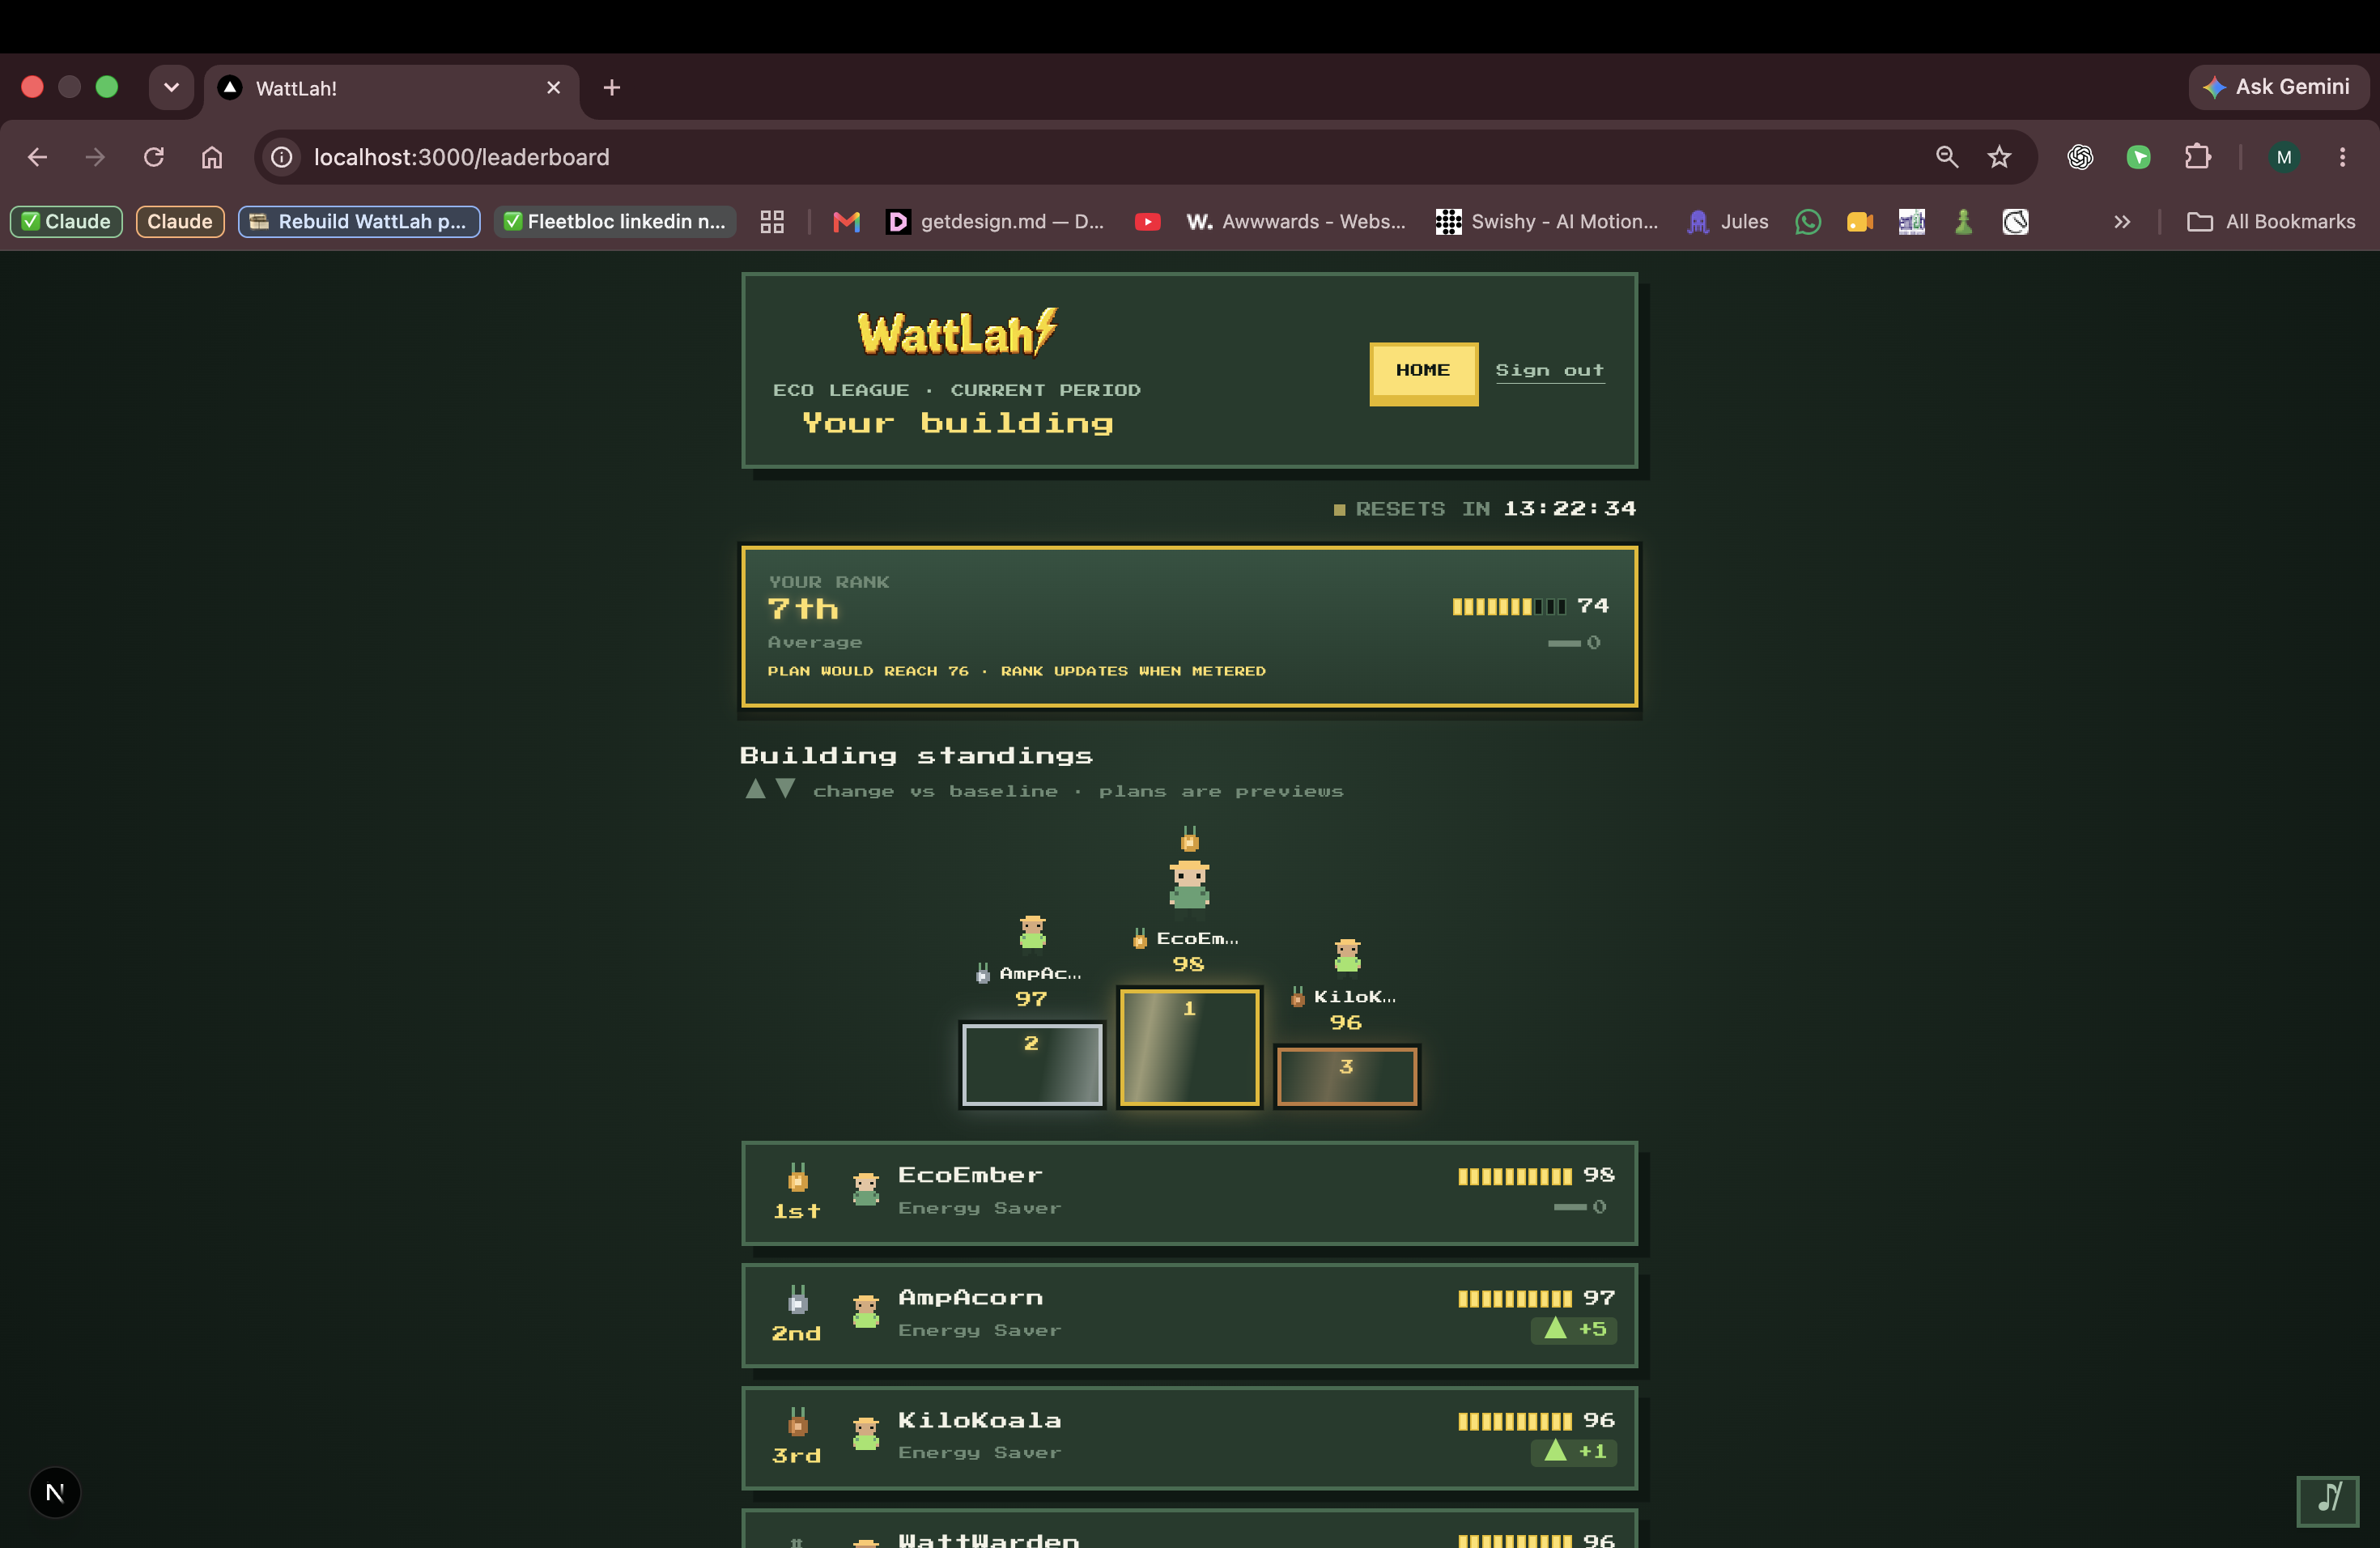
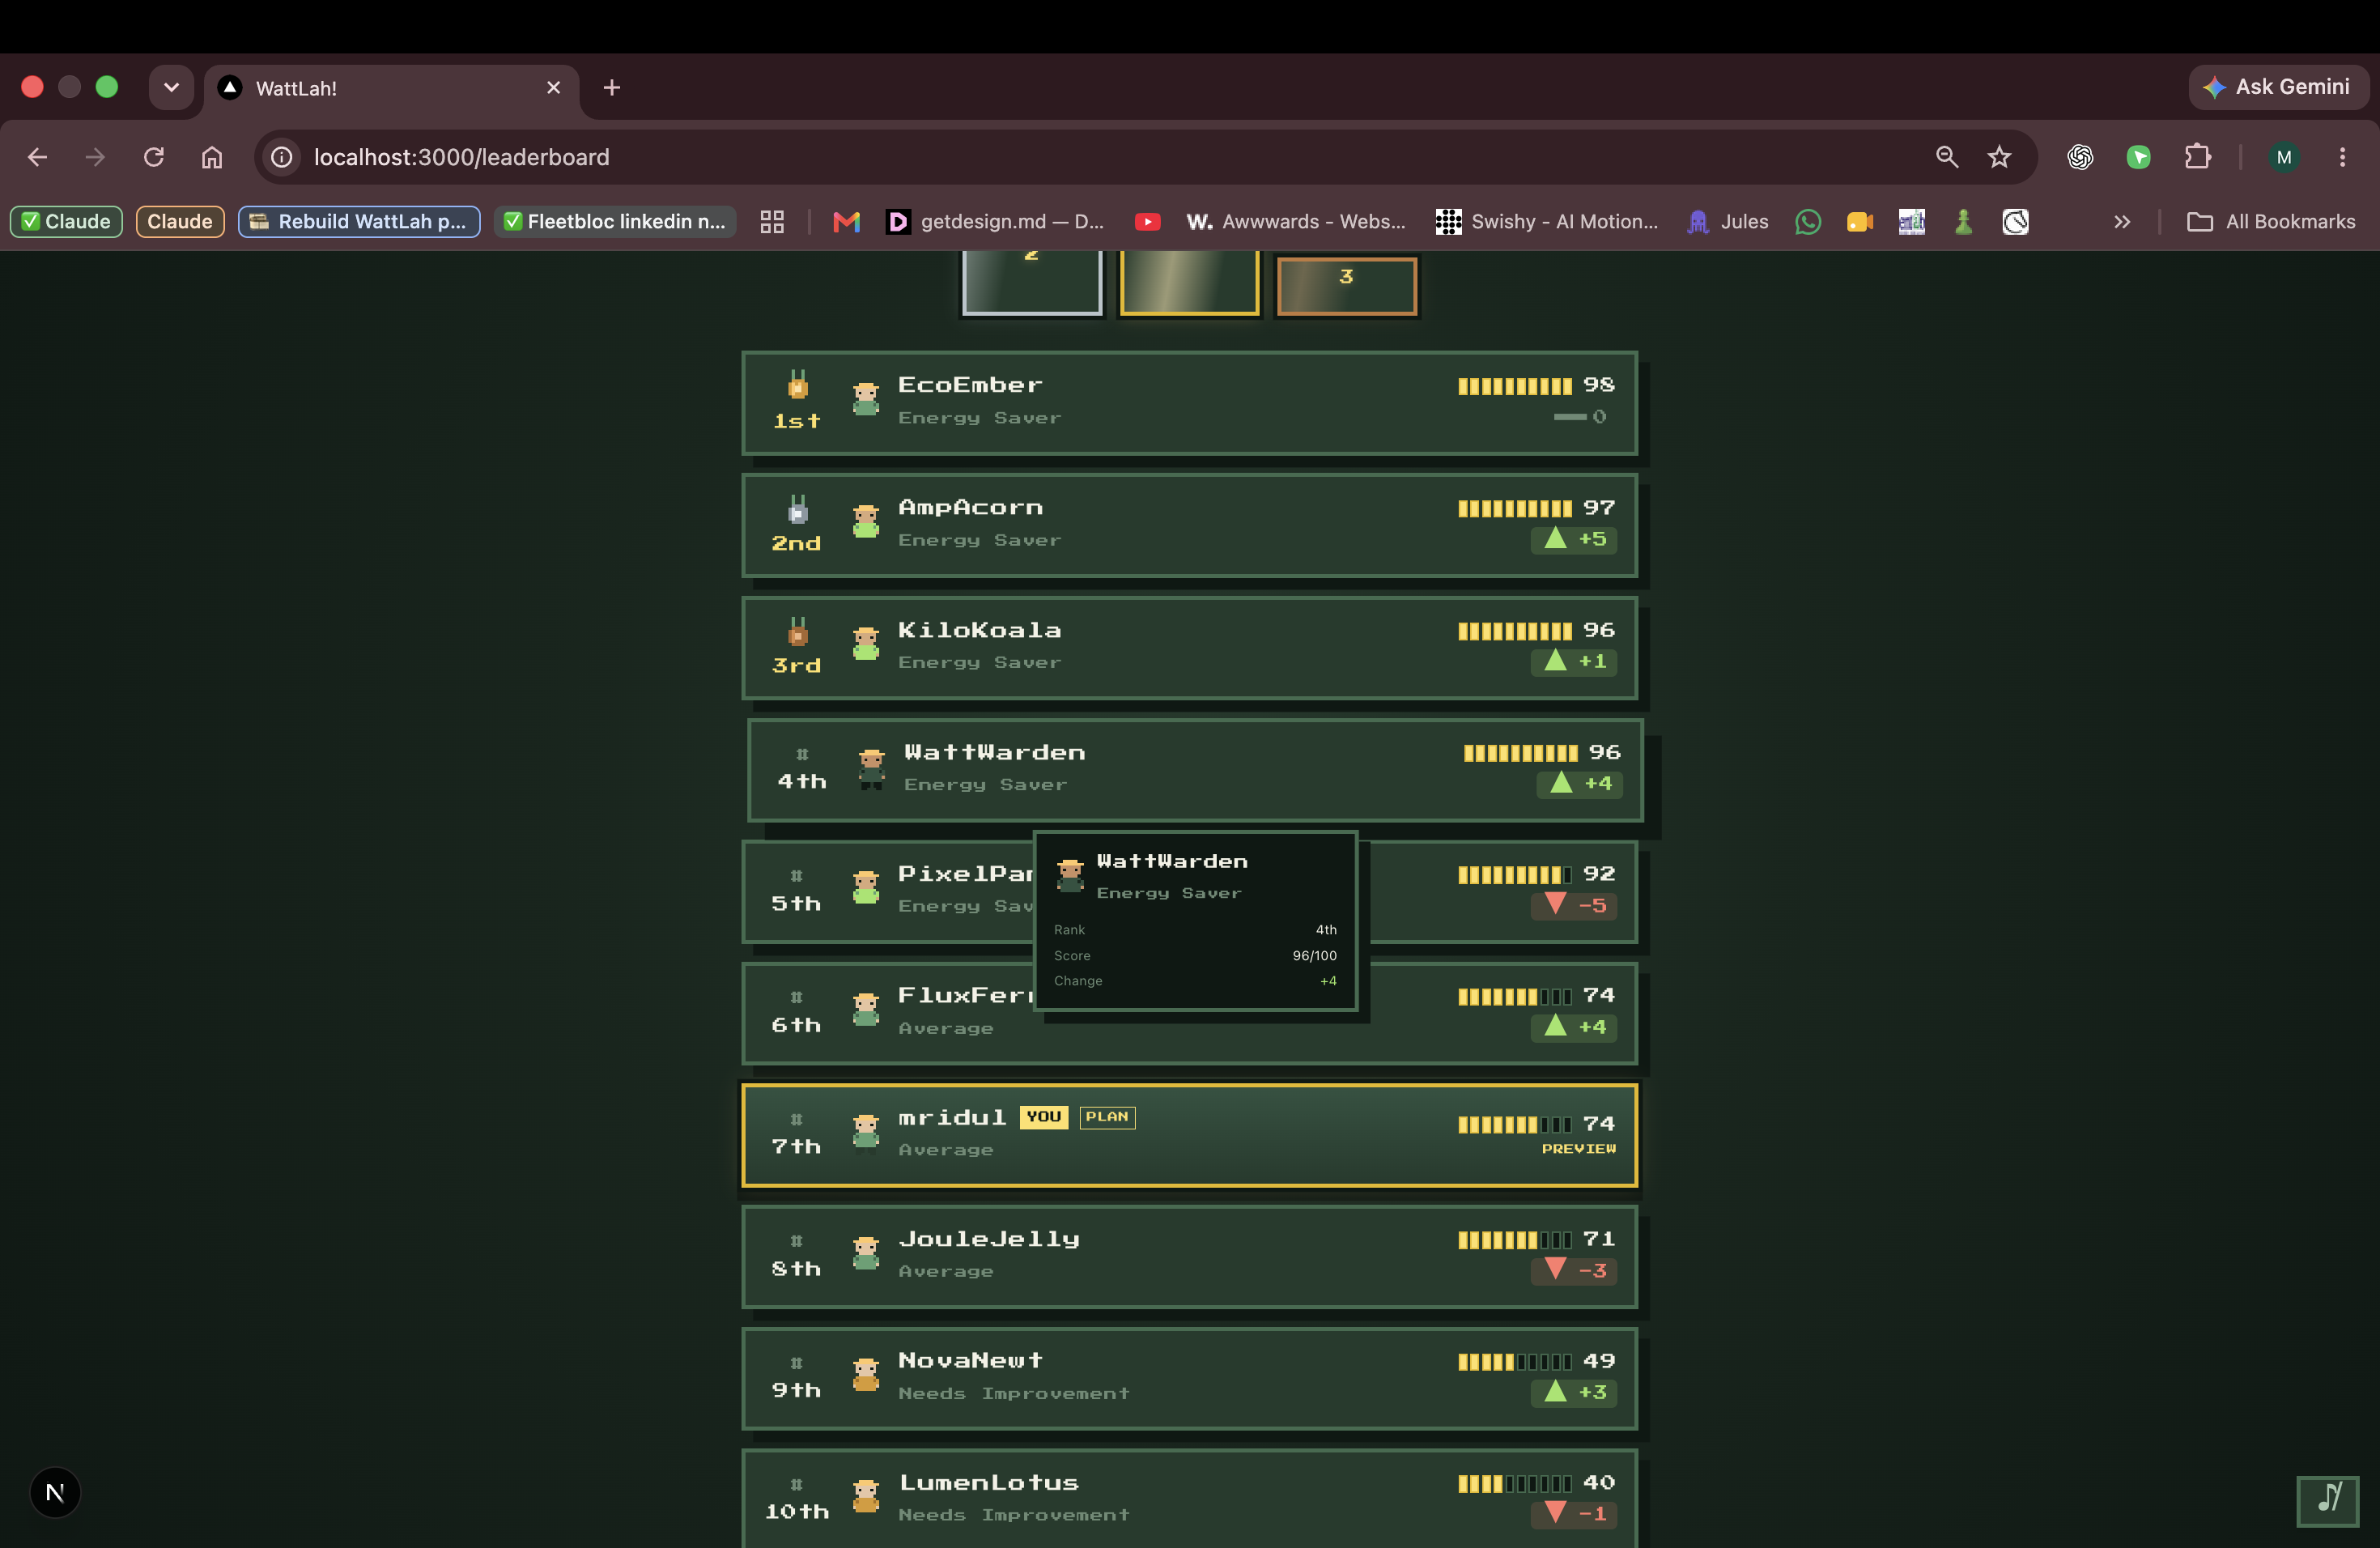
The whole block, ranked. Your row stays marked PLAN until real consumption catches up.
-
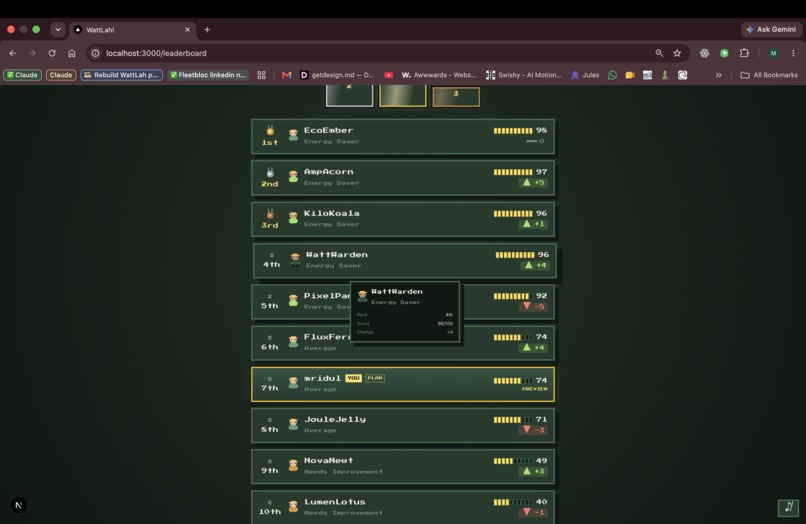
Rank 7 of the building, and the plan only counts once it's actually metered.
-
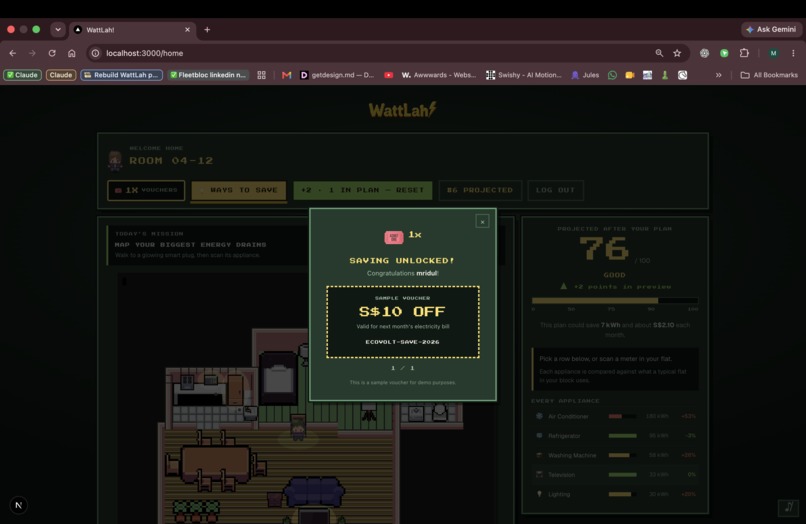
Apply a fix, unlock a reward — labelled a sample.
About the Project
Inspiration
Sustainability rarely fails because people lack information and it fails because that information never feels personal. A utility bill lists numbers. It doesn't inspire anyone to act.
Ecovolt's "Small Green Habits" challenge pushed us to ask a different question: what if checking your electricity usage felt less like reading a bill and more like playing a game? That question became WattLah!, a gamified home energy audit that turns your apartment into a playable, interactive sustainability experience.
What it does
WattLah! invites residents to:
- Step into their apartment and pick a public player handle.
- Explore a pixel-art version of their home.
- Scan appliance meters to uncover where their energy is really going.
- Spot the biggest energy drains at a glance.
- Pause and inspect any appliance to see exactly how much it contributes to their usage.
- Build a personalised energy-saving plan.
- Preview their projected score and climb the building leaderboard.
Every number in WattLah! is clearly labelled as either real, measured usage or a projected outcome, so residents always know what's happening now versus what could happen if they act.
Scores are calculated by comparing an apartment's consumption against a building reference:
$$ \text{Comparison} = \frac{\text{Apartment Usage} - \text{Reference Usage}} {\text{Reference Usage}} \times 100 $$
$$ \text{Score} = \text{clamp}\left(\text{round}(100-\text{Comparison}),0,100\right) $$
The result is a simple, motivating goal: cut consumption, boost your score, climb the league.
How we built it
We built WattLah! as a fully client-side web app, using:
- Next.js (App Router) for the overall structure
- React and TypeScript to power the interface
- Tailwind CSS for styling
- Phaser 3 to bring the interactive apartment to life
- Vitest to keep the scoring logic honest
- Local storage to save session, audit, and plan data per room
To move fast, we built the apartment and appliance data as deterministic mock data — letting us prototype the entire experience without waiting on live sensors or a backend.
React and Phaser split the work cleanly: React drives the user journey, from onboarding and the dashboard to the savings plan, and the leaderboard and so on, while Phaser owns the apartment itself, handling movement, appliance interactions, and scan animations. A typed event bridge lets the two talk to each other without stepping on each other's toes.
We layered in responsive design, keyboard and touch controls, accessible scan dialogs, reduced-motion support, and clear labelling throughout, so the experience holds up on any device and for any player.
Challenges we ran into
Balancing fun with credibility was our toughest call. We wanted WattLah! to feel like a game, not a spreadsheet . Every score and projection had to hold up to scrutiny, so we kept asking: does this number mean something, or is it just decoration?
Merging Phaser into a React and Next.js app tested our architecture. Phaser needed to own the apartment; React needed to own everything around it. Drawing that line and connecting both sides with a typed event system took real iteration and effort.
Server-side rendering added another wrinkle: browser storage simply doesn't exist during the first render. We had to load session and audit data carefully on the client to avoid hydration errors.
And pixel art doesn't scale itself. Keeping our sprites crisp across screen sizes meant leaning on integer scaling, sprite sheets, and responsive layouts to protect the art on both desktop and mobile.
Accomplishments that we're proud of
We're proud that WattLah! is a complete journey, not just a mockup. Someone can walk in, explore their home, scan appliances, build a plan, and watch their projected impact unfold, not just in the context of their own homes but as a contribution on the global scale.
We're especially proud of:
- Turning raw energy data into something you can actually walk through.
- Making the split between "what's real" and "what's projected" impossible to miss.
- Getting React and Phaser to work together seamlessly.
- Landing on a scoring system that's both deterministic and testable.
- Supporting keyboard players, touch players, and everyone who needs accessible design.
- Building a leaderboard that makes saving energy feel like a shared mission, not a solo chore.
- Shipping a working prototype without a single line of backend code or a piece of hardware.
What we learned
Information alone doesn't change behaviour; direction does. Telling someone an appliance drains power matters less than showing them what to do about it and what that action is actually worth.
Gamification only works when it's in service of something real. Scores, plans, and leaderboards matter because they give people feedback and momentum and not because they dress up the interface.
On the technical side, we learned how much clarity comes from clean ownership of state. Keeping the simulation and the product experience separate made the whole app easier to build and easier to reason about.
Above all, we learned the value of honesty about limitations. Our data is simulated, and our score reflects total consumption rather than proof that one specific habit changed. Naming that limitation clearly gives us a solid foundation to build real testing on top of.
What's next for WattLah!
Next, we want to plug WattLah! into real Ecovolt data, smart plug and smart MCB, swapping simulated readings for actual household-level measurements. That single shift would let us deliver truly personalised insights and prove, not just suggest, that people are cutting their consumption.
Down the road, we're excited to explore:
- Live appliance and household energy data.
- Recommendations tailored to each household's actual usage patterns.
- Streaks and challenges built around specific habits.
- Building-wide events and team competitions.
- Timely nudges that prompt action when it counts.
- Rewards tied to verified energy savings.
- Long-term tracking that compares life before and after WattLah! .
- Expansion beyond electricity into water, waste, and other sustainability habits.
Our vision: WattLah! becomes a household sustainability companion — the kind that turns small daily decisions into visible, measurable progress.
Built With
- css
- css3
- github
- html5
- javascript
- localstorage
- next.js
- phaser.js
- playwright
- react
- tailwind
- typescript
- vercel
- vitest

Log in or sign up for Devpost to join the conversation.