Inspiration
We realized that most people genuinely want to adopt clean energy but they just don’t know where to start. The information gap between wanting solar and knowing if it’s worth it is surprisingly wide. Getting reliable estimates often means weeks of outreach, technical evaluations, and confusing data.
At the same time, satellite and irradiance data that could answer these questions already exist. They are just fragmented, technical, and inaccessible to the people who could use them most. That disconnect felt like both a technical challenge and a societal problem worth solving.
So we set out to build something simple but powerful: a tool where anyone, whether an individual, organization, or policymaker, can instantly see how much energy their roof could produce, how much they would save, and how much carbon they would offset, with no middlemen or guesswork.
Watts Up was built with our belief that sustainability should be data driven, transparent, and easy to act on. If we can make people see rooftops not as static structures but as sources of untapped potential, we turn awareness into action.
What it does
Watts Up is an AI-powered solar intelligence platform that transforms any rooftop into a personalized clean-energy report in seconds. You start by entering an address and outlining the area of the roof you want to analyze. Once you click “Analyze Roof,” the platform uses satellite imagery, geospatial data, and AI-driven computer vision to evaluate how effectively that location can harness solar power.
In moments, Watts Up generates a detailed, interactive dashboard that shows:
- Solar Score: a performance rating indicating the site’s solar suitability.
- Energy Forecasts: estimated daily and annual generation based on NASA irradiance and climate data.
- System Insights: roof area, optimal panel configuration, and system capacity.
- Financial Outlook: installation cost, payback period, ROI, and long-term savings.
- Environmental Impact: projected carbon offset, CO₂ reduction, and tree-equivalent contribution.
- Savings Mirror: upload your monthly electricity bill to instantly compare current utility expenses with projected solar costs and savings, featuring visual breakdowns of payback timelines and cumulative ROI.
- Energy Equtiy & Access Index: built into the platform's policy recommendation reports, this feature introduces the WattsUp Equity Score (0-100), which measures disparities in solar adoption across income, zoning, and race demographics using Census and building data. The index helps identify underserved neighborhoods and informs city councils or NGOs seeking to target grants, rebates, or community solar programs.
The experience feels immediate, visual, and data-driven: replacing lengthy consultations with intelligent, automated insight.
Watts Up combines creativity in design, depth in functionality, and a clear social mission: making clean energy adoption simple, accessible, and measurable. It’s a step toward a future where anyone can understand their renewable potential with a single click.
How we built it
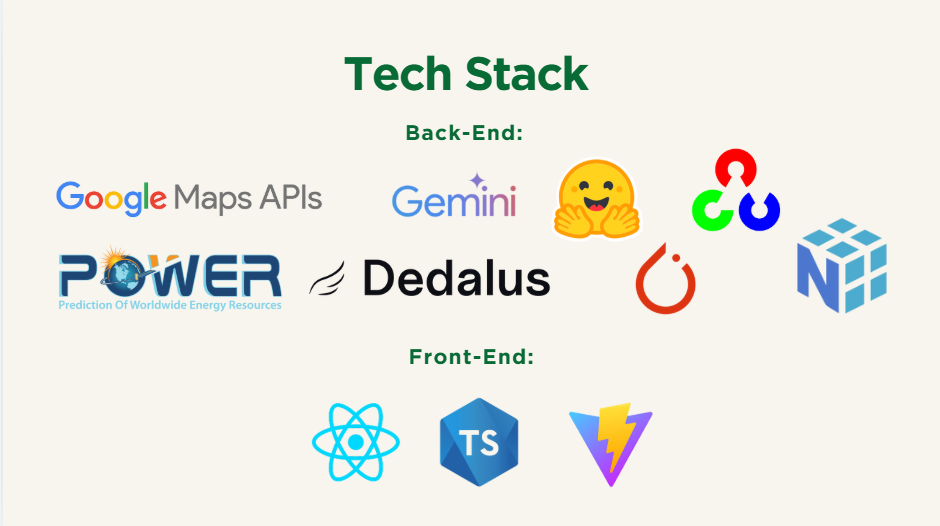
We started by integrating the Google Maps API to allow users to input an address and draw their desired rooftop area directly on an interactive map. Once the region is defined, our backend pipeline processes it through a series of AI and data-driven stages.
We used NASA’s POWER API to gather solar irradiance, temperature, and climate data for the coordinates selected by the user. The imagery from Google Maps is then analyzed using SegFormer-B0, a transformer-based model fine-tuned for rooftop segmentation. Through PyTorch and OpenCV, we calculate usable roof area, slope, and shading to estimate effective solar capture potential.
The system combines this information with performance and cost models to produce detailed metrics such as expected energy output, system size, cost savings, payback period, ROI, and CO₂ offsets. To make the experience intelligent and conversational, we used Google Gemini 2.5 Flash and the Dedalus Labs SDK (Claude Sonnet 4 agents) to power dynamic insights, localized incentive discovery, and report generation.
The frontend was built with React 18, TypeScript 5.8, and Vite 5.4, focusing on a clean, fluid interface that visualizes complex data with simplicity and elegance. Every design choice: from the color gradients to the live performance metrics was crafted to make sustainability feel modern, interactive, and approachable.
We collaborated across design, data, and engineering to ensure every part of the product worked cohesively. The final result is a fully functional prototype that seamlessly blends geospatial analytics, AI, and climate intelligence into one accessible experience.
Challenges we ran into
Building Watts Up required merging several complex systems: geospatial mapping, AI vision models, and climate data; into one seamless workflow. That came with its share of challenges.
One of the biggest hurdles was aligning NASA irradiance data with map coordinates in real time. Small projection mismatches created large accuracy errors, so we had to carefully calibrate and normalize the datasets for consistent results.
Another challenge was optimizing the computer vision pipeline. Segmenting rooftops from satellite imagery sounds simple, but varying roof angles, shading, and vegetation made detection difficult. We had to fine-tune SegFormer-B0 and post-process its masks with OpenCV to reach the 95% confidence level shown in our reports.
We also faced performance bottlenecks when running inference and generating solar analytics on the fly. To solve this, we implemented caching and lightweight data pipelines to keep the experience interactive and responsive.
Designing the user interface was equally challenging: balancing technical precision with visual clarity. We wanted to present data like ROI and carbon offsets in a way that feels intuitive and motivating, not overwhelming.
Integrating every part under pressure was demanding, but it reinforced our commitment to building solutions that are both technically sound and meaningful.
Accomplishments that we're proud of
We’re proud that Watts Up evolved from an idea into a fully functional solar intelligence system within a short time frame.
- End-to-end integration: Built a working pipeline that combines Google Maps, NASA irradiance data, and AI-based roof segmentation into real-time solar analytics.
- Functional precision: Achieved over 95% accuracy in roof boundary detection and energy potential estimation using our computer vision pipeline.
- Interactive experience: Designed a clean, map-based interface that lets users draw, analyze, and visualize their rooftop potential in seconds.
- Scalable foundation: Structured the system so it can expand from single rooftops to city-wide or enterprise-scale energy mapping.
- Impact-driven design: Created a tool that not only demonstrates technical capability but also drives awareness and accessibility in renewable energy adoption, incorporating the idea of the Energy Equity & Access Index.
The most rewarding outcome was seeing the system deliver reliable, data-backed results that could realistically guide clean energy decisions.
What we learned
Building Watts Up taught us how to bridge data science, geospatial analysis, and AI into a cohesive, real-world application.
We learned how to process and align datasets from different coordinate systems, how to fine-tune a transformer-based vision model for variable image quality, and how to optimize inference speed for real-time interactivity. Integrating APIs from Google Maps and NASA POWER required handling data normalization, unit conversion, and latency challenges that pushed us to think beyond standard pipelines.
We also gained a deeper understanding of the energy modeling side: translating irradiance and temperature data into practical metrics like kWh output, ROI, and carbon savings.
On a broader level, we learned that sustainability tech requires both technical precision and accessibility. Data alone isn’t enough; how it’s presented determines whether people act on it. That insight guided every design and engineering decision we made.
What's next for Watt's Up
Watts Up began as a hackathon project, but it quickly became something we can’t stop thinking about. In just a few hours, we proved that AI and geospatial data can turn complex solar modeling into an experience anyone can use and now we want to take it further.
We plan to keep developing Watts Up into a full-scale platform that supports real-world deployment and impact. Our next steps include:
- Expanding data coverage: integrating higher-resolution satellite imagery and more detailed irradiance datasets.
- City-scale mapping: building dashboards that let municipalities and utilities identify high-impact renewable zones.
- API access: creating endpoints for energy companies, real-estate platforms, and sustainability startups to use our analytics.
- Financial integration: adding cost calculators, rebate information, and ROI projections tailored to region and policy.
- Mobile-first design: launching an app that makes solar analysis instant, accessible, and portable.
- Partnerships for impact: collaborating with environmental organizations and local governments to use Watts Up for policy planning and awareness campaigns.
Even though it started at a hackathon, we’re excited to keep building, testing, and scaling it; because the potential for clean energy shouldn’t end when the event does.
Built With
- dedalus-labs-sdk
- google-gemini
- google-maps
- hugging-face
- nasa-power-api
- numpy
- opencv
- python
- pytorch
- react
- segformer-b0
- typescript
- vite


Log in or sign up for Devpost to join the conversation.