Inspiration
Our inspiration came from the recent earthquakes that struck Türkiye and Syria, affecting hundreds of thousands of people, leaving them stranded in the middle of winter awaiting dire aid. Knowing the international community could've done better, we also knew the effects of a disaster like an earthquake (or flood) can severely damage infrastructure, rendering water undrinkable, so we took it upon ourselves to research and build a solution that could improve the coordinated efforts to deliver aid.
What it does
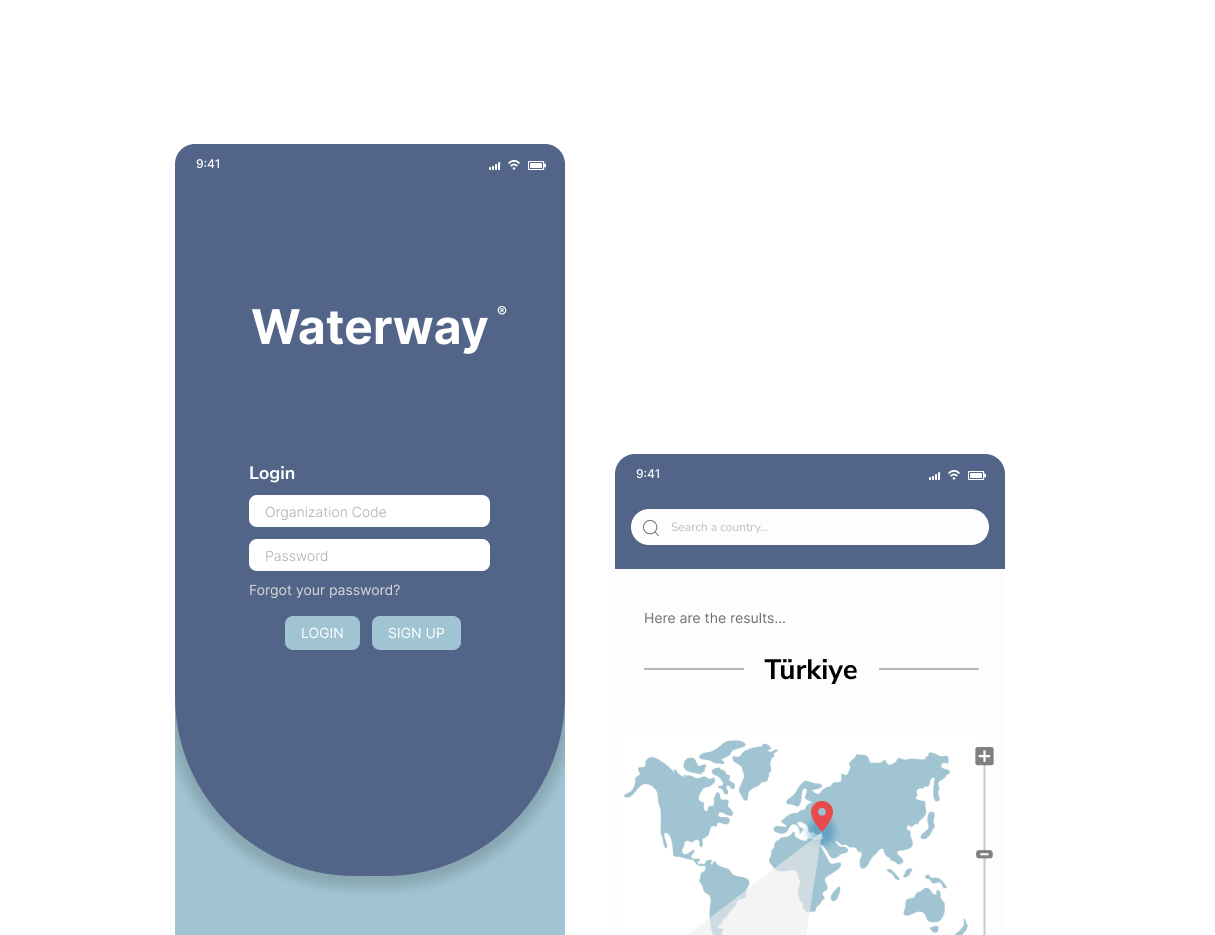
Our dashboard features an interactive UI, presenting flood disaster data that would ideally be fetched real-time and pooled into a visual map, allowing authenticated aid organization staff to access the latest disaster updates and supply water and other provisions and aid more effectively and efficiently. Users may submit a provision form to an affected country ranked on the Home page based on supplies needed and quantity.
Based on the literature, we wanted to focus on coordinating local efforts than macro-level organization as this has already been done by OSOCC and UNJLC.
How we built it
Our web-based prototype is hosted on Netlify and built using Vue.js in PWA mode -- this means the app can be accessible without internet, as is the dilemma we ran into when deciding how to proceed with a technology-based solution which would require proper infrastructure in place to access it, in which case could've further delayed aid and assistance from local or international communities. Hosting it on as a PWA circumvented that issue (at least for the purposes of our project).
Challenges we ran into
We ran into issues during our research phase after reading a review by Ma et al., 2022 which stated the difficulties that arise when organizations team up to provide aid after a disaster yet logistics and coordination between organizations is not streamlined in such a way. Compounded with issues of environmental access such as roads and travel paths being destroyed after floods, delays can be further compounded by legal issues, staffing, and transportation. We also ran into technical issues such as API integrations and manually querying an API, and so therefore had to simplify our work to ensure our minimum prototype was presentable in both UI and code. Lastly, data hierarchy was simultaneously a difficult task as the data we requested from API had to match the information we needed to present on the UI. We eventually split the workload between our specialities and experiences to produce our product!
Learning and accomplishments that we're proud of
We're proud of the tenacity we showed and the problems we persisted through. We have listed the following as accomplishments:
- Learning how to use Figma, design and prototyping
- Ideation of information hierarchy and understand user needs and topic constraints
- Identifying and debugging code and learning what to prioritize as a result
- Learning the operational capacities and process standards that guided international aid law and the distribution and very real challenges faced by aid workers throughout the world - the literature showed us the complex organizational challenges that aid work faces.
What's next for waterway
- Find a way to represent the visually charted data within a map
- We'd like to find out if existing solutions such as the OSOCC and UNJLC have been implemented in the field as this would give us a more descriptive analysis of our (pilot) solution
- We'd like to find out what resources are requested in aid provision, and to what volume as this is highly important and supply chain issue and economic barriers can serve as an inopportune bottle-neck on logistics.
- Lastly, while we weren't able to dynamically code many features due to time constraints, we hope eventually this project serves as a way to understand how visual information works in emergency disasters and how to better such applications to help the most people
Built With
- css
- figma
- html
- javascript
- reliefwebapi
- vue.js


Log in or sign up for Devpost to join the conversation.