Inspiration
A sensor can tell you the oxygen level in a river, but it cannot really answer a simple question: "Is it safe for my dog to drink this water?"
This became personal for me when I saw dogs and other pets get sick after drinking unsafe water. It was heartbreaking to think that something as basic as drinking water could make them ill. Animals cannot tell us when something is wrong, and they depend on us to keep them safe. It made me wonder how many people and animals might be affected simply because they do not know whether the water around them is safe.
That experience inspired us to build Watershed Ledger. We wanted to find a way to make water-quality information easier to understand, not just for scientists, but for everyday people who want to protect their families, their pets, and the environment.
What it does
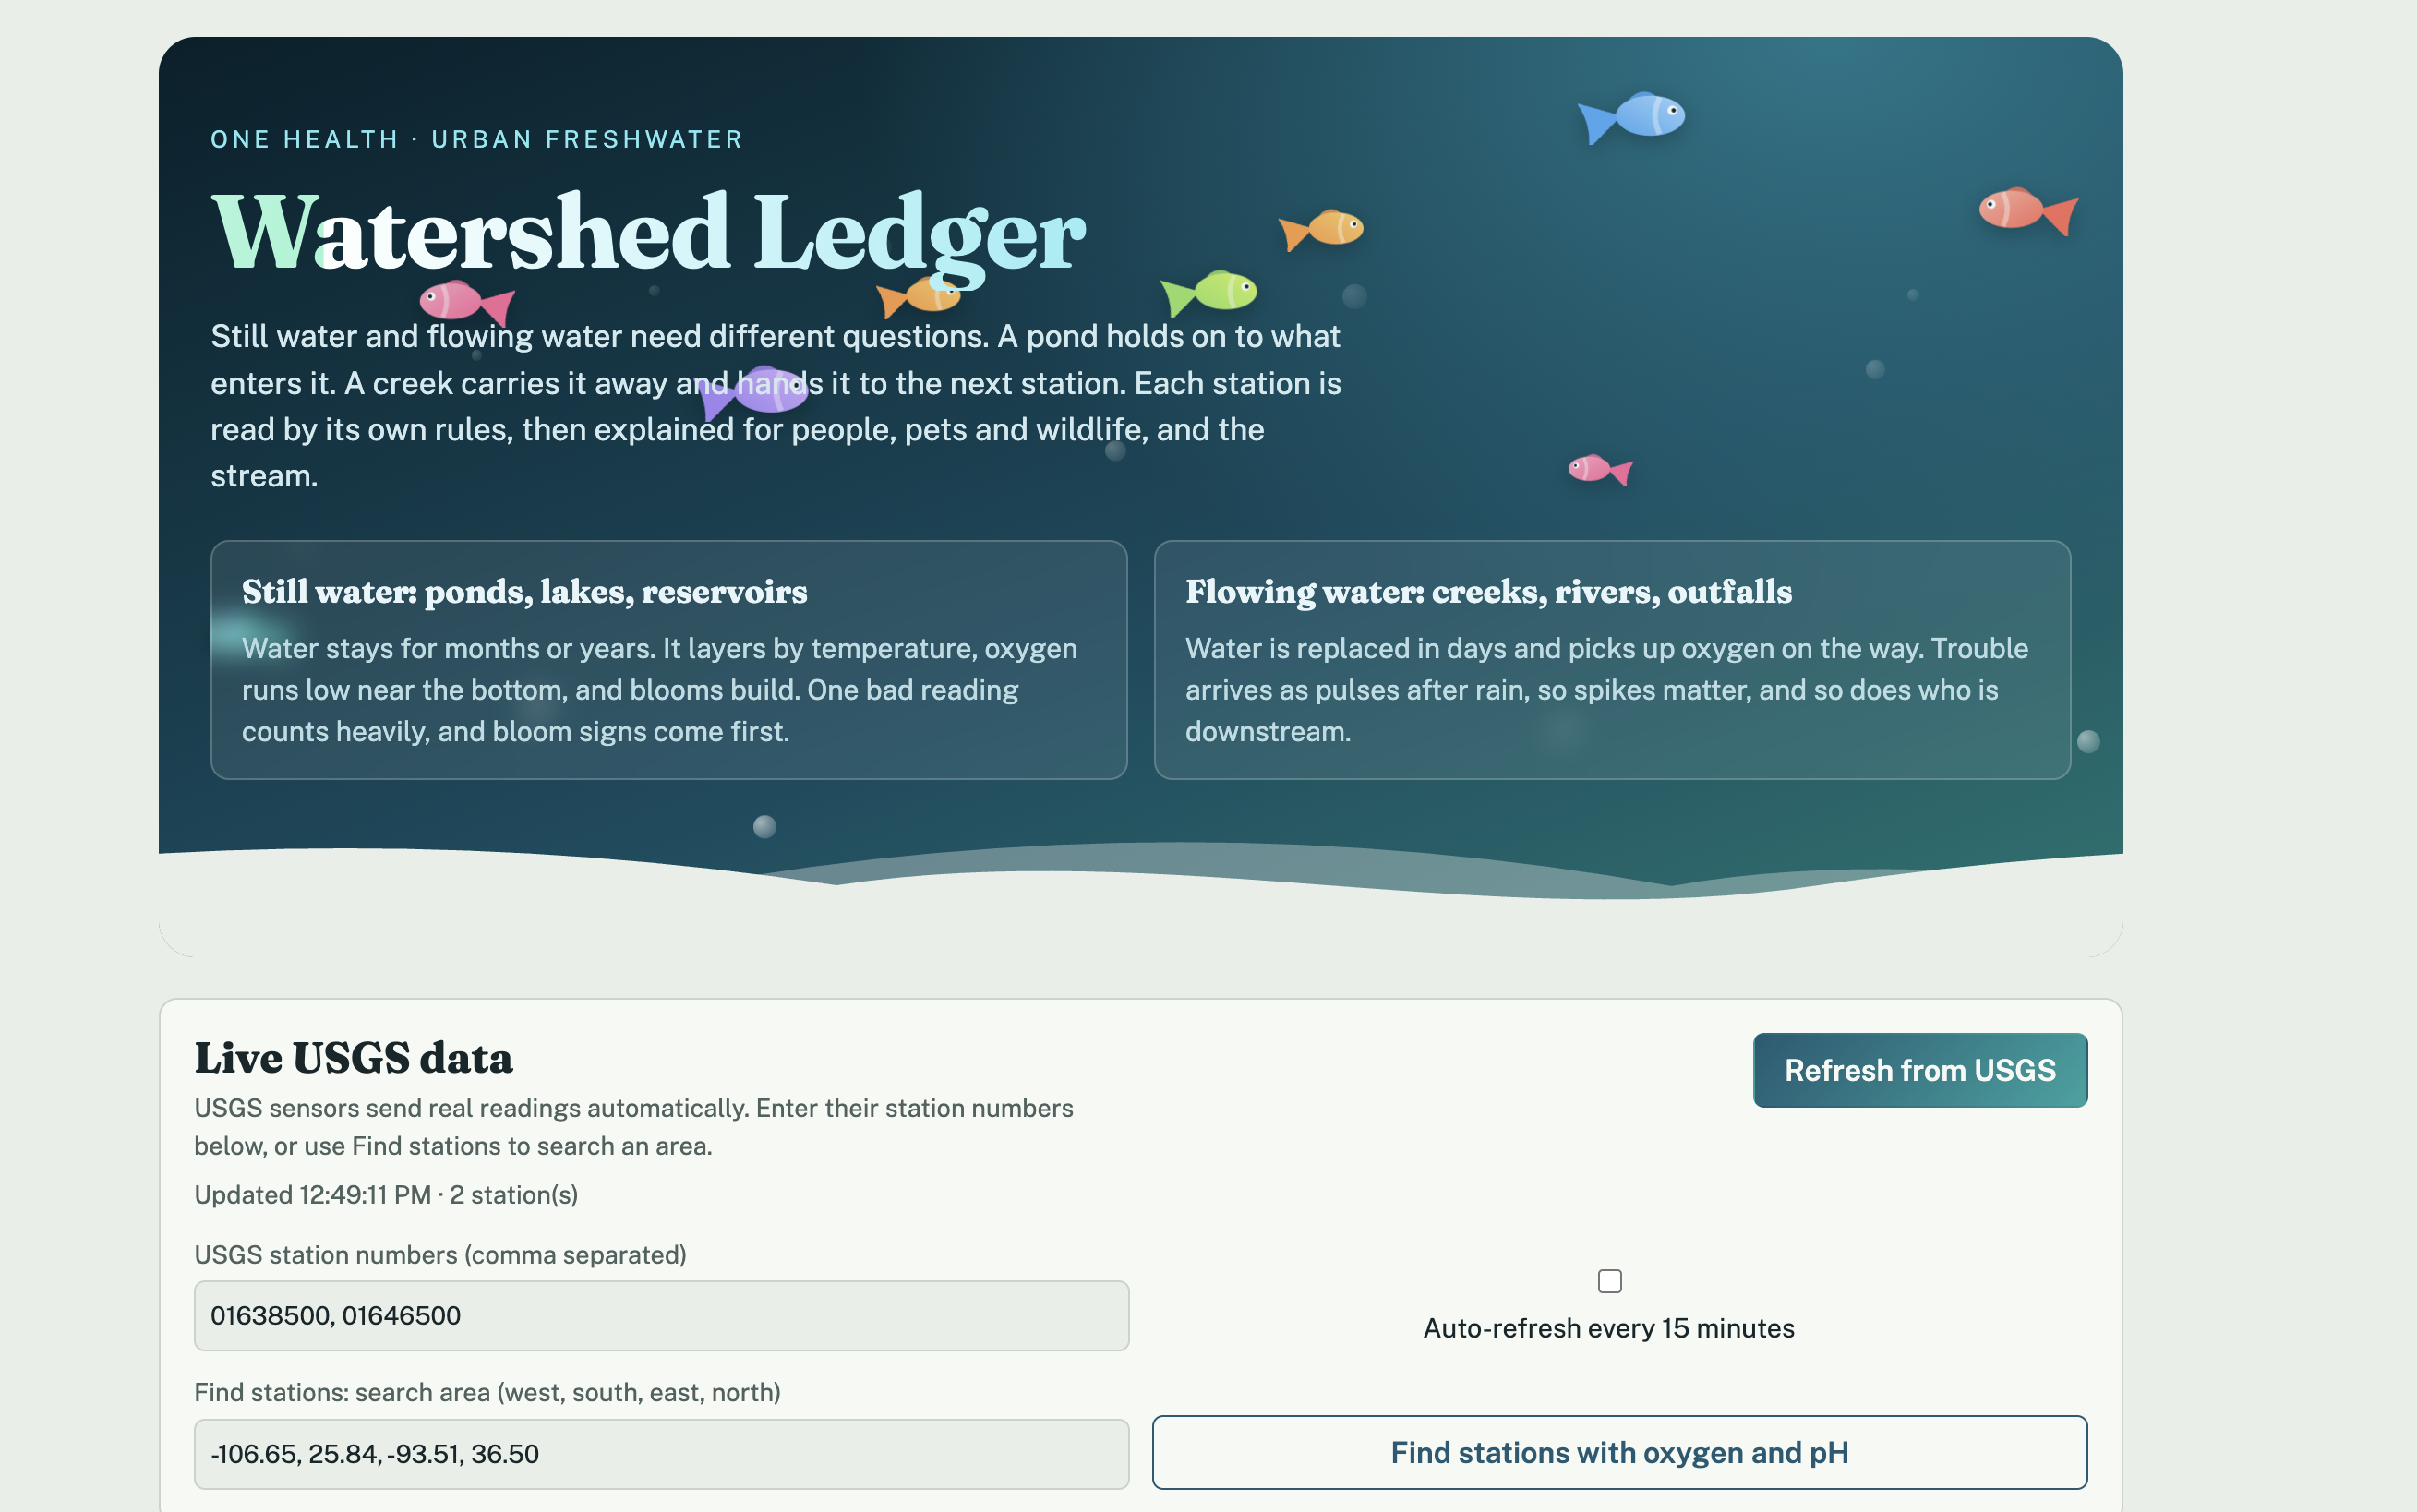
Watershed Ledger takes real-time water readings from USGS sensor stations and turns them into information that people can actually understand and use.
Instead of giving one complicated number, it looks at water from three perspectives: People, Pets and Wildlife, and The Stream.
One thing we really wanted to get right was that the same reading does not always mean the same thing. A pond behaves differently from a flowing creek, so Watershed Ledger uses different rules depending on the type of water.
It also does not treat missing data as "safe." If a sensor cannot measure bacteria, for example, the People score shows a "?" instead of pretending everything is fine.
For places without sensors, users can add a pond or another water location themselves and record what they observe. The app also explains why a score was given instead of just showing a color or number.
How we built it
We built Watershed Ledger using Python, JavaScript, HTML, CSS, SVG, and the USGS Water Data API.
The USGS API provides station information and current sensor readings. We built a station finder that searches for locations reporting measurements such as oxygen and pH.
For scoring, we used a weakest-link approach. The People score considers bacteria and algae, while the Pets and Wildlife score considers algae, oxygen, and temperature. Missing measurements are not treated as zero.
The interface is intentionally lightweight. It uses a single HTML page with an interactive SVG river map, without relying on map tiles.
We also added a small Python server for refreshing data and a scheduled GitHub job that updates the public version roughly every 30 minutes. Data can be exported as CSV or FHIR-style JSON.
Challenges we ran into
One of our biggest challenges was realizing that data that looks perfect is not necessarily trustworthy. We tested a water-and-disease dataset where the values were distributed almost suspiciously evenly, so we decided not to rely on it.
We also created a false alarm while testing. Two rivers were marked as "Act now" because one of our temperature limits was designed around a cold-water stream. We caught the problem, fixed the rule, and removed the demo example affected by our mistake.
Another issue was missing data. Early in development, an unavailable bacteria measurement was being treated like zero. That made us realize an important rule for the project: unknown is not the same as clean.
We also had family members try the interface and ask questions we had not thought about. Their feedback helped us simplify the page and remove confusing information.
Accomplishments that we are proud of
We are proud that Watershed Ledger uses real water readings rather than relying on made-up data just to make the demo look good.
We tested it with stations from the Potomac basin and Texas, and our station search was able to return 20 candidates in a single search.
We also built the system so every reading shows its source and age. The app does not just give a score; it explains the reasoning behind it.
Our scheduled GitHub job also ran successfully in about 39 seconds, giving us an automated way to keep the public data refreshed.
Most importantly, we built something that encourages people to look beyond a number and ask an important question: What does this water-quality reading actually mean for the people, animals, and environment depending on it?
What we learned
The biggest lesson was that unknown is a result.
We learned that using the right threshold for the wrong type of water can create a misleading warning. A pond, a slow-moving creek, and a flowing river can behave very differently, and water-quality assessments need to account for those differences.
We also learned to question data that looks too perfect, explain the reasoning behind our scores, and be honest about what our system does and does not know.
Most importantly, we learned that technology is more useful when it helps people make decisions that matter in their everyday lives.
What is next for Watershed Ledger
Next, we want to test Watershed Ledger against historical water-monitoring data to explore whether it could have identified warning signs earlier.
We also want to add more lake and reservoir stations and make the thresholds more specific to different types of water and local conditions.
Another goal is to build historical trend alerts so people can see when water conditions are getting worse instead of only looking at the latest reading.
Our long-term vision is to make water-quality information easier for everyone to understand, including people in places where monitoring stations are limited. We want Watershed Ledger to help people make more informed decisions and take better care of their families, their pets, and the environment.
Built With
- fhir-style
- github
- github-actions
- html-and-css
- javascript
- python
- svg
- the-usgs-water-data-api


Log in or sign up for Devpost to join the conversation.