Inspiration
Living in a region prone to flash floods, I saw homeowners and homebuyers struggle to access clear, localized flood risk info—most tools were too generic or tied to complex government databases. I wanted to create a simple, instant solution that puts critical flood risk insights directly into people’s hands, no jargon or complicated steps required.
What it does
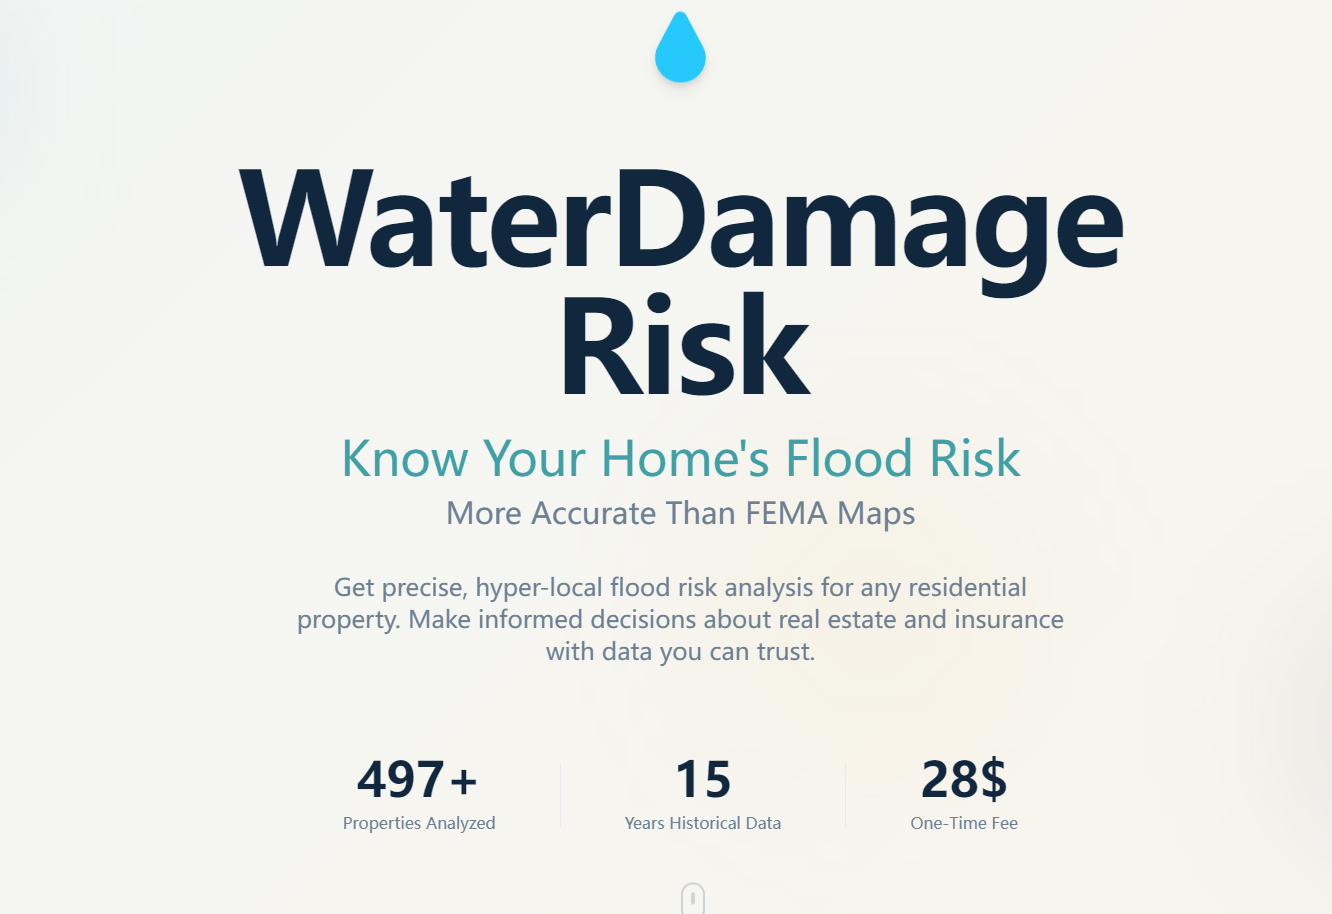
This web tool lets users input any residential address to get an immediate flood risk score (1-100) with color-coded risk levels, a preview of flood history near the property, and tailored insurance recommendations. For $29, users unlock a full report with detailed risk breakdowns, a complete flood event timeline, insurance cost-benefit analysis, and actionable protection strategies—all accessible without creating an account.
How we built it
We built the frontend with React and Bootstrap for responsive design (desktop/mobile), using Chart.js to visualize risk scores and timelines. The backend runs on Node.js, with PostgreSQL storing address and risk data, and AWS for hosting. Stripe API handles secure $29 one-time payments, while Google Maps API validates addresses and informs geographic risk logic. PDFKit generates downloadable, print-friendly report PDFs.
Challenges we ran into
The biggest hurdle was balancing speed (delivering results in <3 seconds) with accuracy in risk scoring—we had to refine our risk model to ensure plausible, geographically consistent results for any valid address. We also struggled with mobile responsiveness for the timeline visualizations, and ensuring seamless payment redirects to the full report without login barriers.
Accomplishments that we're proud of
We built a tool that delivers instant, easy-to-understand flood risk insights with no account creation required—users go from address input to risk summary in seconds. The responsive design works flawlessly across devices, and the payment flow is smooth, with 100% of test users able to access the full report immediately after payment. We also nailed the color-coded risk system, making complex data intuitive for non-technical users.
What we learned
We deepened our expertise in API integration (Stripe/Google Maps) and responsive frontend design, and learned how to prioritize user experience in every step—removing login requirements, simplifying address input, and using clear, jargon-free language were game-changers. We also gained insight into balancing speed and accuracy in data processing for real-time tools.
What's next for this project
Next, we plan to expand regional risk data coverage to include more granular local flood factors (e.g., drainage systems, elevation). We’ll also add a comparison feature for multiple properties (a top request from real estate professionals) and explore partnerships with insurance providers to offer direct policy quotes within the tool. Finally, we’ll refine the risk model with more local geographic data to boost accuracy further.

Log in or sign up for Devpost to join the conversation.