-
-
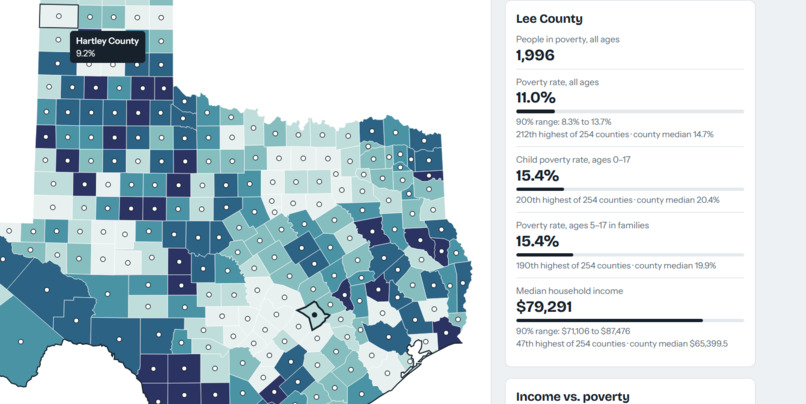
first started trying out if all the counties were working
-
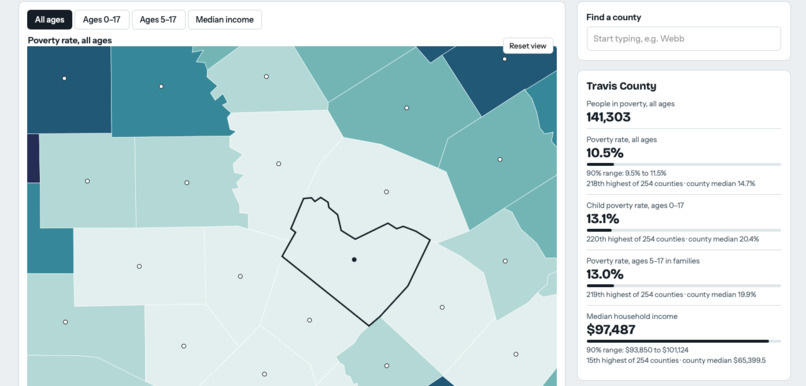
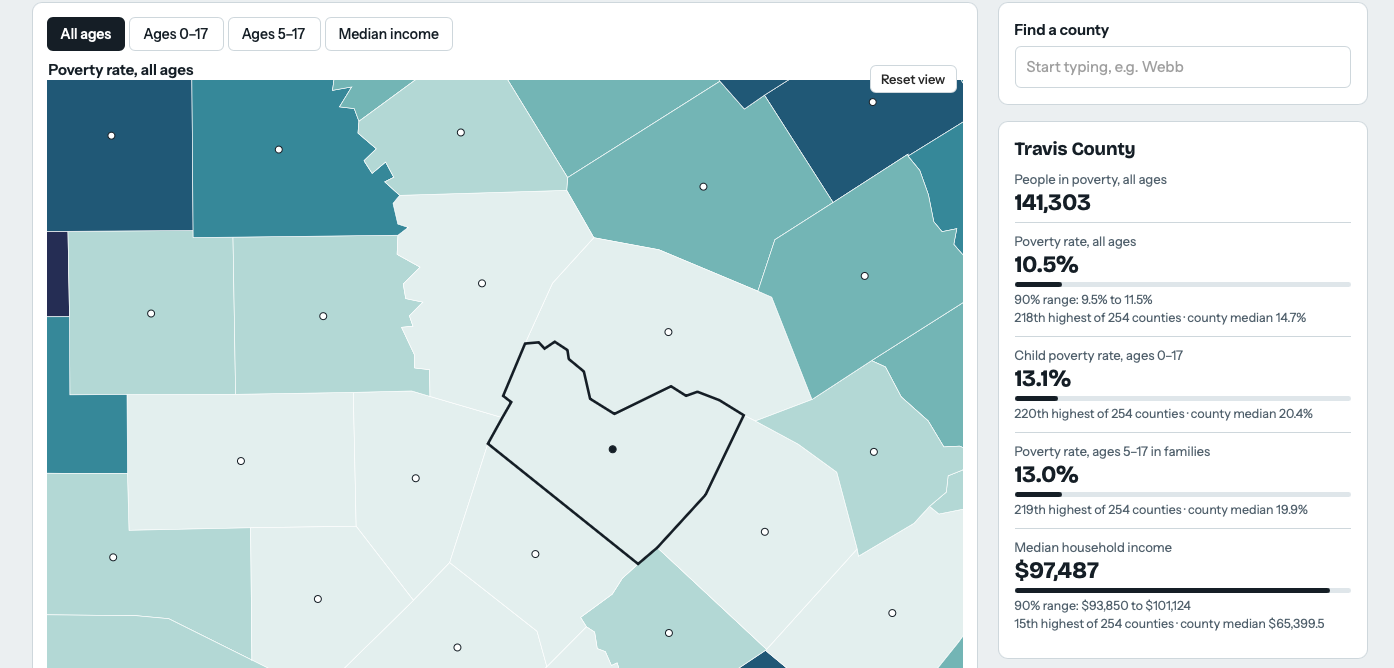
Close up of a county
-
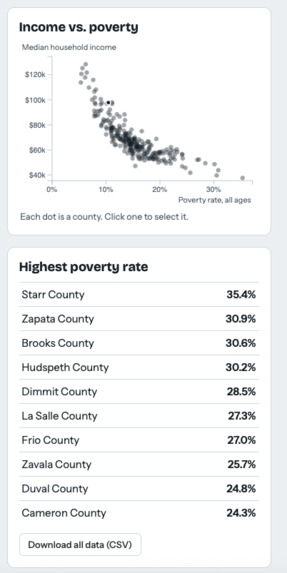
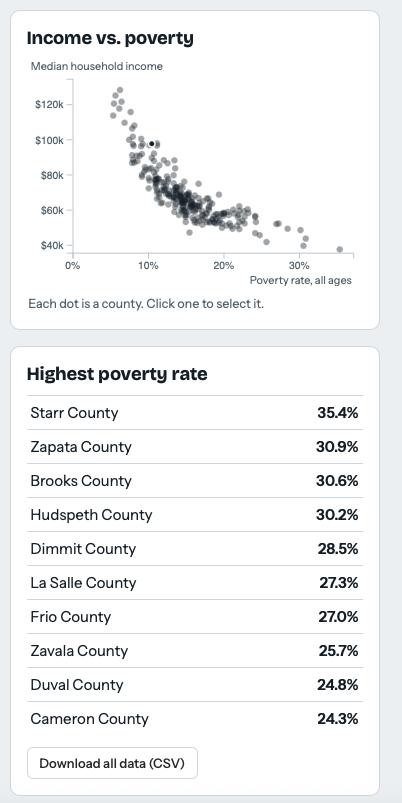
Poverty rate rankings
-
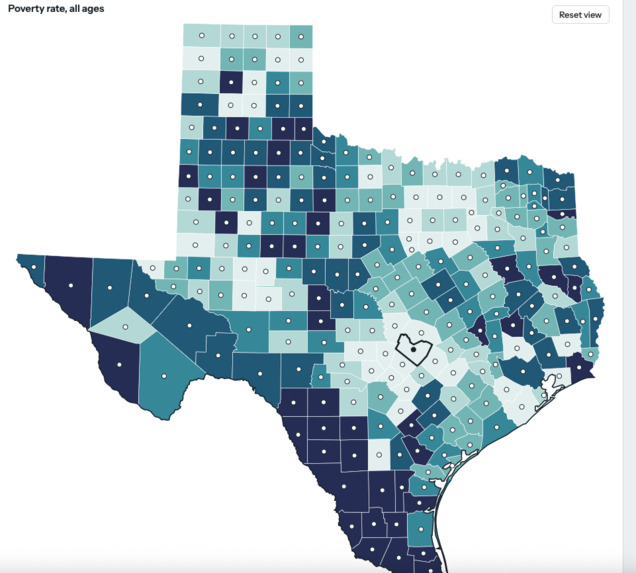
Finished color scheme
-
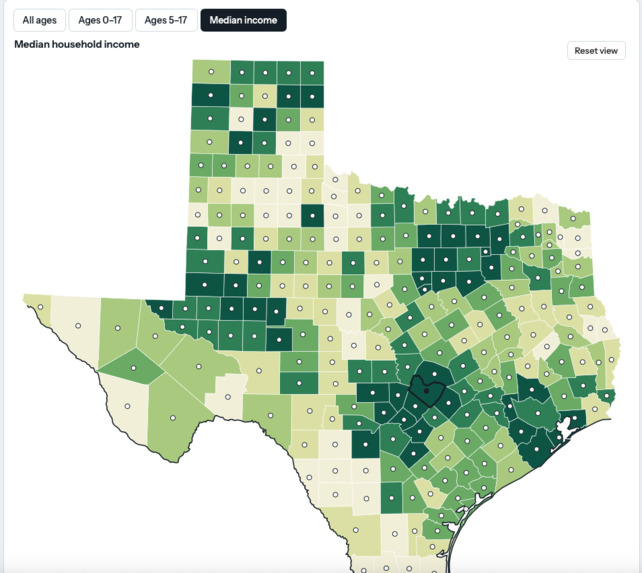
First prototype/color scheme
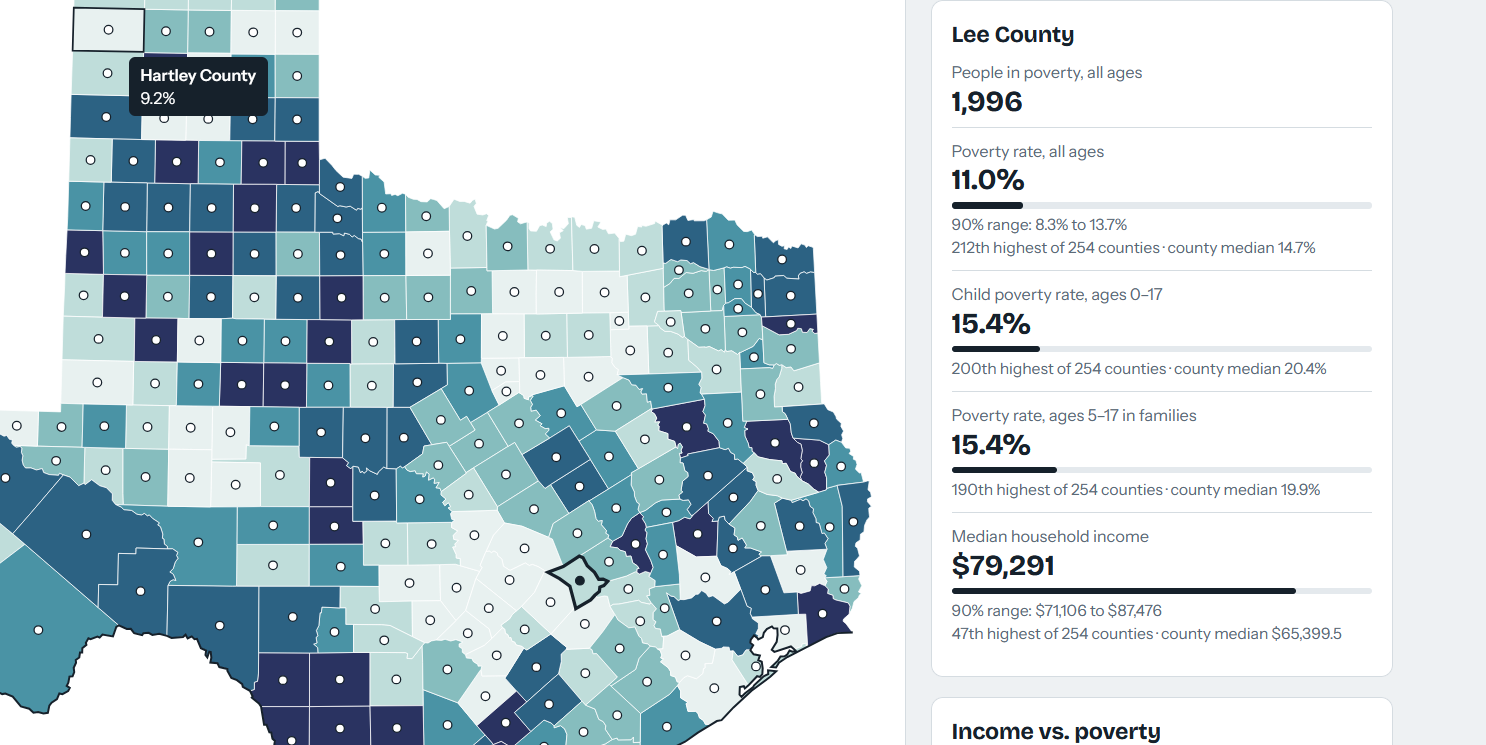
Inspiration
Poverty data is public, but it is hard to use. The U.S. Census Bureau's SAIPE program publishes yearly estimates for every county in the country as a single spreadsheet: 3,196 rows and 31 columns of counts, percentages, and confidence ranges. The numbers are accurate, but nobody can spot a pattern by scanning thousands of rows.
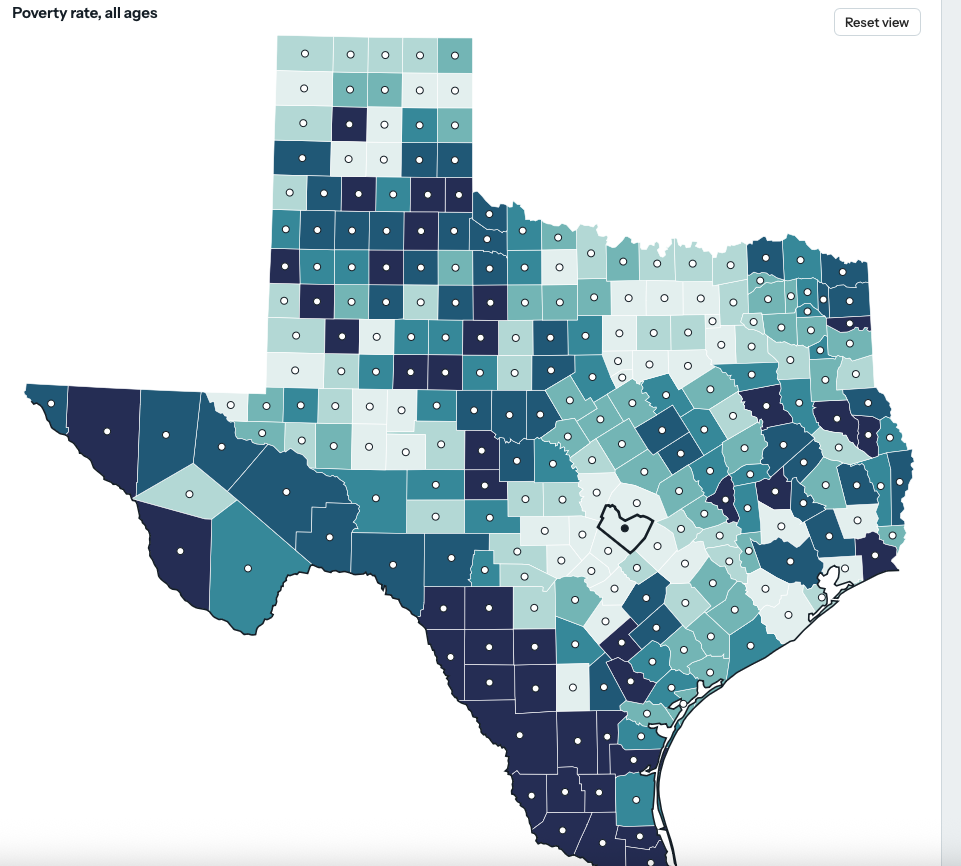
I wanted to answer a simple question: where in Texas is poverty highest, and how does it compare from county to county? A map answers that at a glance, so I set out to turn the spreadsheet into one that anyone can click through.
What it does
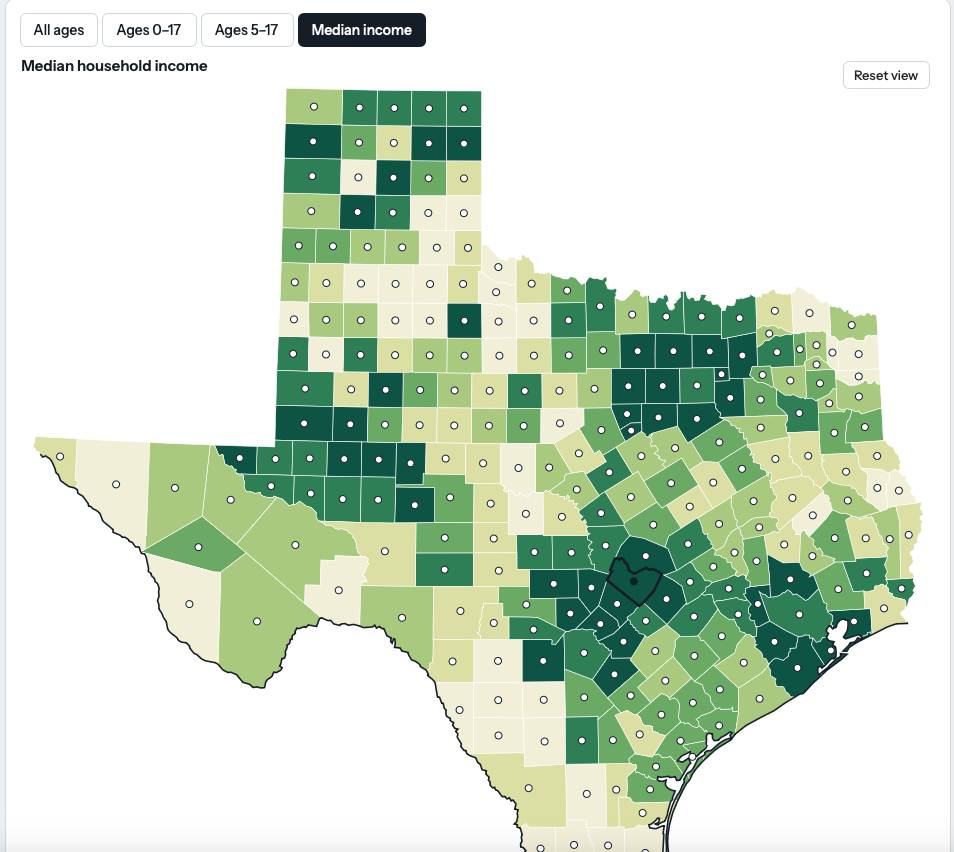
The project is an interactive map of all 254 Texas counties.
- Counties are colored by one of four measures: poverty rate for all ages, ages 0-17, ages 5-17, and median household income.
- Each county has a dot at its center. Click a dot or the county to see its numbers, its rank out of 254, and the 90% margin of error.
- A scatter plot of income against poverty, a county search box, and a CSV download round it out.
How I built it
1. Clean the data with Python (pandas).
- Read the Excel file and give all 31 columns short, readable names.
- Pad the FIPS codes with zeros so the state and county codes line up.
- Keep Texas (state code 48) and drop the statewide total row, which leaves 254 rows.
- Strip the commas and convert text to numbers.
- Keep five columns and save a clean CSV.
2. Draw the map with D3.js.
- Load county outlines from the
us-atlasTopoJSON file and keep the features whose ID starts with48. - Join outlines to data with the 5-digit FIPS code, where a county with code $c$ has ID $48 \times 1000 + c$.
- Project the outlines with a conic equal-area projection and scale Texas to fit the page.
3. Choose colors that mean something. Each measure is split into six quantile classes, so every color covers about the same number of counties:
$$\frac{254}{6} \approx 42 \text{ counties per class}$$
This keeps one extreme county, like Starr County at 35.4%, from washing out the rest of the map.
4. Check the story in the data. The correlation between poverty rate $x$ and median income $y$ across counties is
$$r = \frac{\sum_i (x_i - \bar{x})(y_i - \bar{y})}{\sqrt{\sum_i (x_i - \bar{x})^2}\,\sqrt{\sum_i (y_i - \bar{y})^2}} = -0.82$$
so counties with more poverty tend to have lower incomes. 38 of the 254 counties have a poverty rate of 20% or more.
Tools: Python, pandas, xlrd, D3.js, TopoJSON, HTML/CSS/JavaScript, and Claude as a coding assistant.
Challenges I ran into
- Starting from code I didn't write. The script came from a friend and would not run. Tracing the errors taught me to read tracebacks line by line. The causes were a file in the wrong folder,
__file__not existing in notebooks, and the wrong Excel engine for the file type. - Everything is text. Reading every cell as text keeps codes like
006intact, but it means every number needs converting, including values with commas. - A column that wasn't there. I planned a measure for ages 0-4, but the Census file has no county-level values for that group. I dropped it instead of mapping empty data.
- Boundaries. The file has numbers but no shapes, so the map needed outside county outlines loaded from the internet, and the page needs a connection to draw.
- Uncertainty. Small counties have wide margins of error. I added the 90% range to each county's card so a ranking isn't read as more precise than it is.
What I learned
- Data cleaning was most of the work. Zero-padded codes, total rows hiding among county rows, and text-typed numbers each broke something before they were fixed.
- Joining datasets only works with a reliable shared key, here the FIPS code.
- How data is grouped into color classes changes what a map seems to say.
- Always check the row count: getting exactly 254 told me the Texas filter was right.
- Estimates come with margins of error, and showing them is part of presenting data honestly.
What's next
County-to-county comparison, a sortable table, shading by margin of error, and a version that works offline.
