-
-
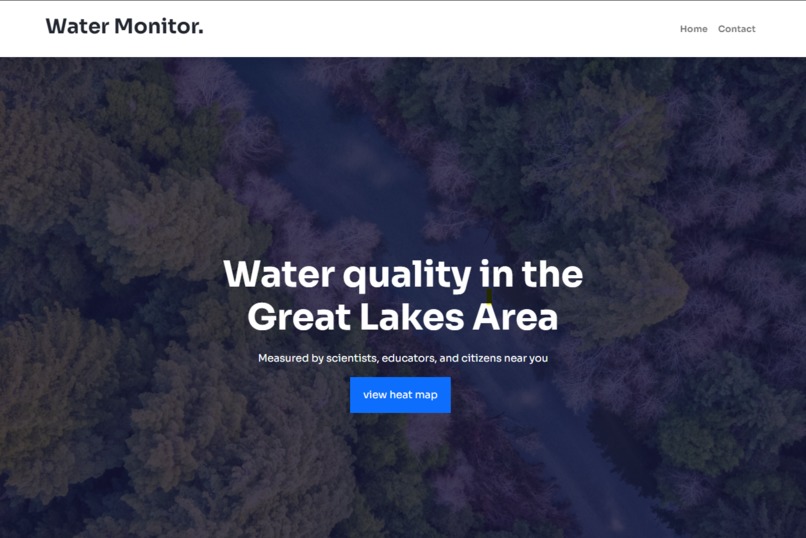
Landing Page
-
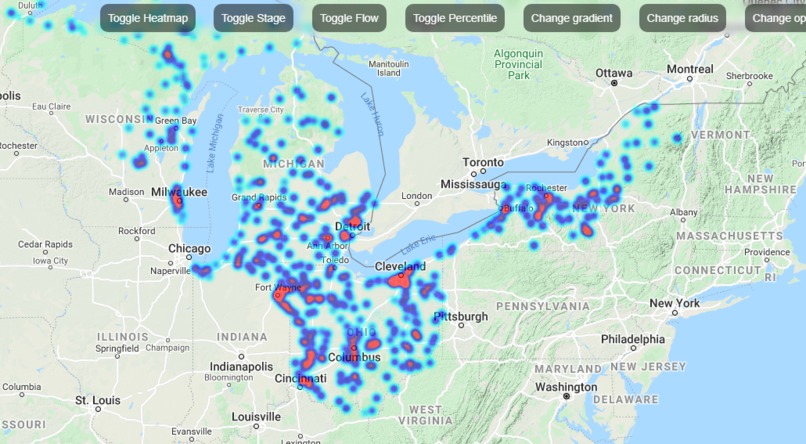
Percentile of river discharge locations, represented by heat map
-
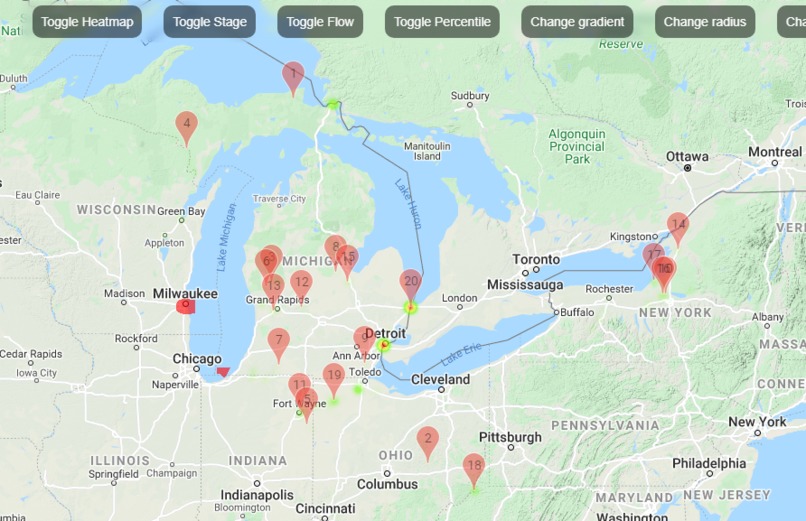
Top 20 Flow data points represented by markers on map, and by heat map


How we built it
We first accessed a GDLW data API to get the pollution values(flow, stage, percentile). We used the Google Heatmap API to build the map and show the hotspots indicating the levels of pollution of the water bodies. Since we got all the values of altitudes, longitudes as well as the pollution data from the GLDW JSON object, it was easy to create markers and hotspots at the right placeson the Google map
Challenges we ran into
1) Creating the Google heatmap successfully
2)Parsing the JSON object created by GLDW API
3)Showing markers as well as the heatspots at the same time
Accomplishments that we're proud of
We are extremely proud of making an end to end website that displays the pollution levels in the water bodies and learnig new technology like using Google Heatmap API's and creating our own API key
What we learned
1) How to search for appropriate data sets.
2) How to succesfully connect to the Google maps API
3) How to successfully be able to read the data from the GLDW API and send t to the Google Maps API
What's next for Water Monitor
1) Locate more datasets and add them to the map.
2) Create a Prediction ML model, that will be able to predict the pollution levels of these water bodies


Log in or sign up for Devpost to join the conversation.