-
-
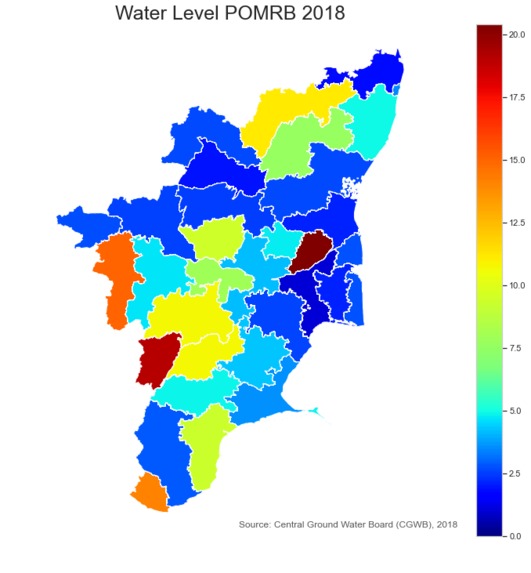
water level for post - monsoon (2018)
-
The idea


Inspiration
India is backed up by agriculture and Ground water becomes a necessary source for irrigation. That's why we decided to step up and do our job to help agriculture and as well the environment.
What it does
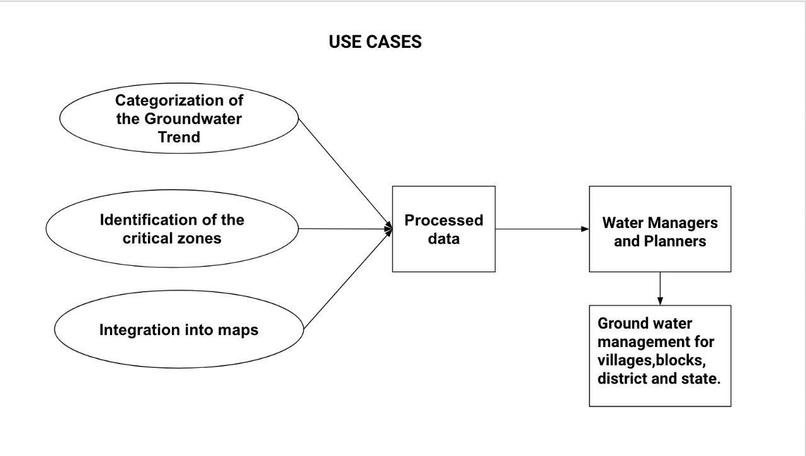
The decadal average of the pre and post monsoon groundwater level is compared with the present situation. The villages,blocks,districts and states showing improvement / decline with time ( one decade ) are located The random forest regression prediction model is used to categorize the trend of the improvement / decline in terms of villages,blocks,districts and states with high improved accuracy. Based on the predictions, the improvement / declining trend, critical zones are identified and represented in maps
How we built it
We used Jupyter Kernel to train and test our models (using scikit-learn) and geoplot, geopandas to plot the values to a map.
Challenges we ran into
The dataset we had was limited to a particular state (TamilNadu) and the dataset itself had a lot of anamolies and NaN values. This made preprocessing difficult.
Accomplishments that we're proud of
Build a model and plot it in a graph
What we learned
Learnt a lot about Tech and Machine learning stuffs
What's next for Water level predictor
More complex analysis with huge area of consideration
Built With
- geopandas
- geoplot
- jupyter
- numpy
- pandas
- python
- scikit-learn
- seaborn


Log in or sign up for Devpost to join the conversation.