-
-
Home screen
Inspiration
Seeing AI and data centres grow made me think about the responsibility that comes with building AI. The infrastructure behind it uses energy and, depending on the cooling system, water. The IEA's Energy and AI report and Berkeley Lab's data-centre research give useful background on those resource demands. I want AI to help people inspect the systems and environmental risks around that infrastructure.
I started with one concrete question: when a water sensor reading looks wrong, what should an operator check next? A change in turbidity can come from the water itself, a sensor issue, maintenance or a gap in telemetry. The useful next step depends on the evidence available at that time.
Water Diagnostics is my first step toward a broader environmental-monitoring ecosystem. The current prototype focuses on water-sensor investigations using historical river observations and clearly labelled simulation. Data-centre cooling and energy monitoring are future applications, not capabilities demonstrated by this project. EPA's source-water monitoring guidance and the USGS continuous-monitor procedures helped me understand the operator investigation workflow. These sources do not validate or endorse my project.
What it does
The app lets someone investigate a historical river replay or one of six clearly labelled synthetic cases. It checks timestamp freshness, signal variation, device status, maintenance context and related measurements. Each report connects possible explanations to the checks that actually ran. The operator can open the evidence and download the report.
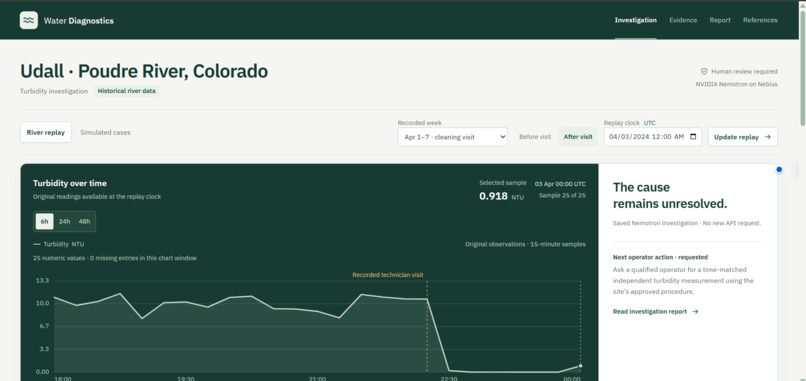
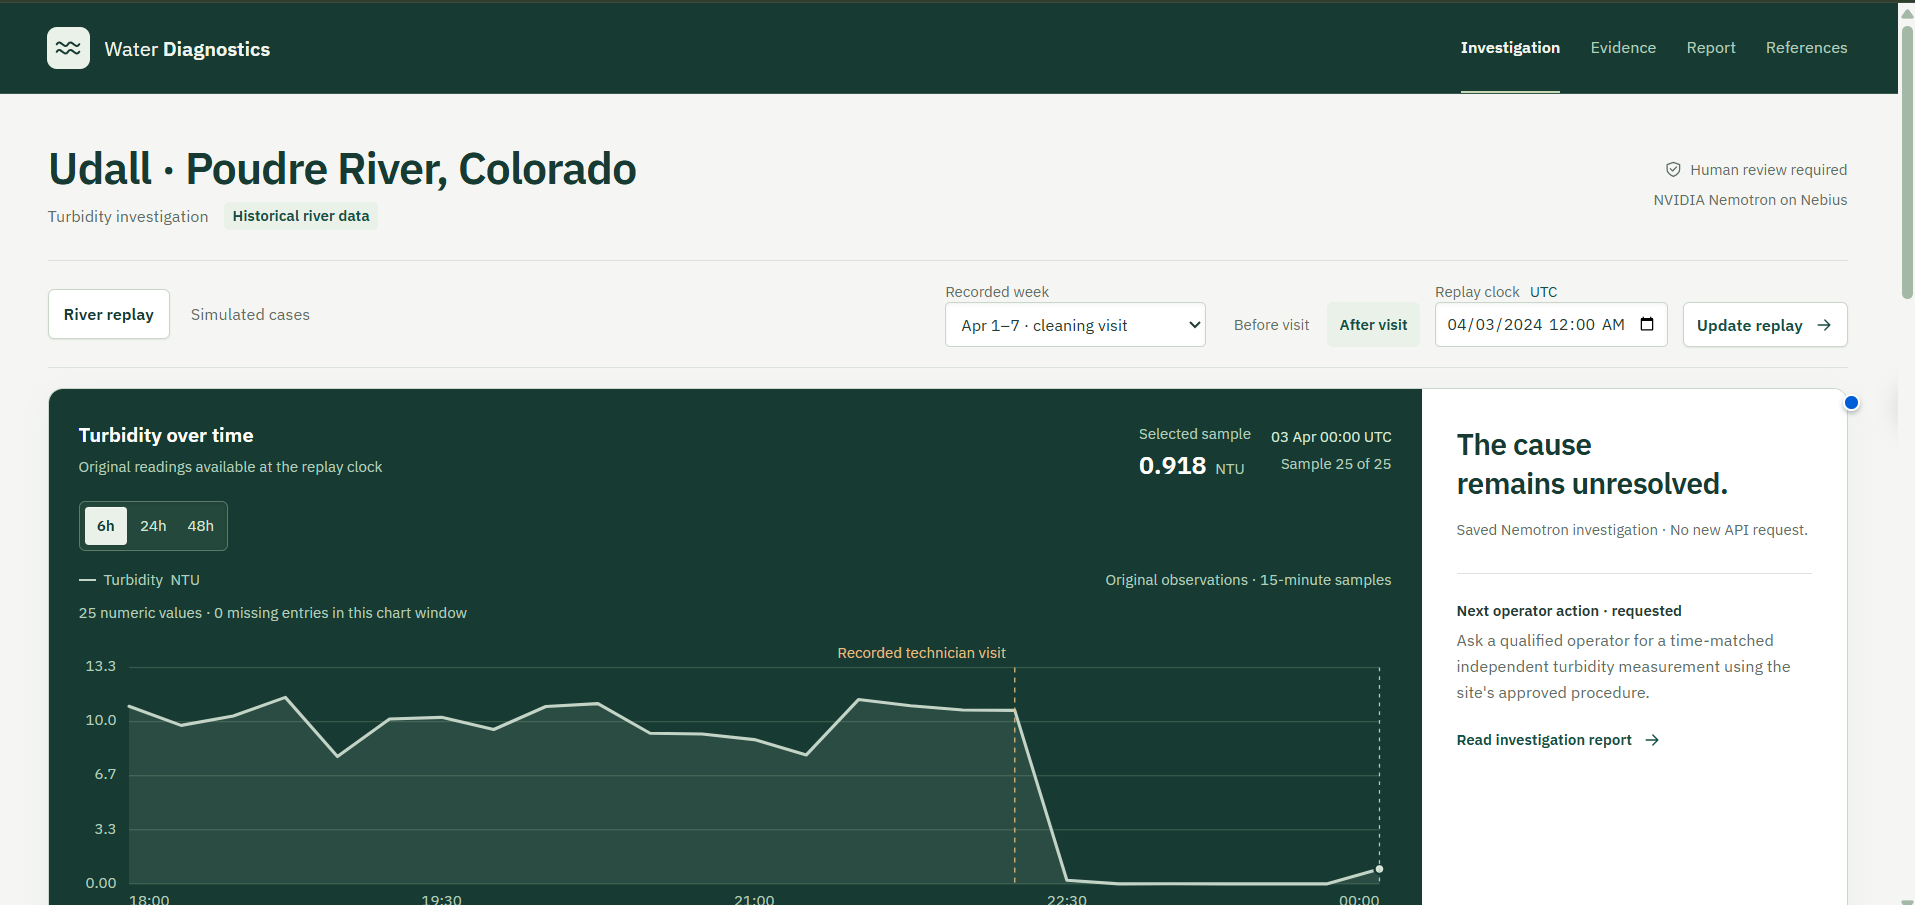
One recorded case shows why this matters. The latest turbidity sample is fresh, but the earlier 48-hour window still has 162 missing entries. Technician notes describe battery and logging interruptions. The report asks for collector records and independent confirmation, while keeping the cause unresolved. A complete investigation can still need more evidence.
There is also a separate recovery simulation. A local policy permits one collector reconnect and then checks for new valid packets. It records either verified telemetry recovery or escalation. It does not operate real equipment or send a notification.
How I used Nebius and NVIDIA Nemotron
The Python backend calls nvidia/NVIDIA-Nemotron-3-Nano-30B-A3B through Nebius Token Factory. Nemotron selects the approved tools and submits a constrained conclusion. Python calculates the results and enforces the evidence citations, permitted conclusions and report wording.
I used the hosted model through the API. I did not train or fine-tune it, download model weights or create a GPU VM. Explicit run buttons, bounded tool calls and local spending guards helped me work within a small development budget.
How I used Tavily
Tavily is an optional research tool for the operator. An explicit lookup searches for monitoring guidance from allowlisted USGS, EPA and manufacturer sources. The app shows the source links and whether the result is fresh or cached. Results are cached for 24 hours to avoid repeat searches.
The search uses a fixed topic query. Sensor readings and technician notes are not included in that query. These references stay separate from incident evidence and are not sent to Nemotron or used to change its diagnosis. The fixed public reference links are also labelled separately from Tavily results.
How I built it
The application uses Python, Pydantic and HTTPX for the backend, with an HTML, CSS and JavaScript dashboard. I added replay clocks so future readings and unavailable notes stay outside an investigation. The numerical checks read original observations, not retrospective quality-control answers or corrected values.
The interface follows an instrument-console style: the recorded signal sits beside the requested operator action, missing entries stay visible, and the evidence workbench shows which checks were performed. The public replay demo runs on Render. The source code is MIT licensed.
Testing and challenges
The October 30 release passed 178 local tests, with CI checks on Windows, Ubuntu and macOS. Testing covers evidence consistency, replay visibility, report validation, spending guards, public API restrictions, temporary visitor-key isolation and simulated recovery. Fresh hosted investigations were also checked against executed evidence across designed synthetic cases and selected river clocks. Two real-data weeks are included.
The difficult part was keeping the report honest when information was missing or a model response stopped early. An output-limit failure remained incomplete and was preserved. Adjusting the model's direct tool-calling mode helped later investigations finish. The qualification record includes the scope and earlier attempts.
These tests describe the guarded model-plus-Python workflow. They are not field accuracy, an independent benchmark or a measured reduction in operator workload. I have not deployed this at a treatment plant or established water safety.
Try it and what is next
The public demo works without login. Recorded data, saved Nemotron reports, fresh free local checks, downloads and recovery simulations need no API key. Visitors can optionally connect their own Nebius key for a temporary 30-minute connection and explicitly start fresh inference; those calls use the visitor's Nebius account. Disconnect removes the stored key. Fresh Tavily search remains available in the local source build with a personal key. The judge guide explains setup and the free walkthrough.
The demo video shows fresh Nebius inference, a Tavily lookup, report export and a clearly labelled still view of a saved recovery simulation report.
My next step is feedback from a water-quality technician or operator, followed by an agreed read-only pilot. After that, I want to explore a broader environmental-monitoring ecosystem for water, cooling and energy telemetry, including possible data-centre applications. That would require site-specific data, domain review and field validation. A Raspberry Pi could later act as a telemetry gateway. Physical repairs and process control would need separate hardware work and validation. Environmental savings have not been measured by this prototype.
Data and credits
Historical measurements and technician context come from the CSU ROSS / Poudre Water Quality Network High-Frequency Water Quality Sensor Dataset, licensed under CC BY 4.0. I selected two Udall weeks and converted the original CSV records to JSON. Missing values were retained. Note availability at the following UTC midnight is an explicit replay assumption because actual entry times were not supplied.
Full data, font and service credits are in THIRD_PARTY.md. Raspberry Pi collection, plant control and field-impact claims remain future work.
Built With
- css3
- html5
- httpx
- javascript
- nebius
- nemotron
- pydantic
- pytest
- python
- render
- tavily
