
Inspiration
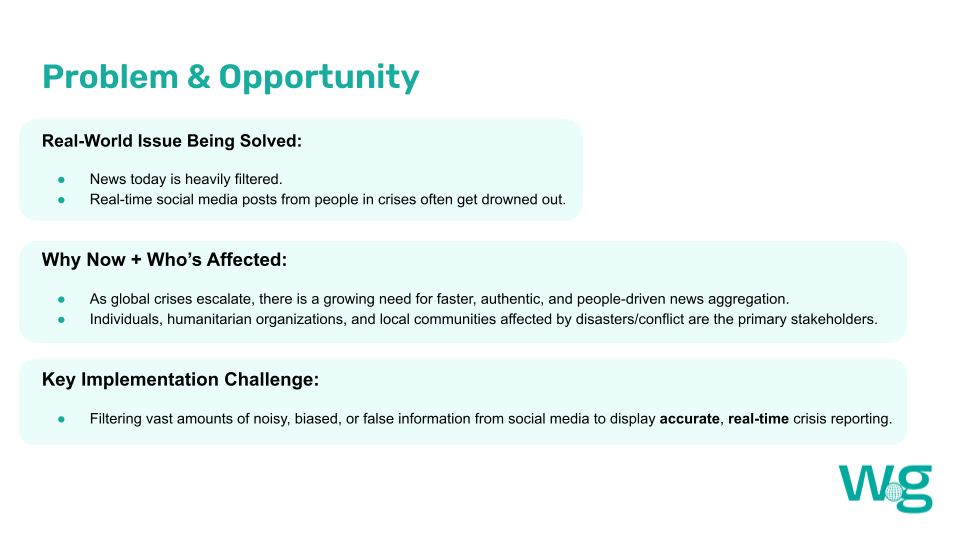
In today’s digitally connected world, the integration of social media into daily life has significantly altered how individuals consume global news. While information is more accessible than ever, the average person’s exposure to major developments often depends on trending news cycles and is influenced by the inherent biases of traditional media outlets.
What it does
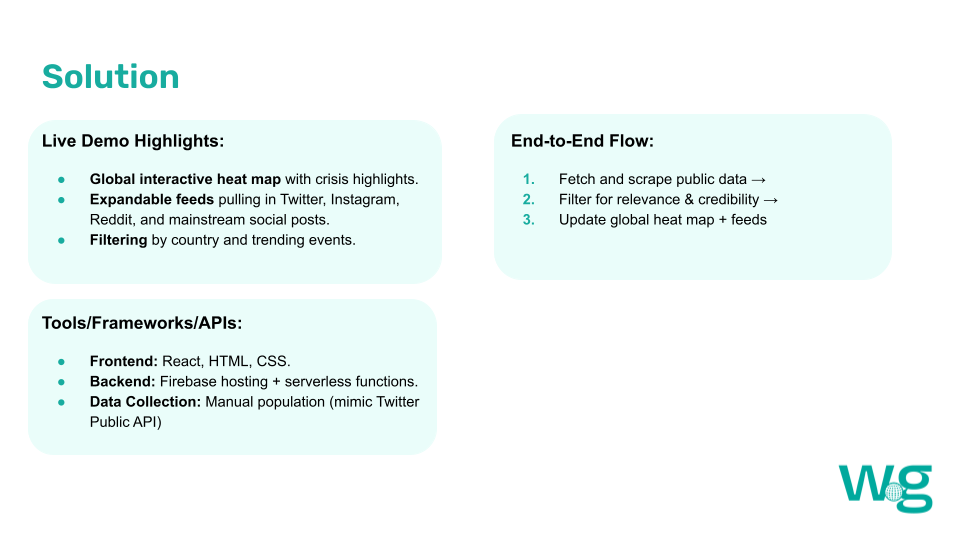
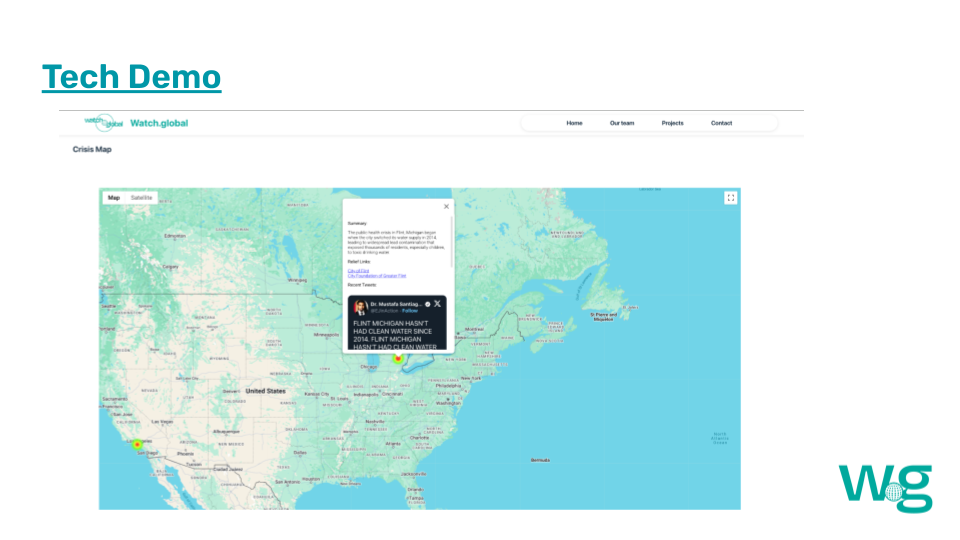
Our web app aggregates social media posts about crises, geolocates them, and displays a frequency-based heatmap so users can see where crises are happening and the impact they are having, directly from public voices. Our app gives agency back to the people, preventing censorship and bringing awareness to crises outside of the mainstream media.
How we built it
We built our webapp using React on the frontend, Firebase for our APIs, and Firestore's NoSQL database. The heatmap was generated using Google Map's API. Post data is intended to be aggregated from X (Twitter), Instagram, TikTok and Facebook using the platform's provided APIs.
Challenges we ran into
- Platform's charge for API access, proving limited or no access under a free tier. This prevented us from automatically performing the data aggregation we wanted to do. For demo purposes, the data was populated manually.
- Due to the lack of automated data collection, we were unable to fit the natural language processing models to decipher relevant posts.
Accomplishments that we're proud of
- Getting Google maps heat map to work
- Setting up serverless functions and a NoSQL database with dummy data
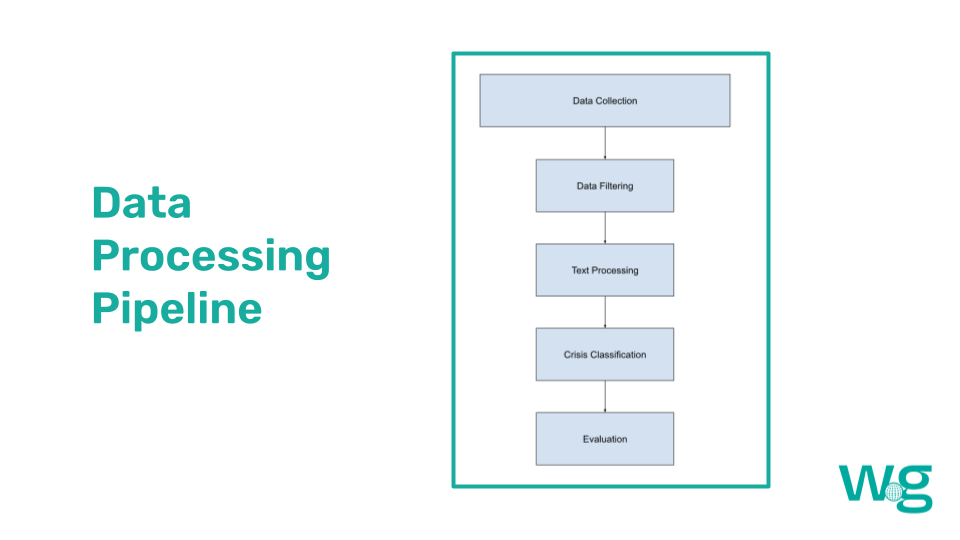
- Designed the High-Level architecture for a Multimodal NLP data processing pipeline
What we learned
We learned a lot about working as a team - how to divide workload, and how to bug fix and troubleshoot. We also learned a lot about the API ecosystem and how expensive it is to create a service reliant upon data from other API services such as social media. We theorized how to sort data to get real results to make our heatmap more relevant and accurate.
What's next for watch.global: Real-time Crisis Mapping Powered by the People
We may continue this to full project scale as a non-profit, based on feedback received!


Log in or sign up for Devpost to join the conversation.