-
-
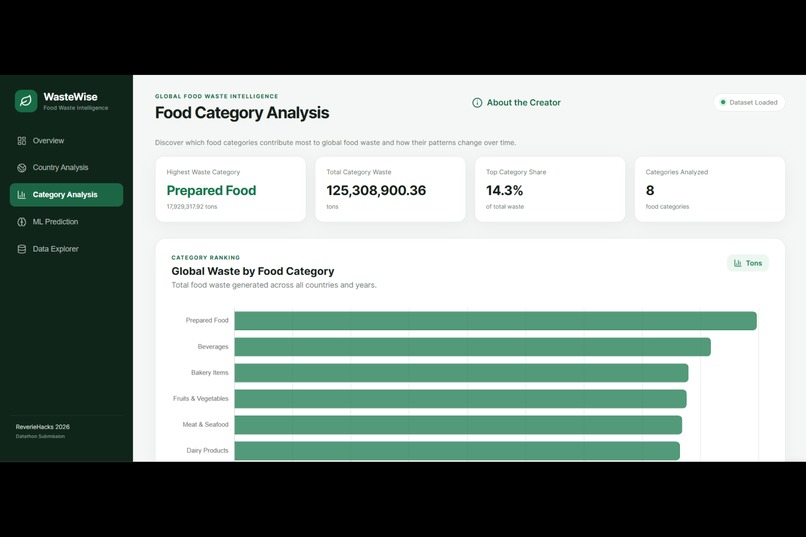
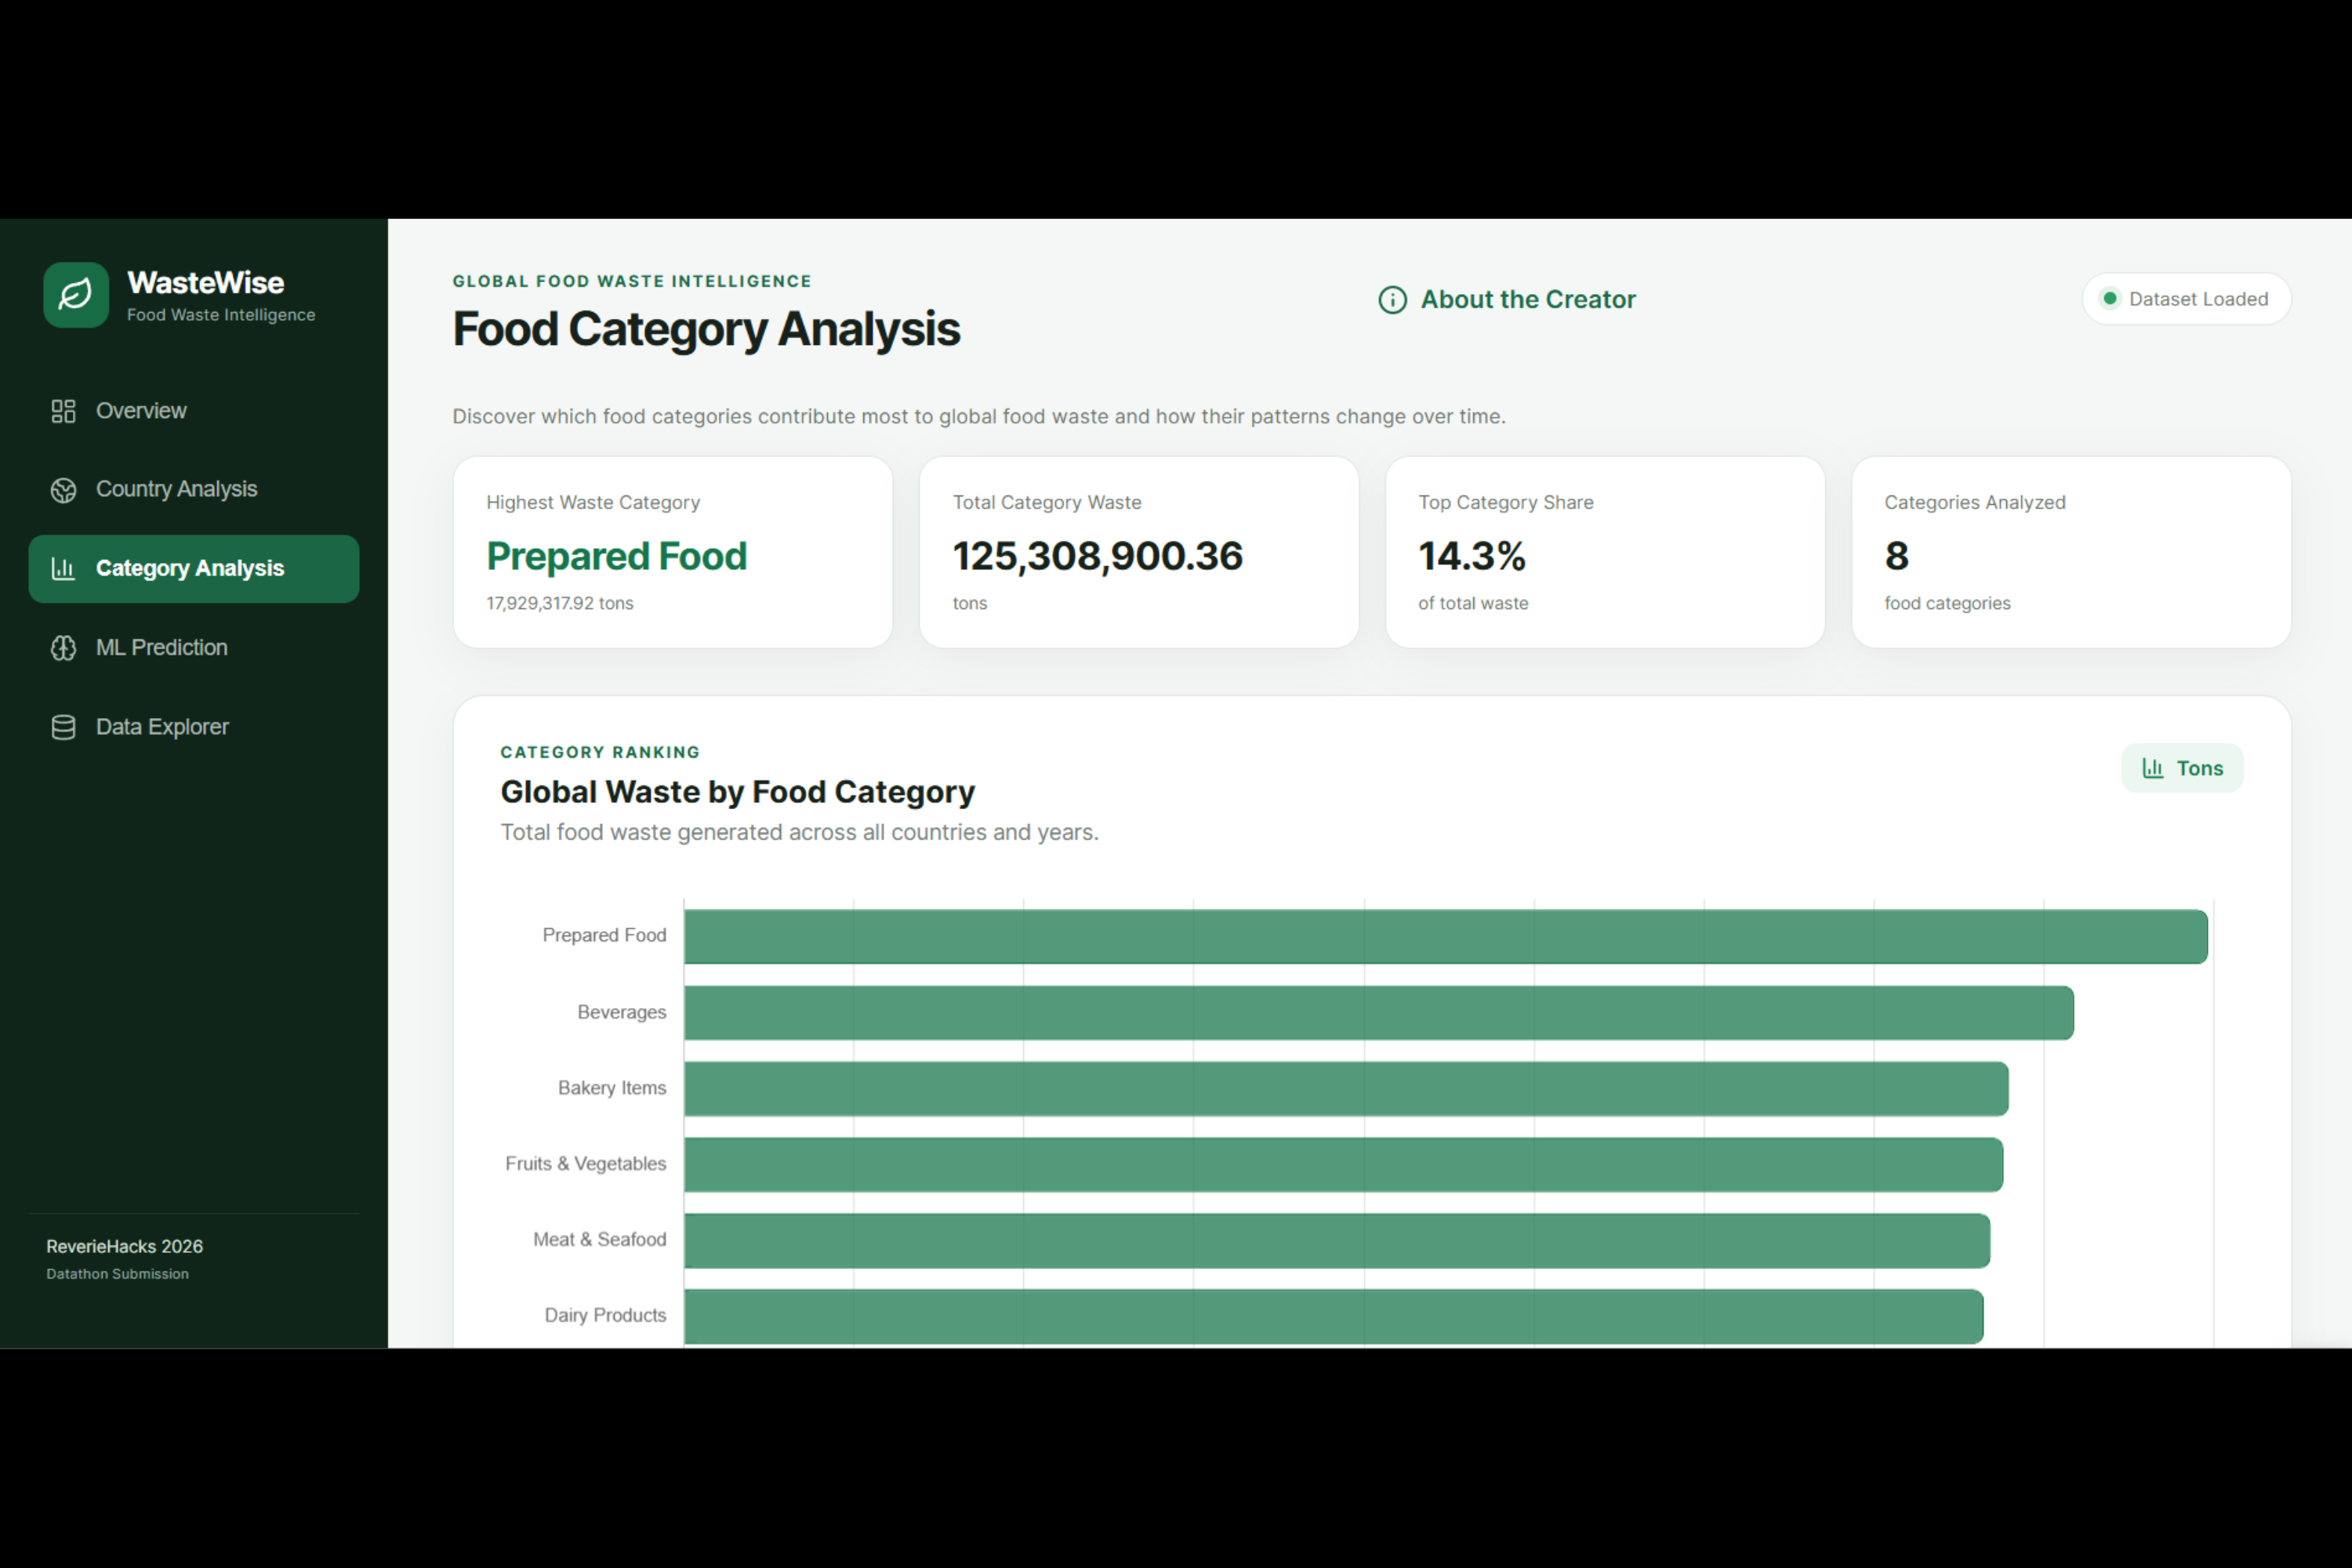
Discover which food categories contribute most to global food waste and how their patterns change over time
-
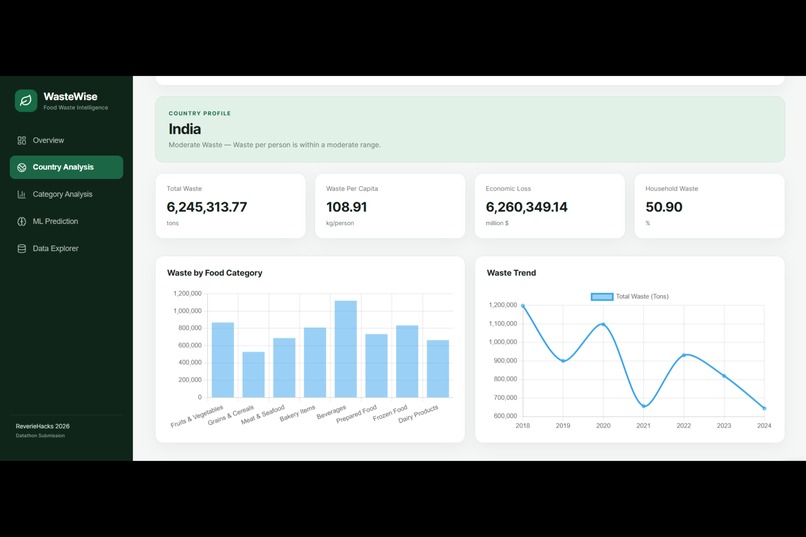
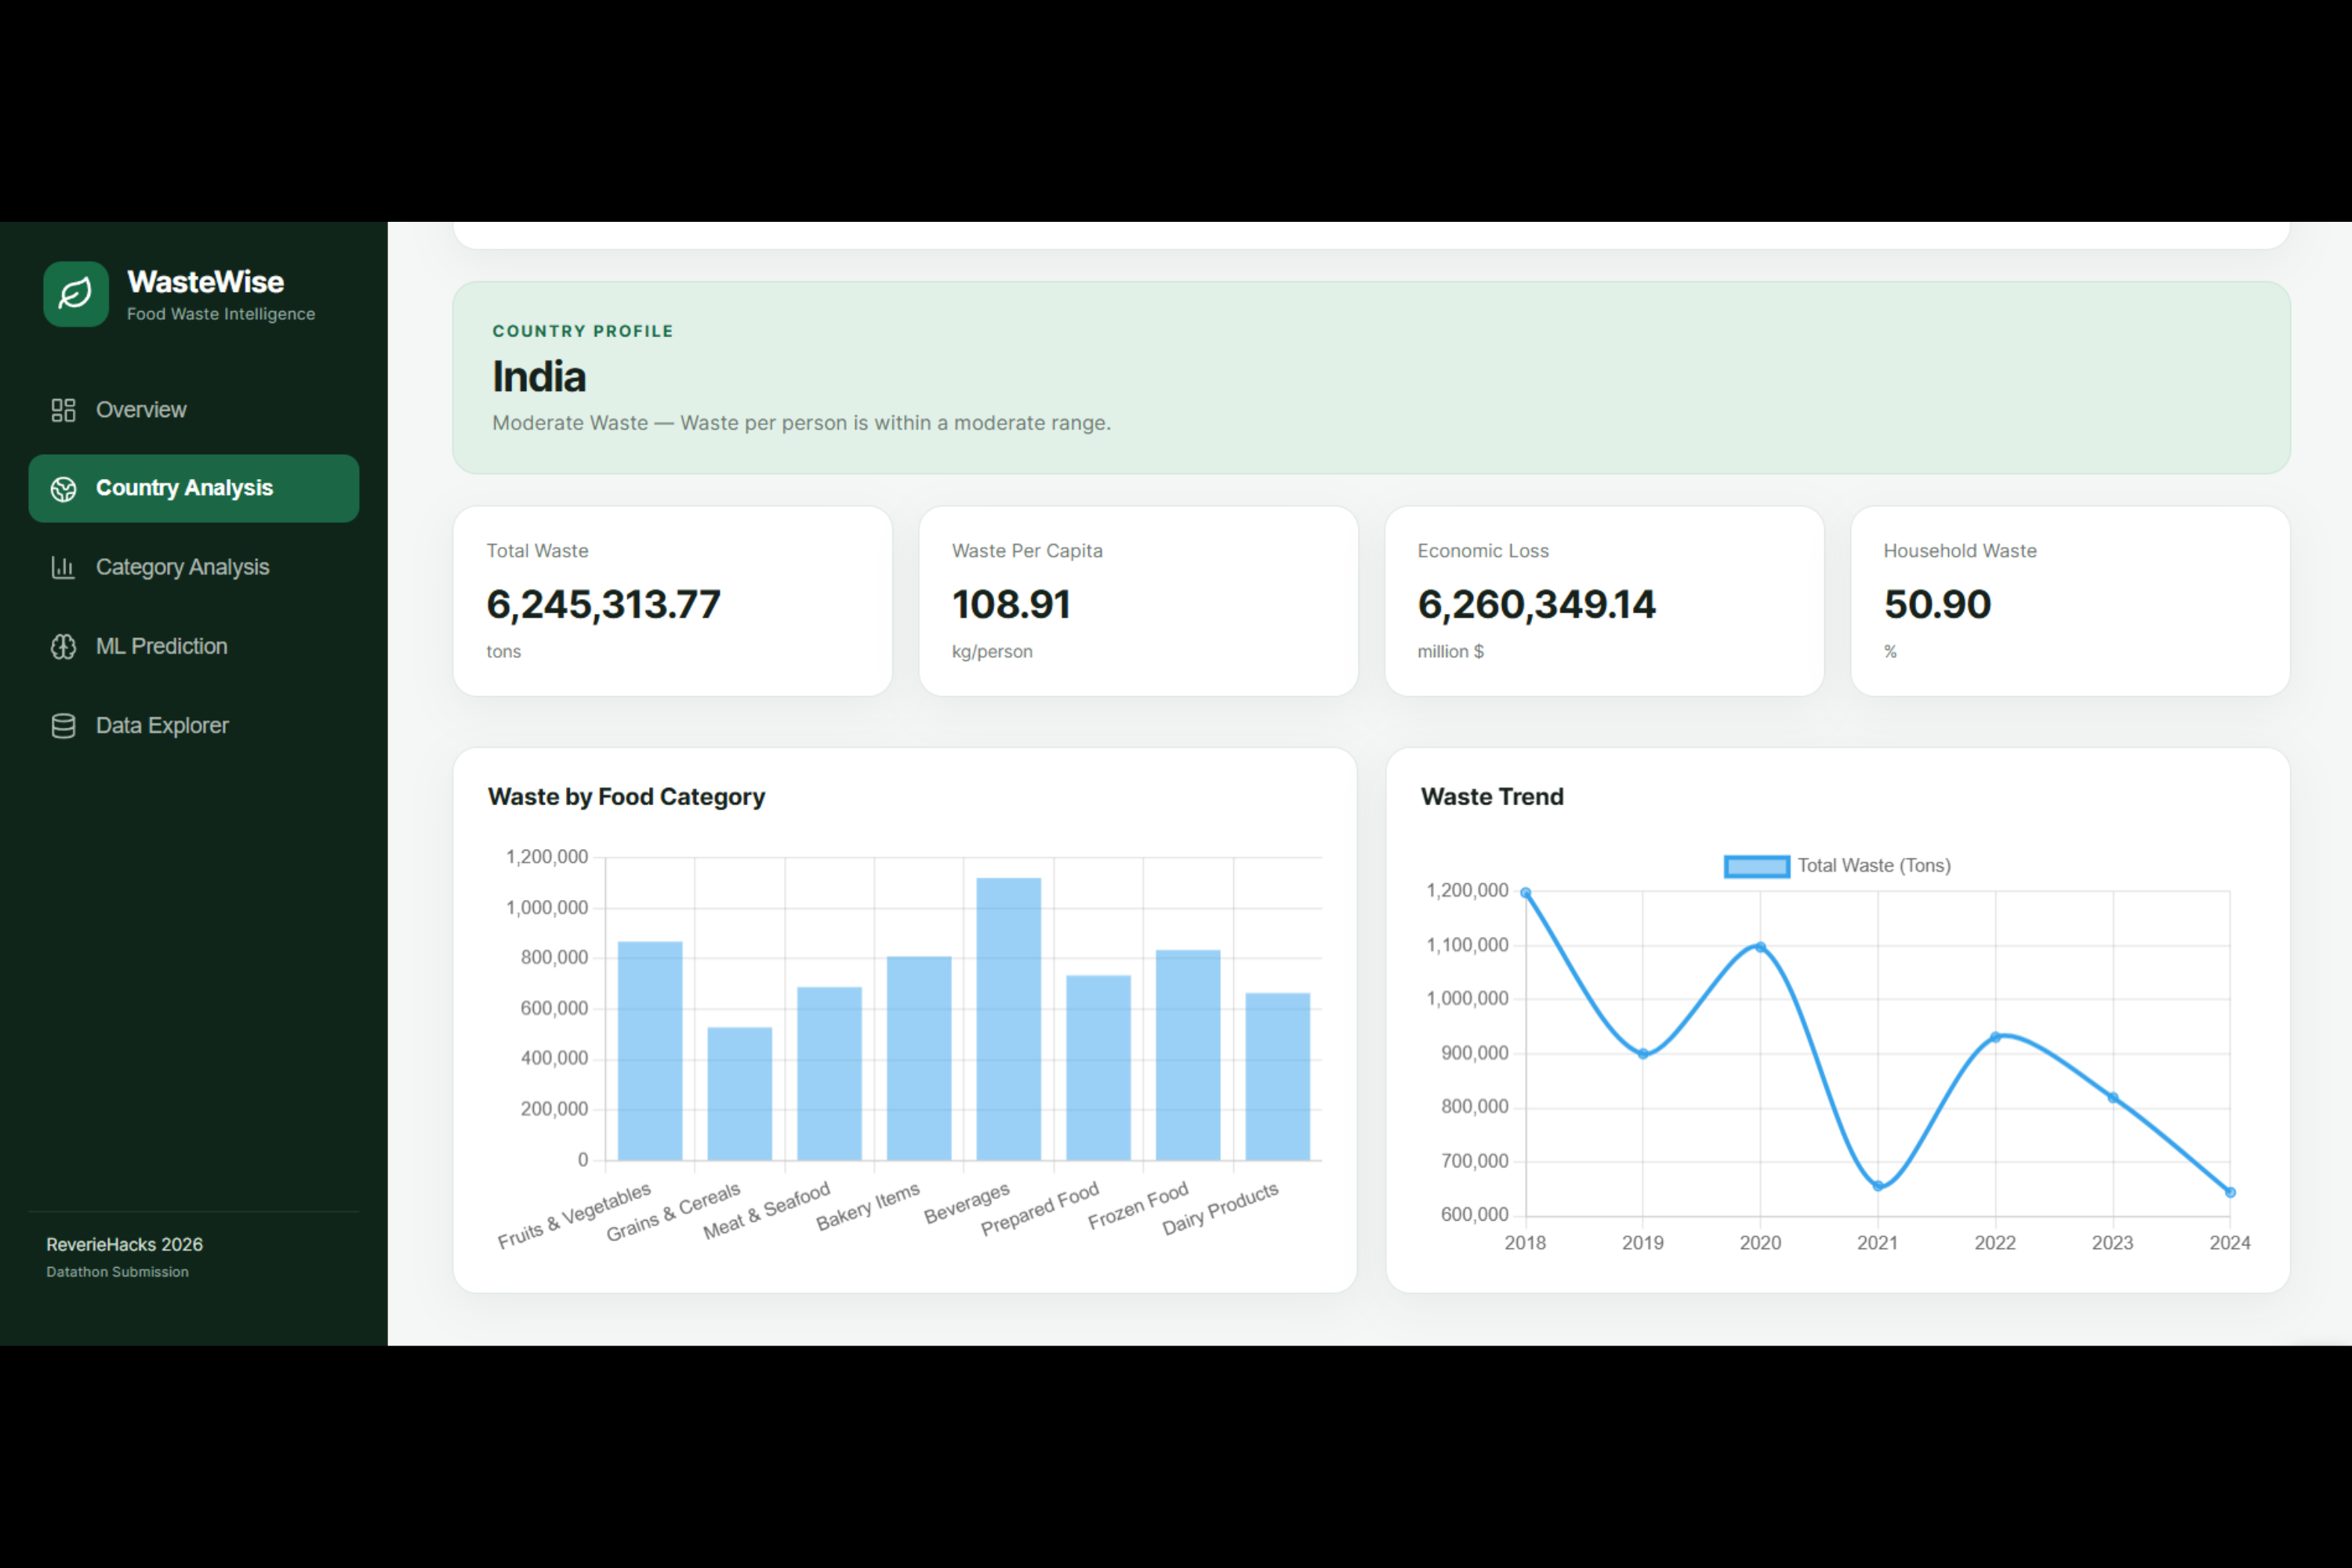
Choose a country to explore its data
-
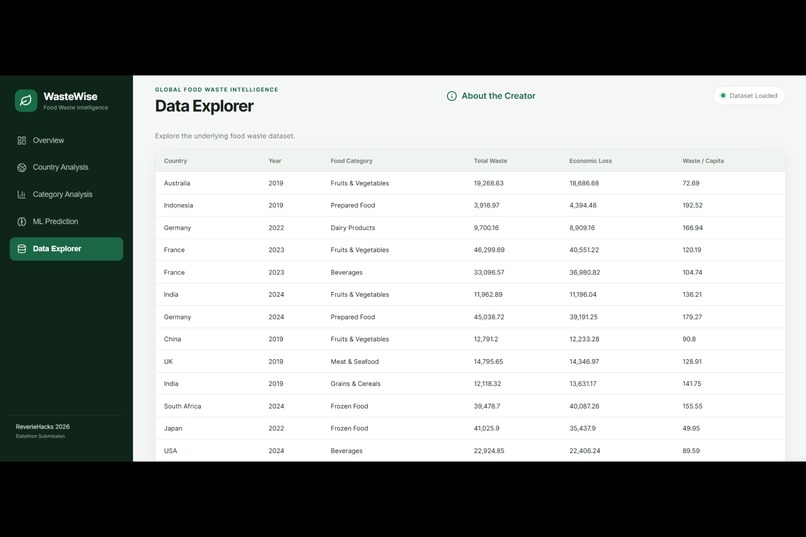
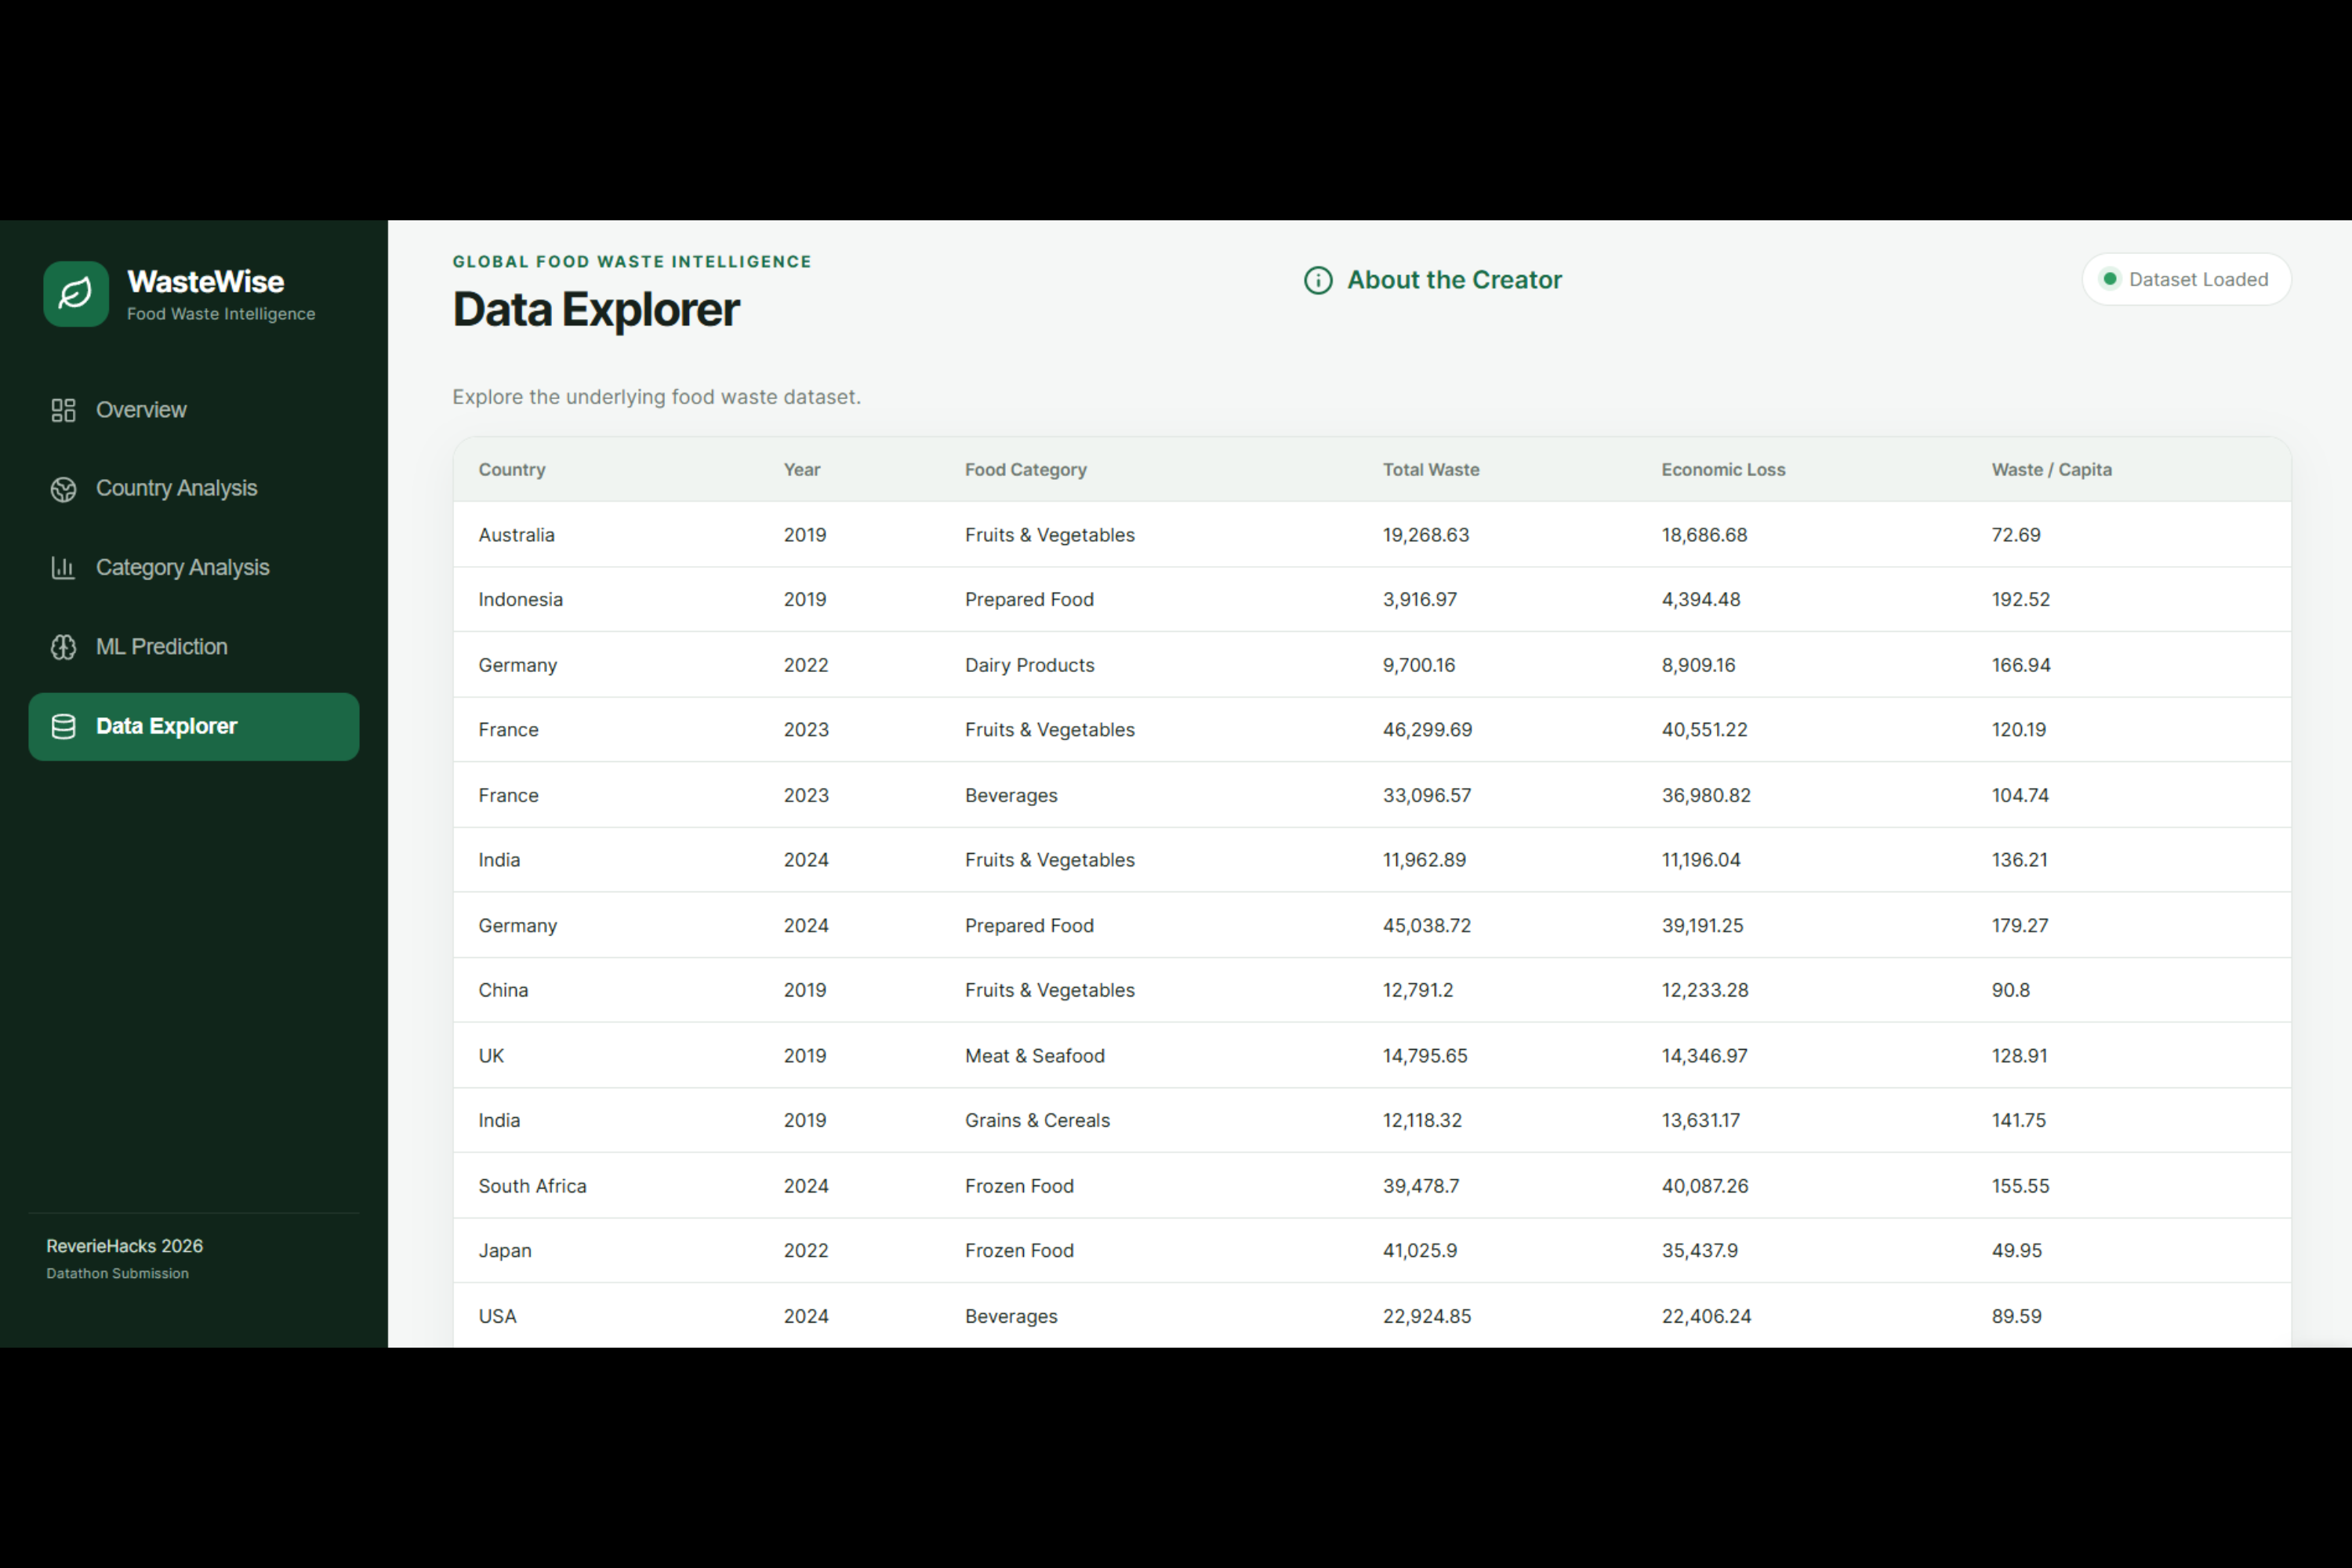
Explore the underlying food waste dataset
-
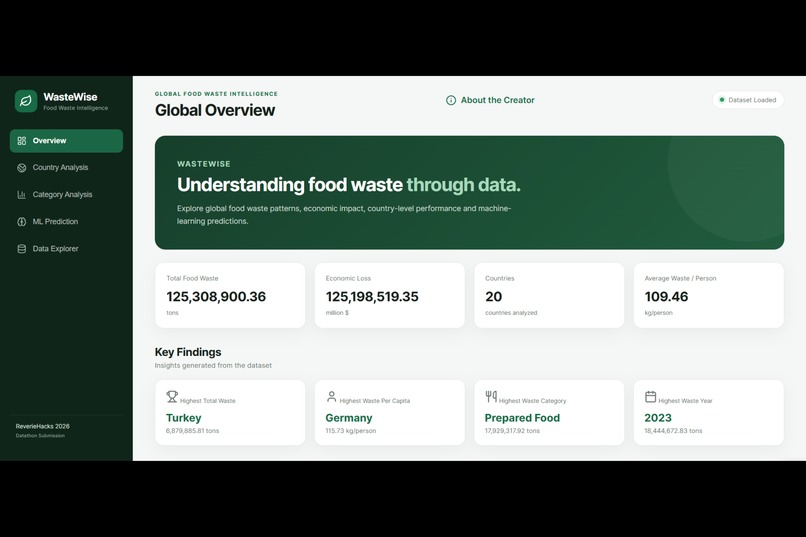
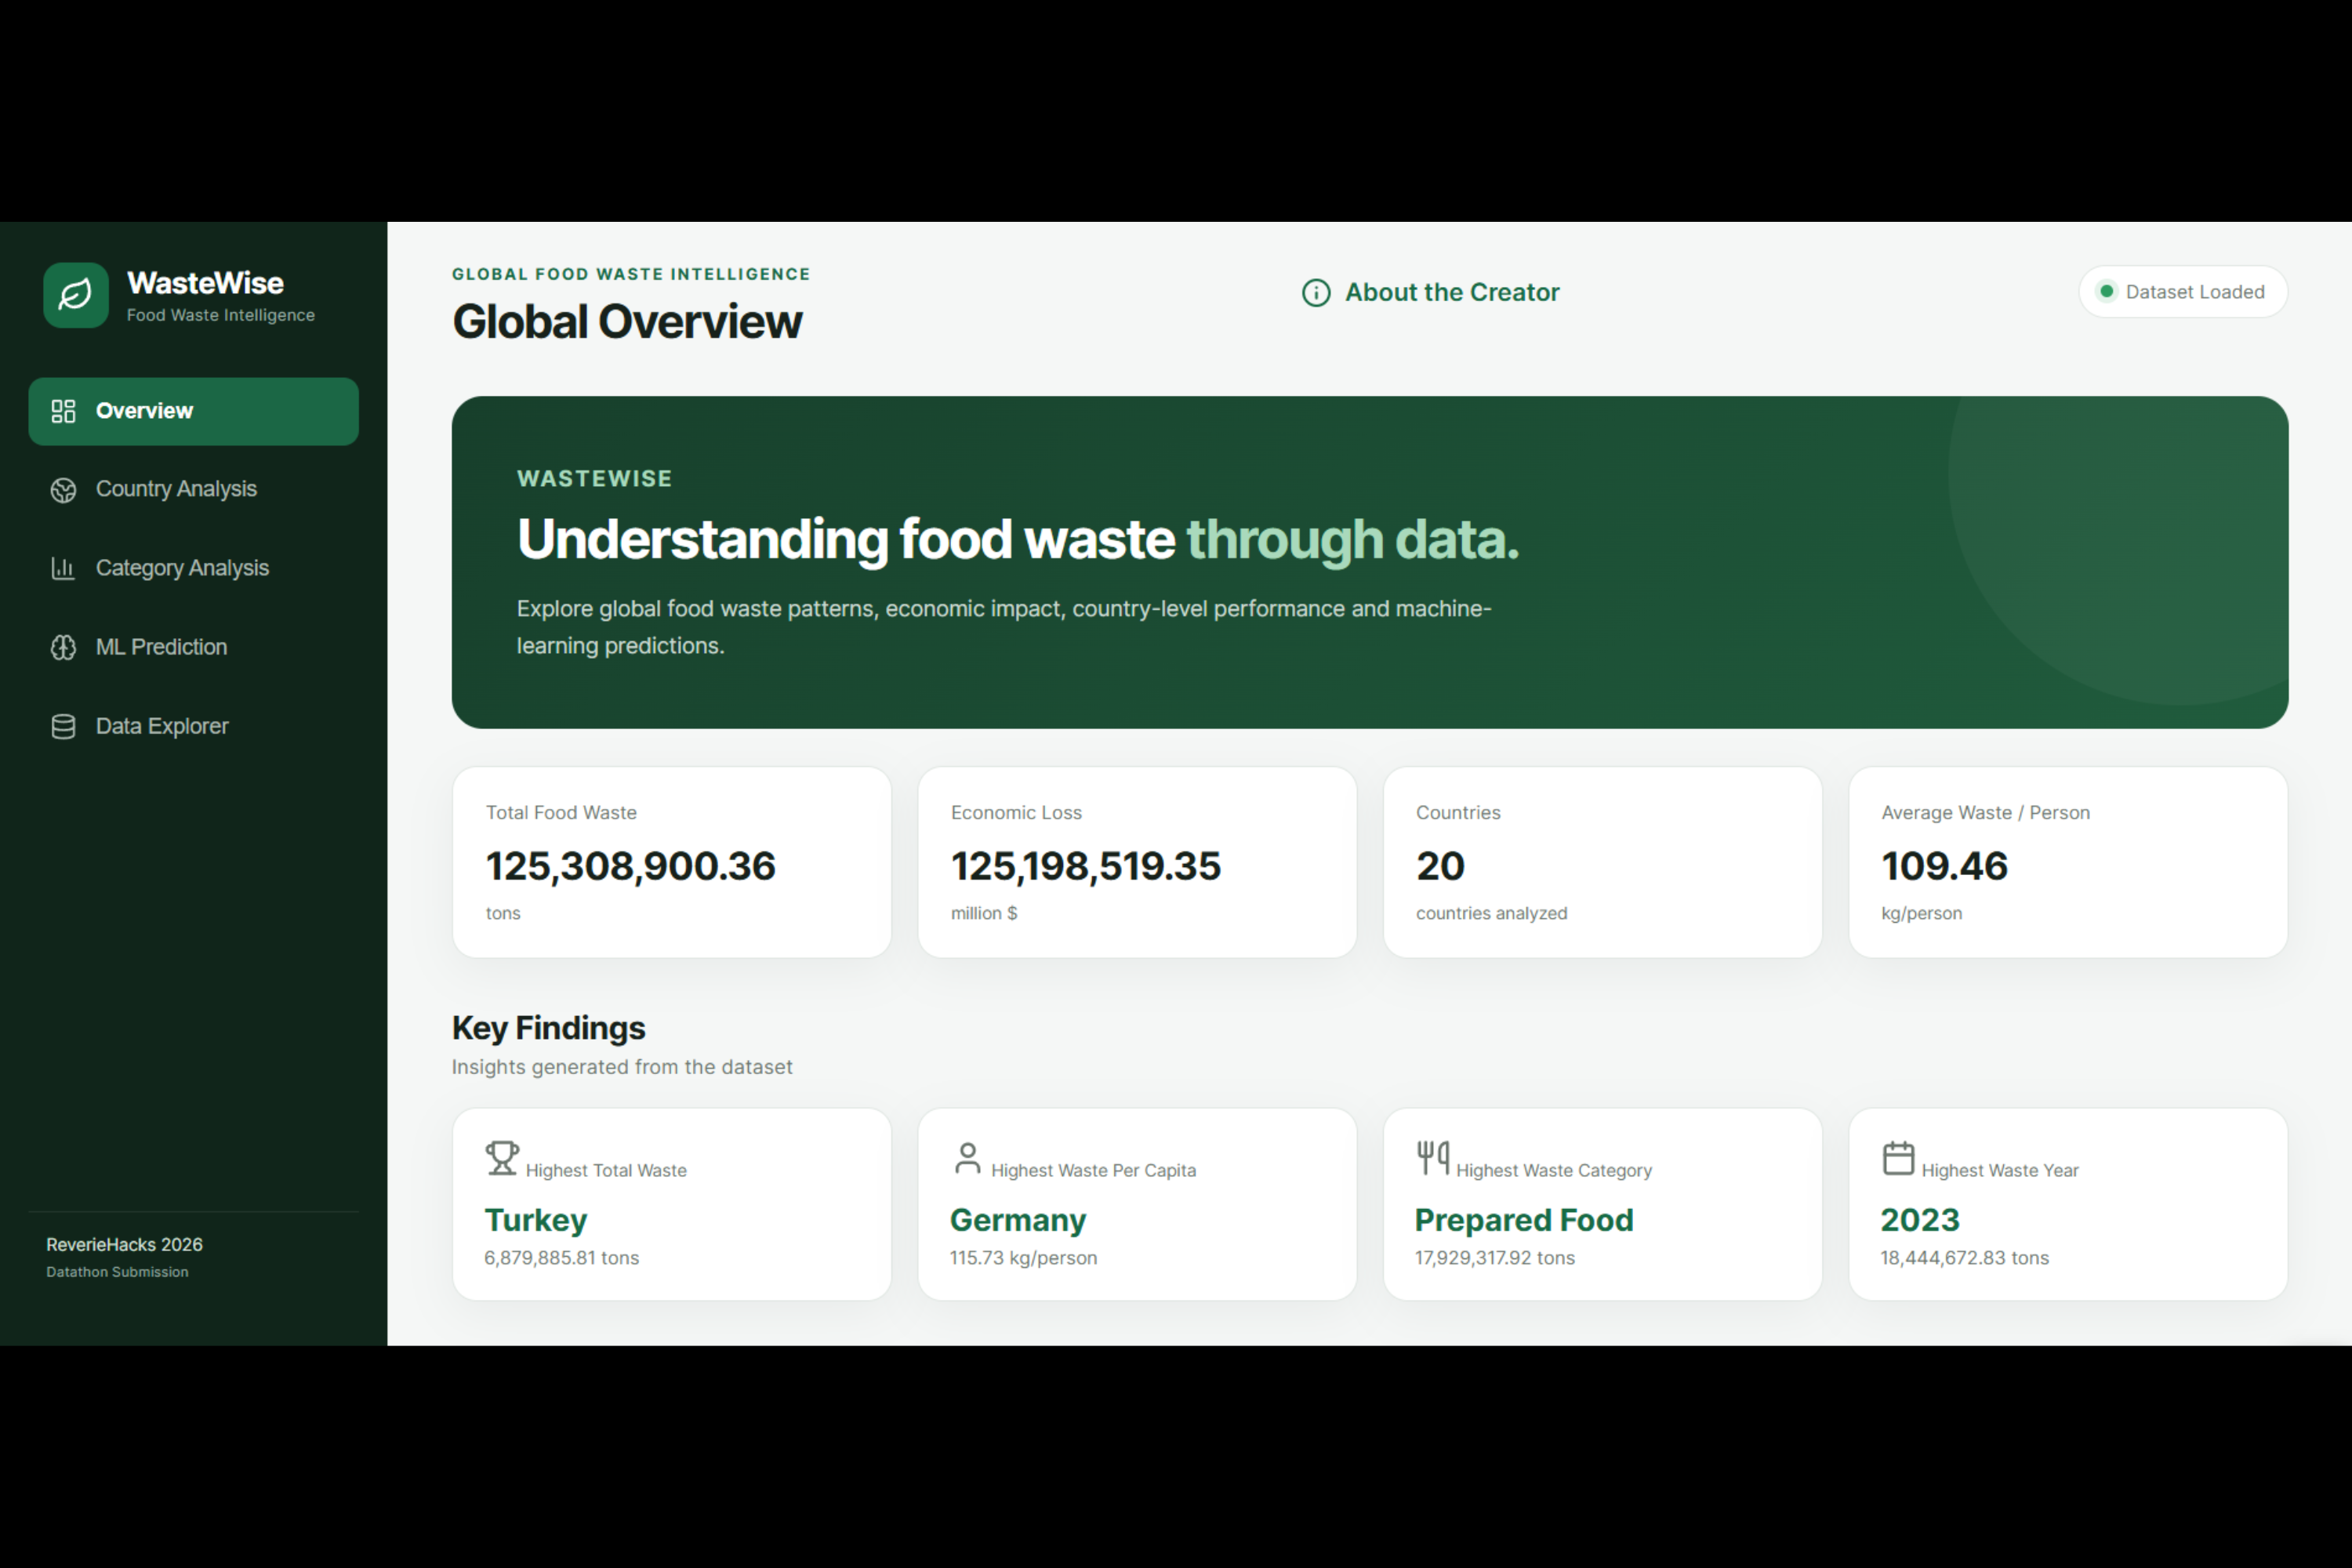
Explore the overall data and get a quick look at the key insights I found
-
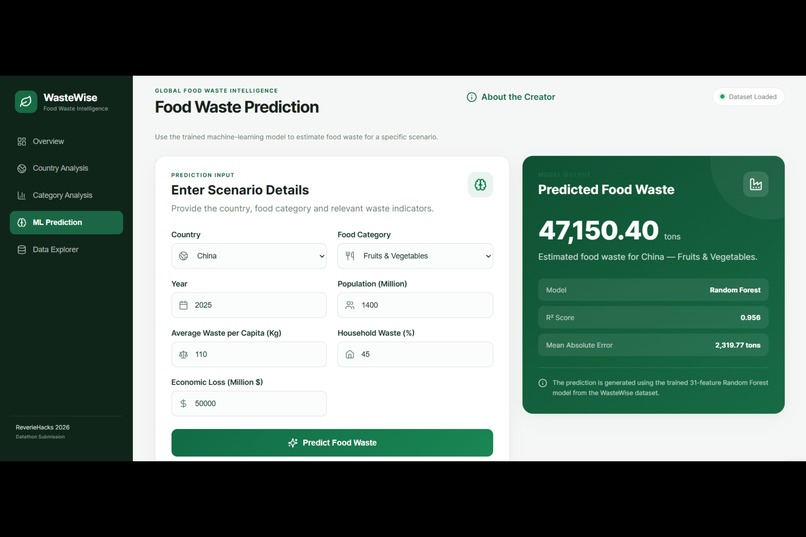
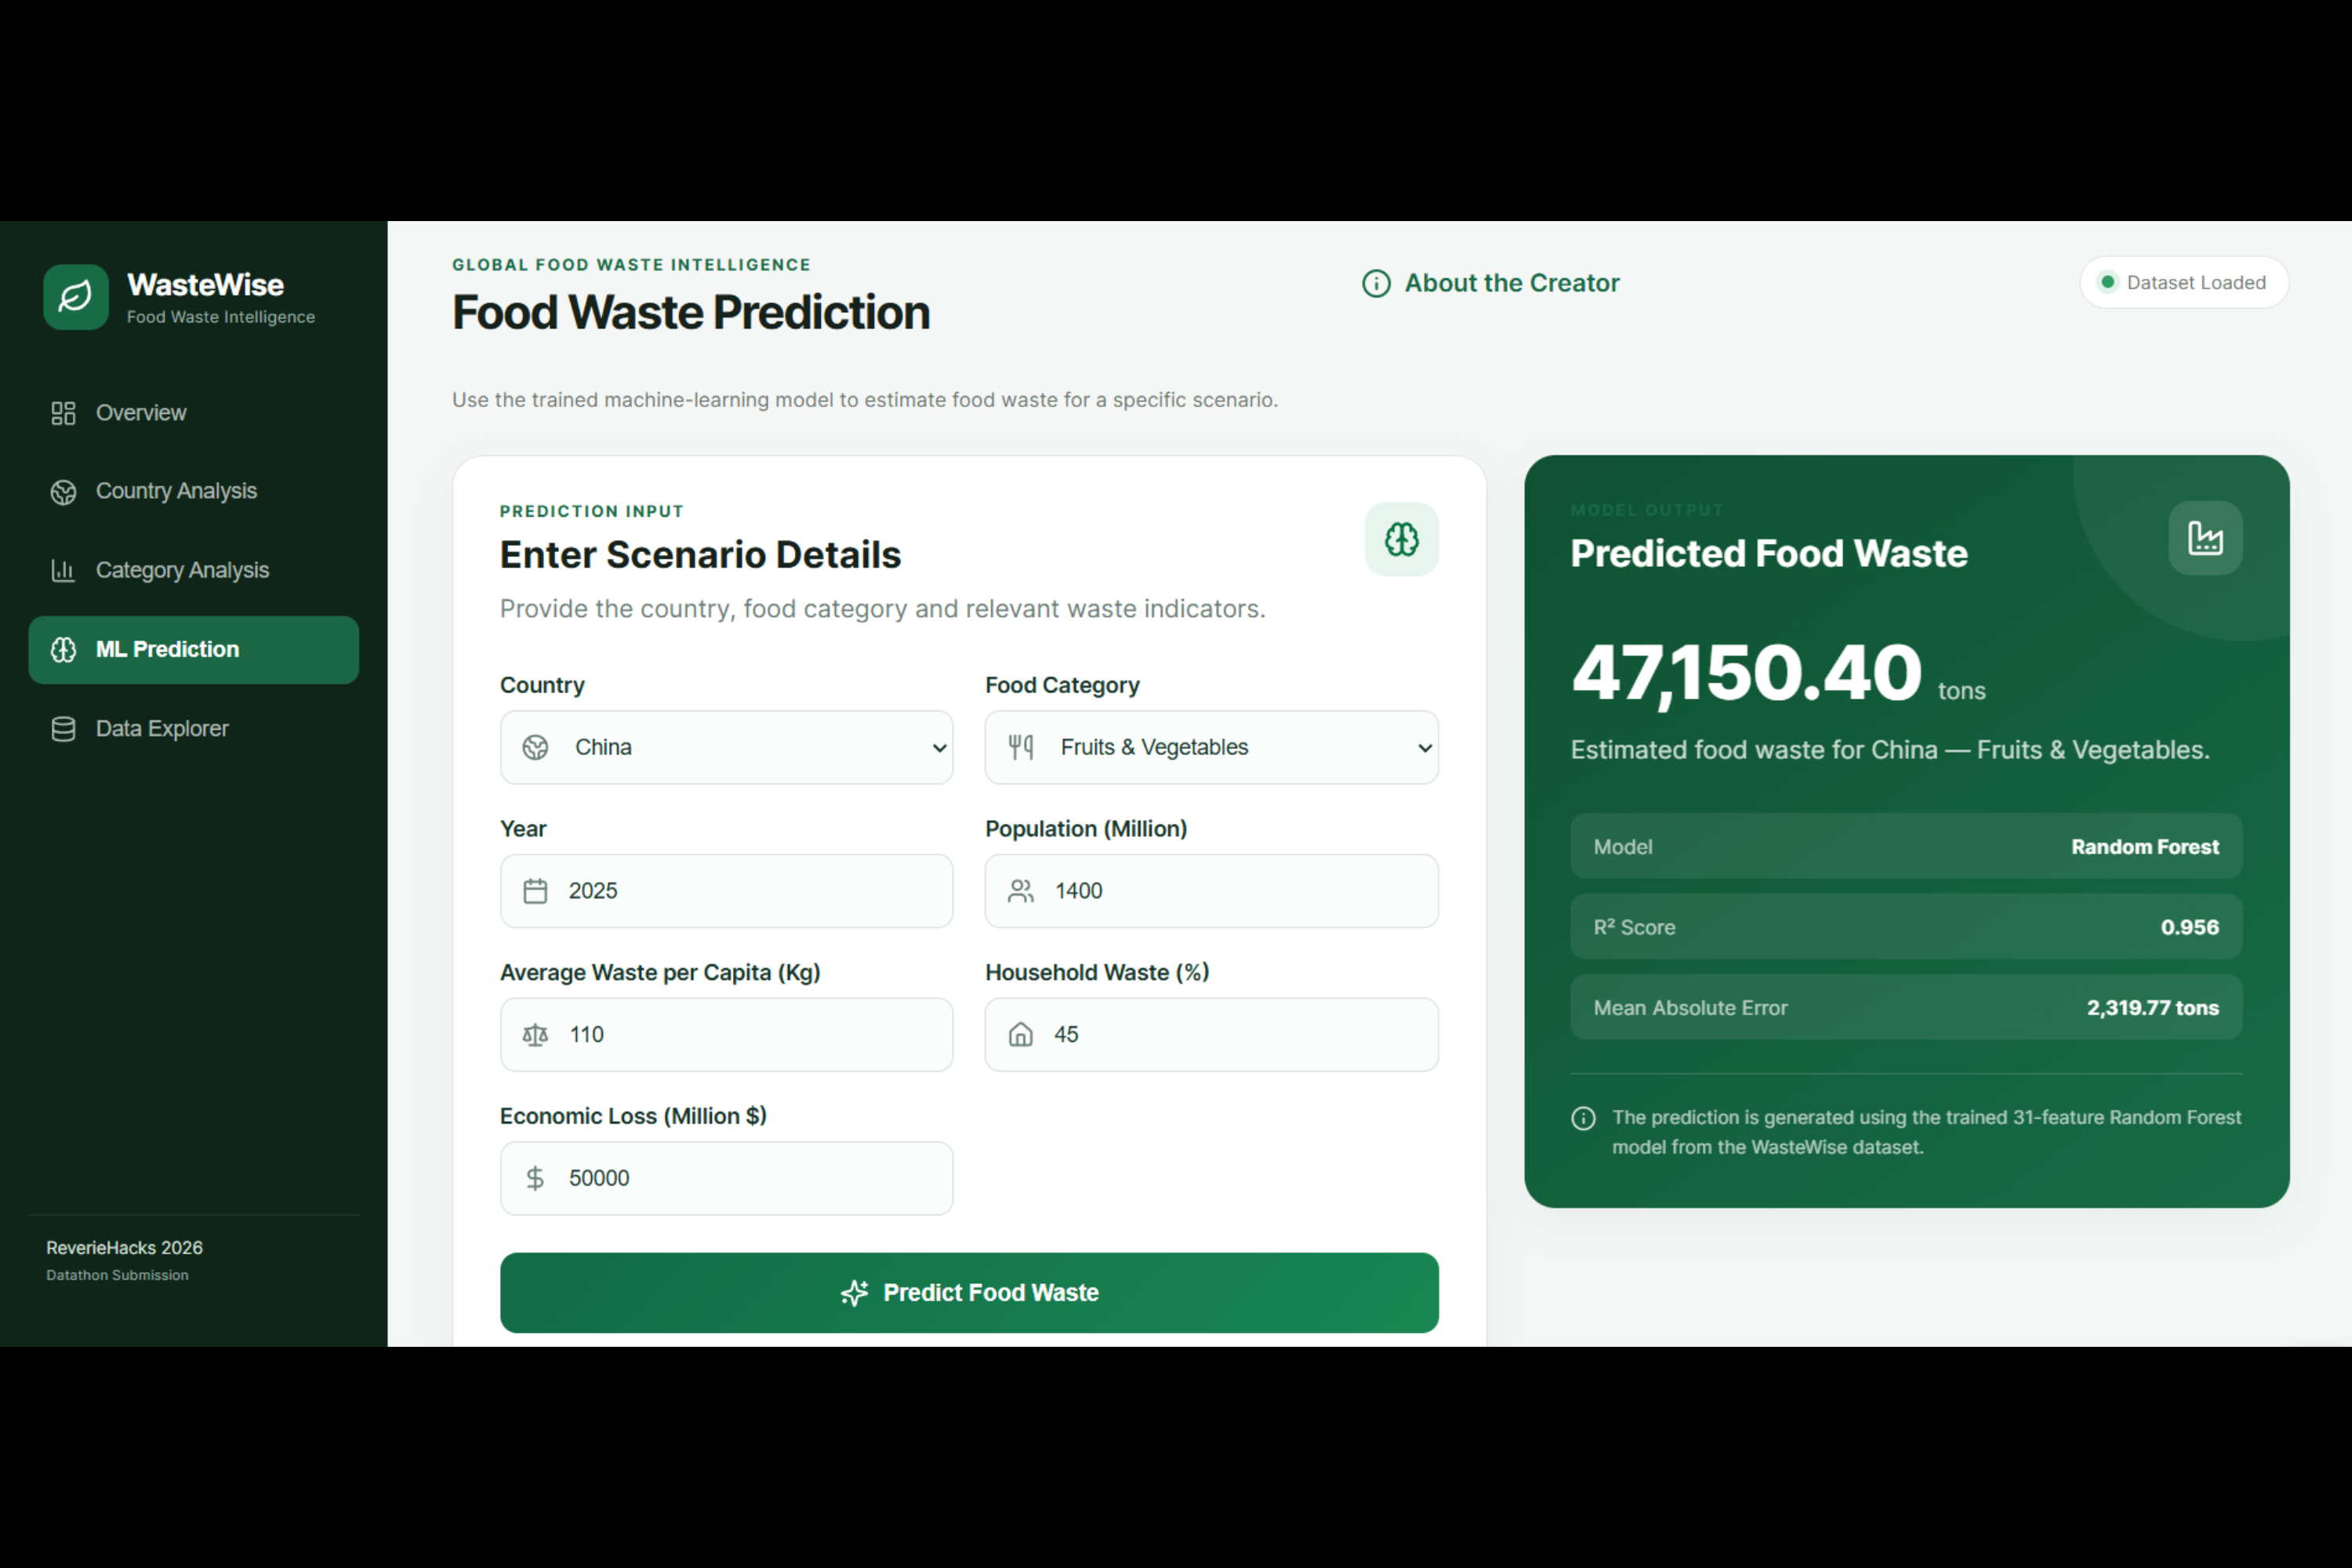
Build your own scenario using the available data and see what our ML model predicts
Inspiration
I chose to work on food waste because I wanted to understand how big the problem actually is. We hear about food being wasted all the time, but I felt that looking at real data could make the problem much easier to understand.
When I found this dataset, I started wondering how much food is being wasted, which countries and food categories contribute the most, and how the situation changes over time.
My goal with WasteWise was to turn that raw data into something people could actually explore and learn from. I believe that understanding the problem is an important first step toward finding better ways to reduce food waste.
How I Built It
I started by cleaning and exploring the food waste dataset using Python and Pandas. I analyzed the data across countries, years, and food categories and looked at patterns in total waste, waste per person, and economic loss.
I then built an interactive dashboard using HTML, CSS, and JavaScript. The dashboard includes country analysis, category analysis, a data explorer, and an overview of the main findings.
I also trained a Random Forest Regression model to predict total food waste using the information available in the dataset. The model achieved an R² score of 0.956 and an MAE of 2,319.77 tons on my test data.
To make the prediction model usable from the dashboard, I built a Flask API and connected it to the frontend. I then deployed the complete application online so that the dashboard and ML prediction can actually be used through a browser.
Challenges
The biggest challenge was getting all the different parts of the project to work together.
Cleaning and understanding the dataset was the first step, but turning the analysis into useful visualizations required deciding which insights were actually meaningful.
Connecting the trained ML model to the dashboard was another challenge. I had to make sure the data coming from the frontend matched the features expected by the model and then expose the prediction through a Flask API.
Finally, deploying the complete project was something I had to figure out as well. Getting the dashboard, dataset, Flask backend, and ML model working together online taught me a lot about how a data project becomes a real application.
What I Learned
This project taught me that building a data project is much more than creating charts or training a model. The quality of the insights depends heavily on understanding and preparing the data first.
I also learned how different parts of a project connect together — from data cleaning and analysis, to visualization, machine learning, APIs, and deployment.
Most importantly, I learned that data can make a large and complicated problem easier to see. With WasteWise, I wanted to take that first step: make food waste easier to understand so that the data can help people think about where improvements and solutions might be possible.
Built With
- css
- data-analysis
- data-visualization
- flask
- git-lfs
- github
- html
- javascript
- machine-learning
- pandas
- python
- random-forest
- render
- scikit-learn

Log in or sign up for Devpost to join the conversation.