Inspiration
Our inspiration stems from the critical need for cities to transition from reactive maintenance to proactive, data-driven sustainability. We always wanted to create something that will help others in a dynamic way. The inefficiency in city planning nowadays is terrible.
Water may be leaking for hours in roads pipe without anyone noticing until significant damage is done. These kinds of issues, wasted resources, delayed responses, and outdated infrastructure are exactly what we aim to tackle.
What it does (What is your prototype and how does it work?)
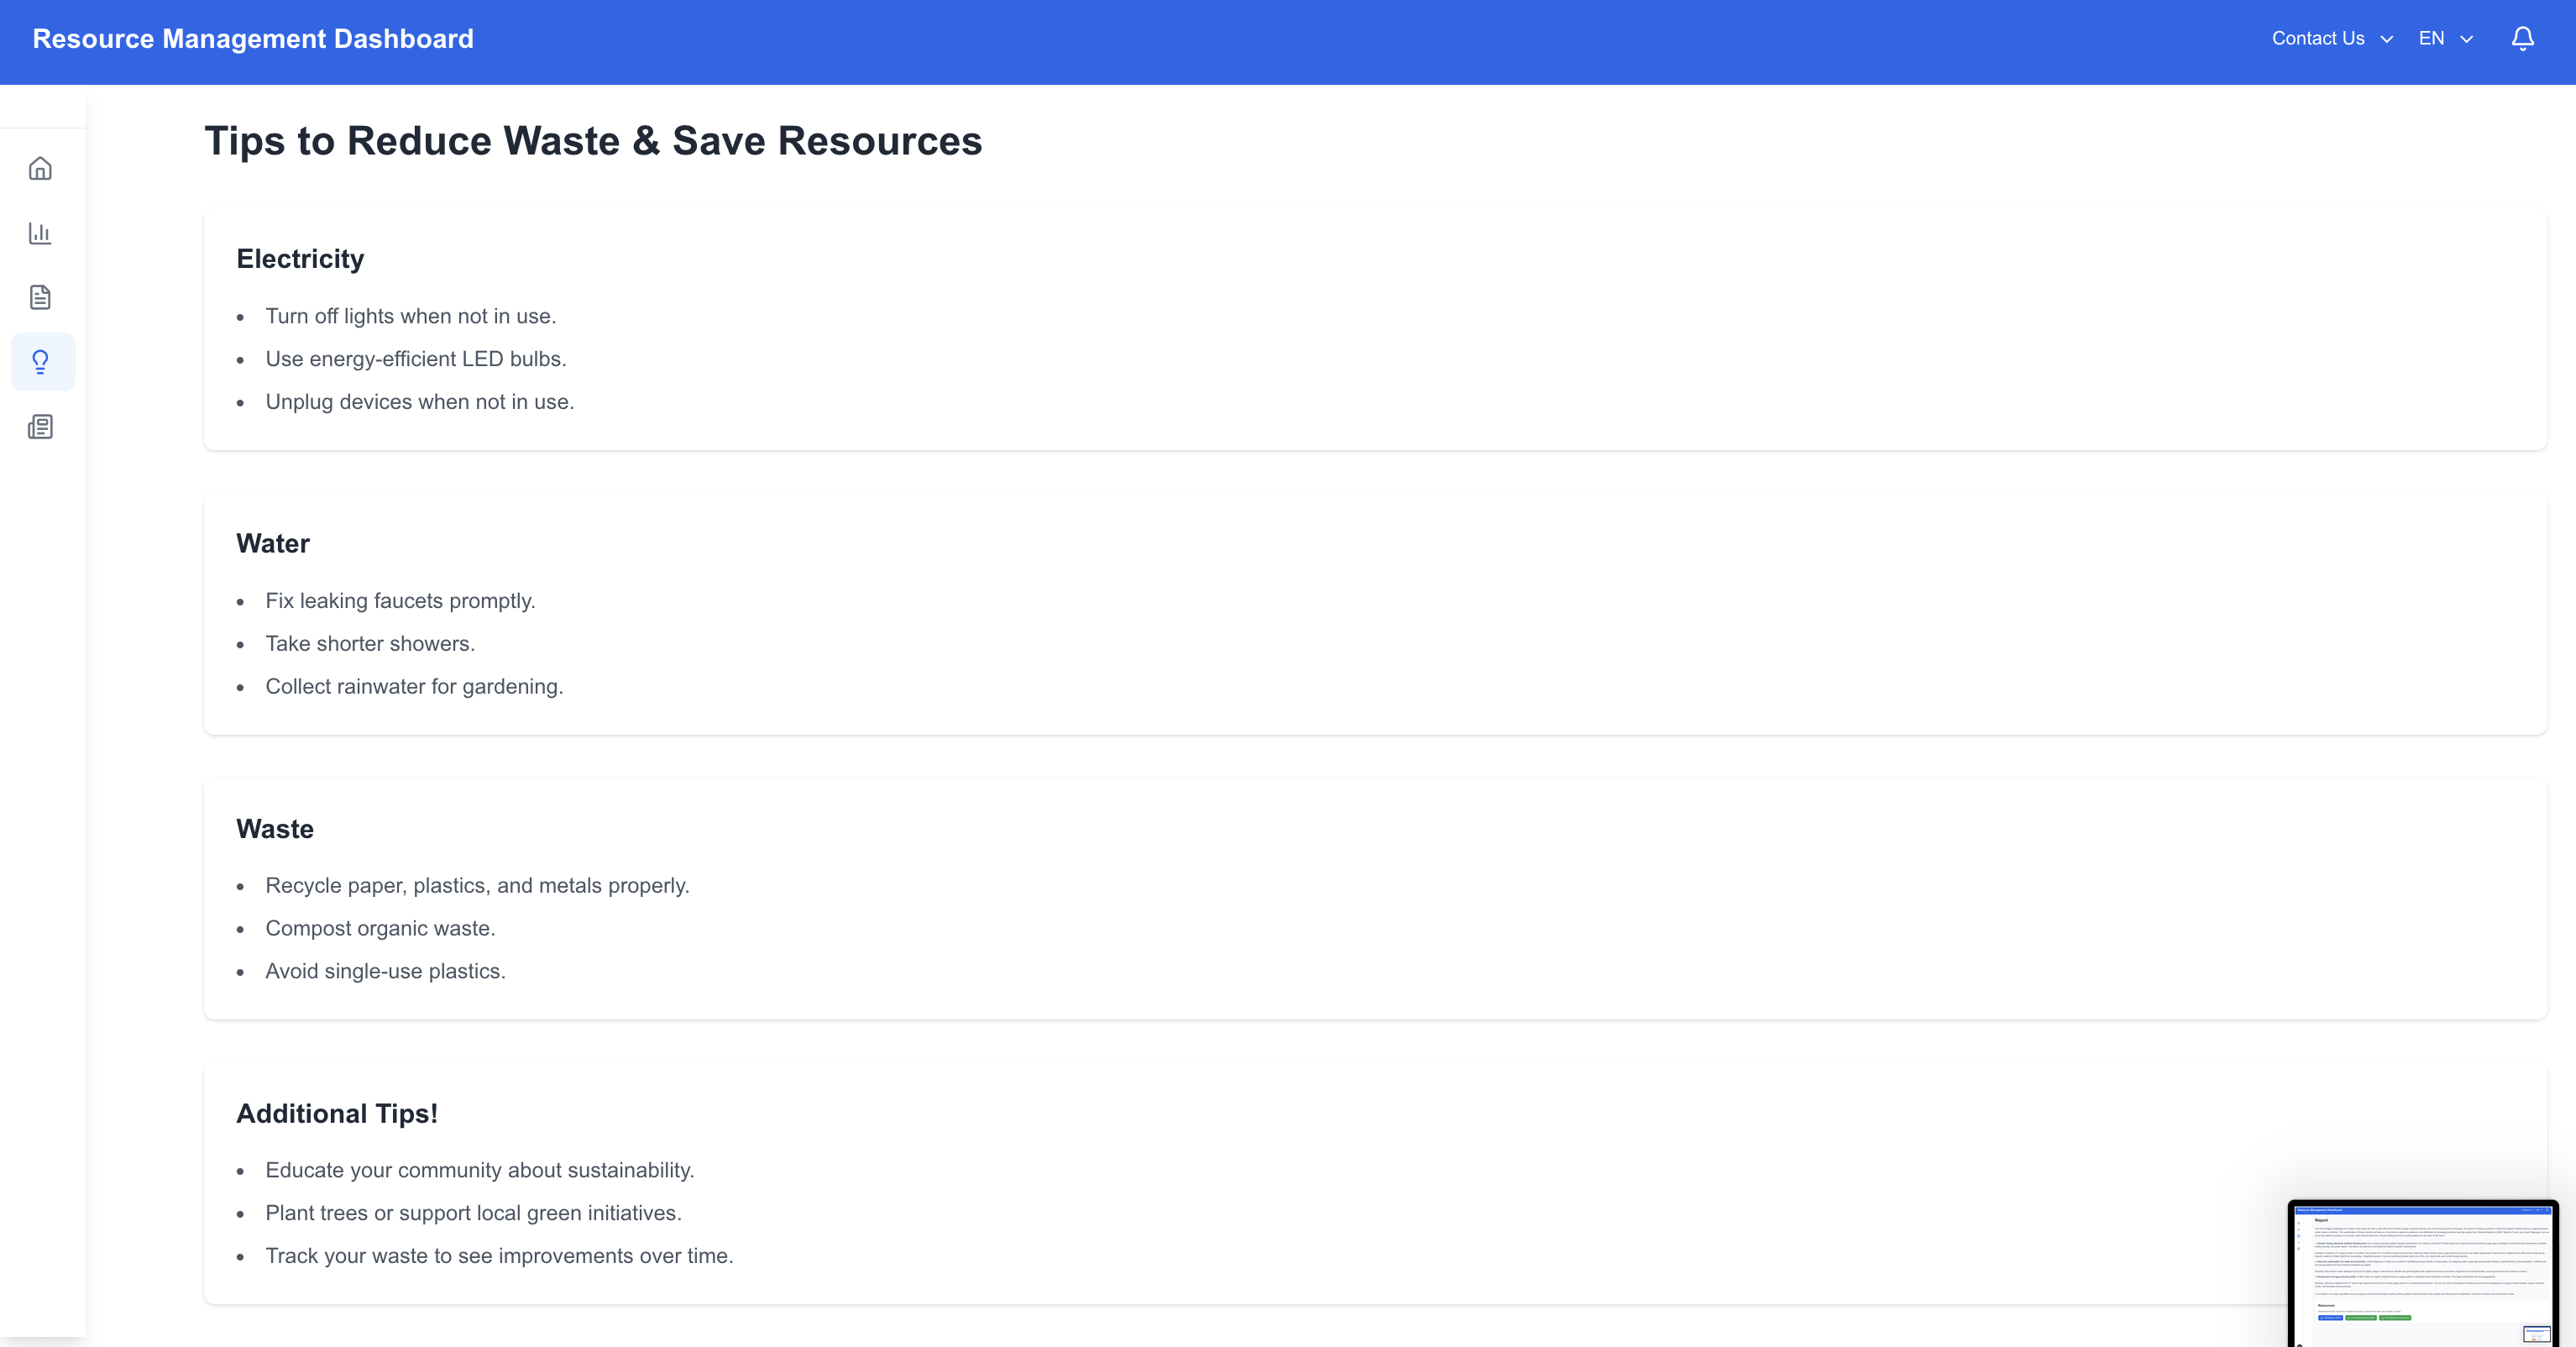
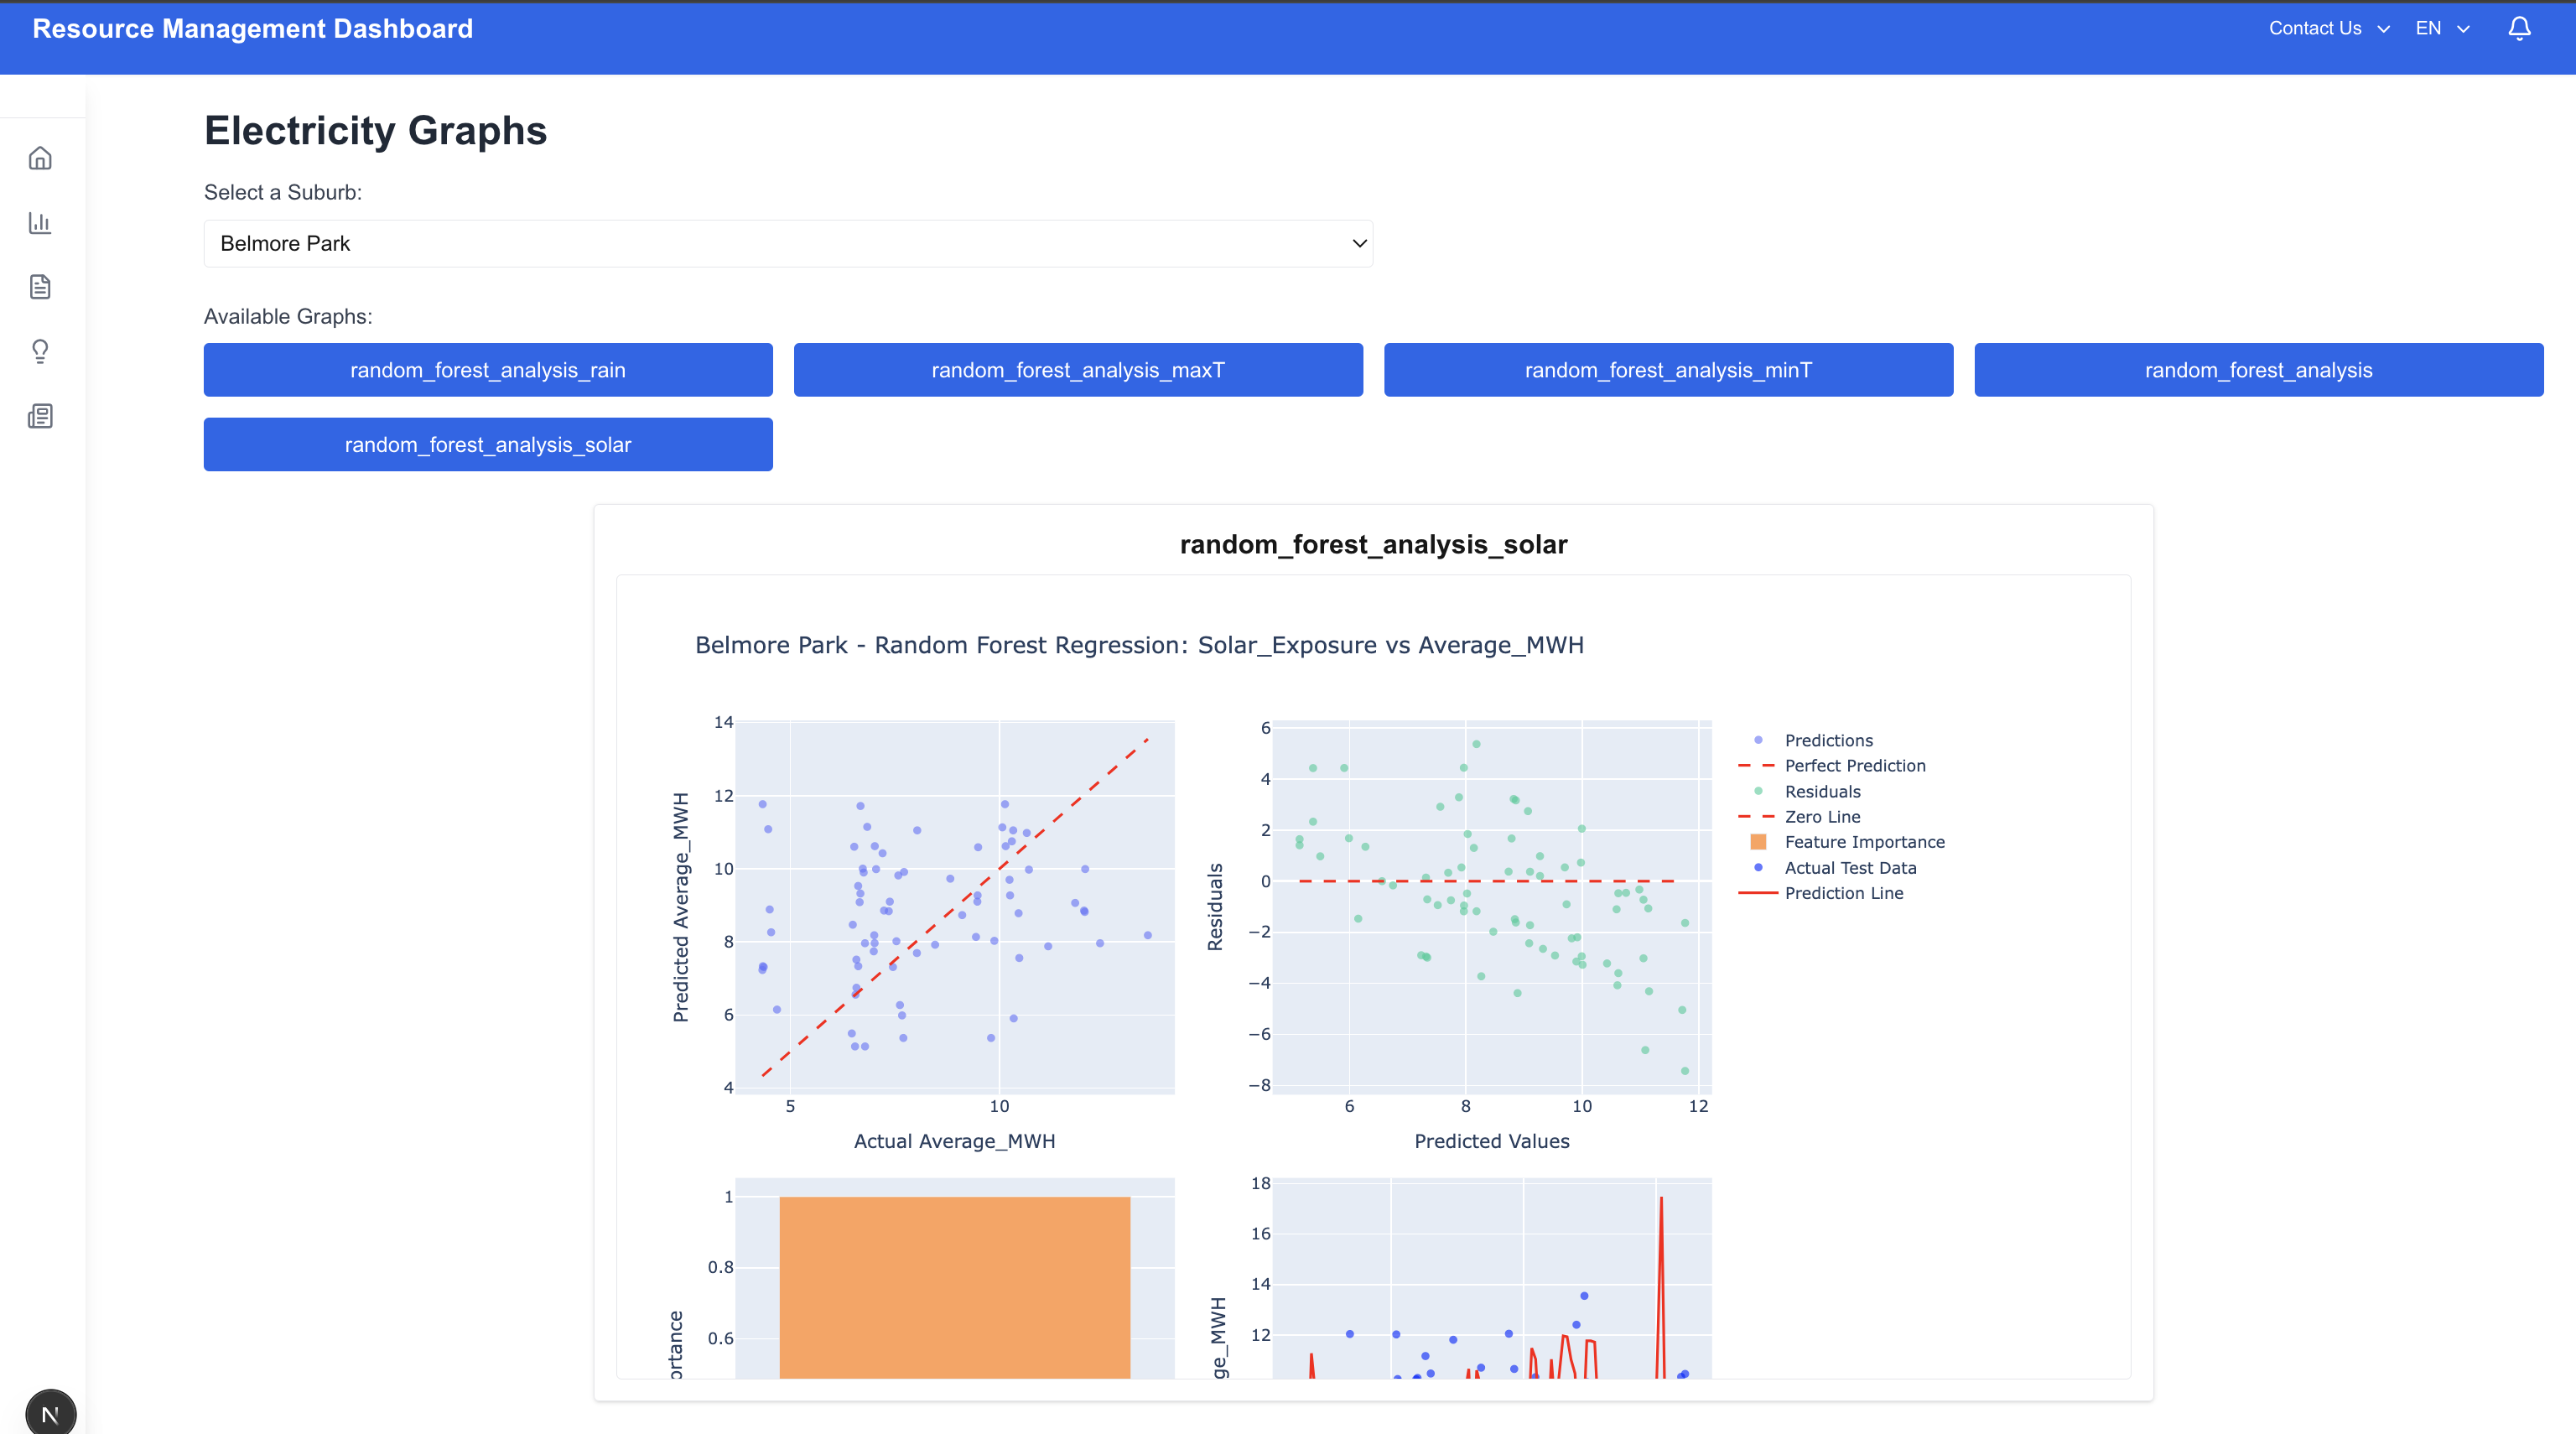
Our prototype is a predictive analytics dashboard that uses machine learning models to forecast urban resource usage based on key influencing factors like weather and time. It is designed to guide data-driven decisions for infrastructure optimization, future city planning, and efficient policy development.
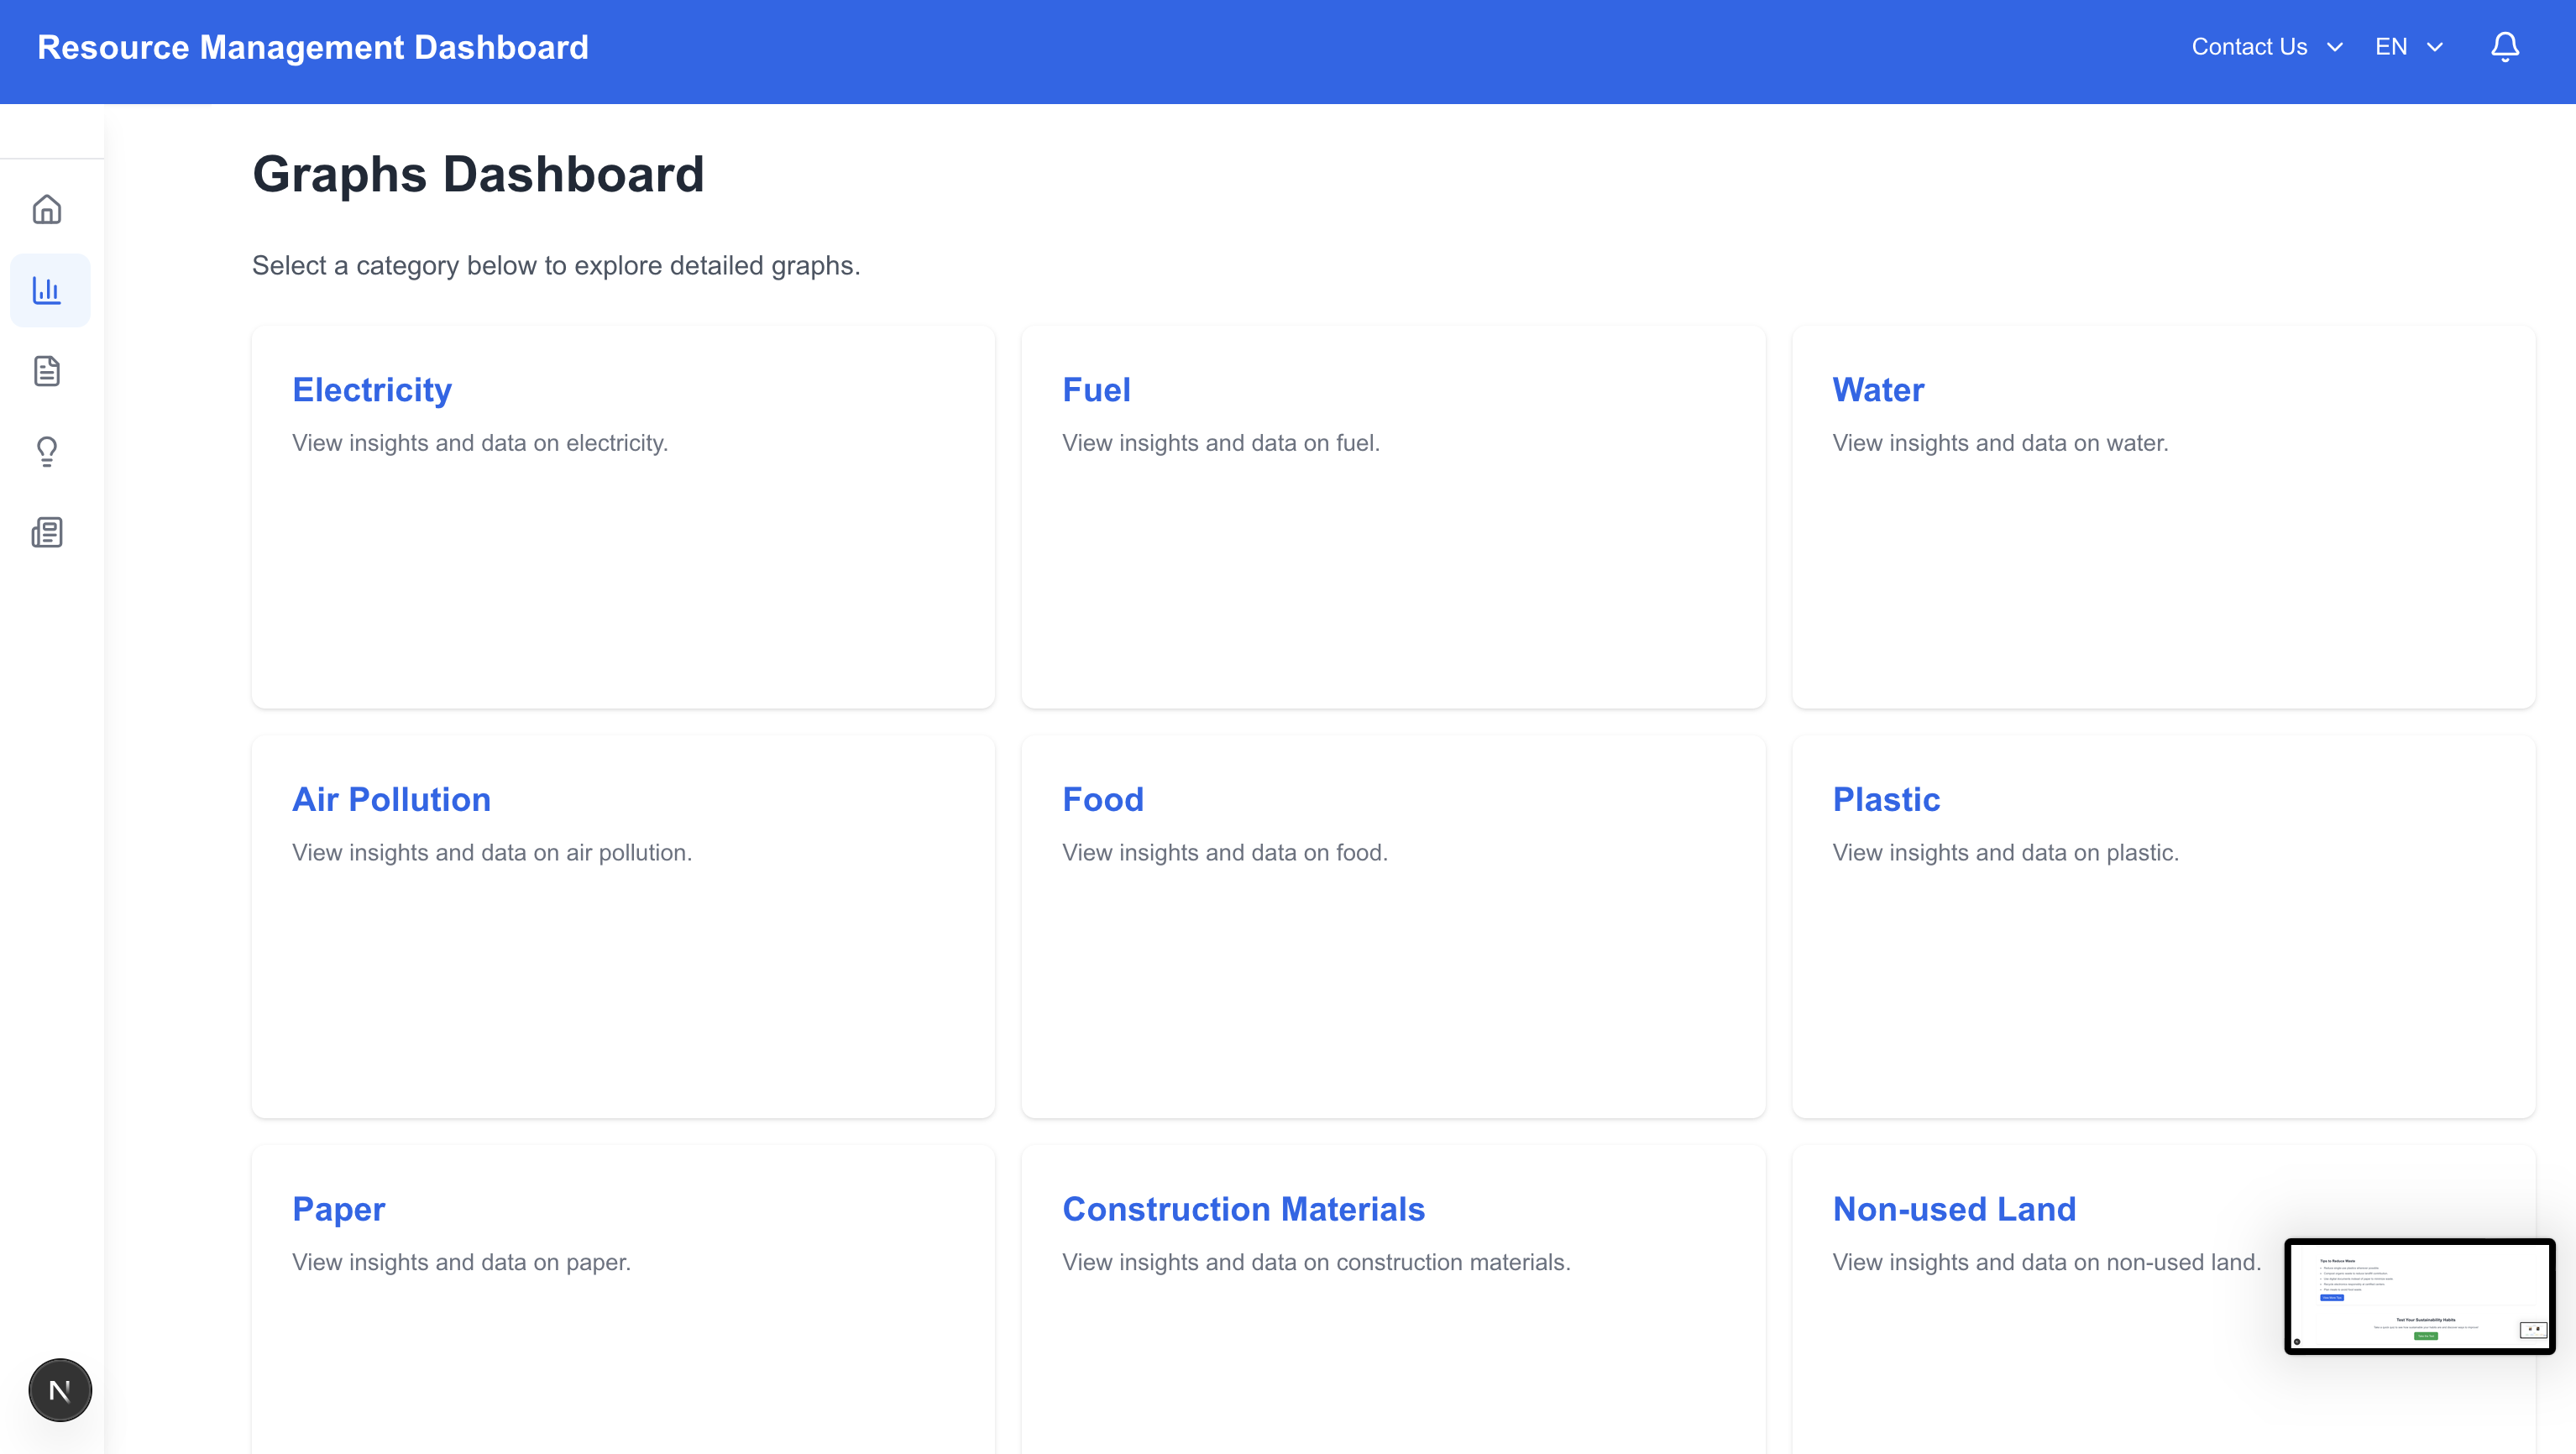
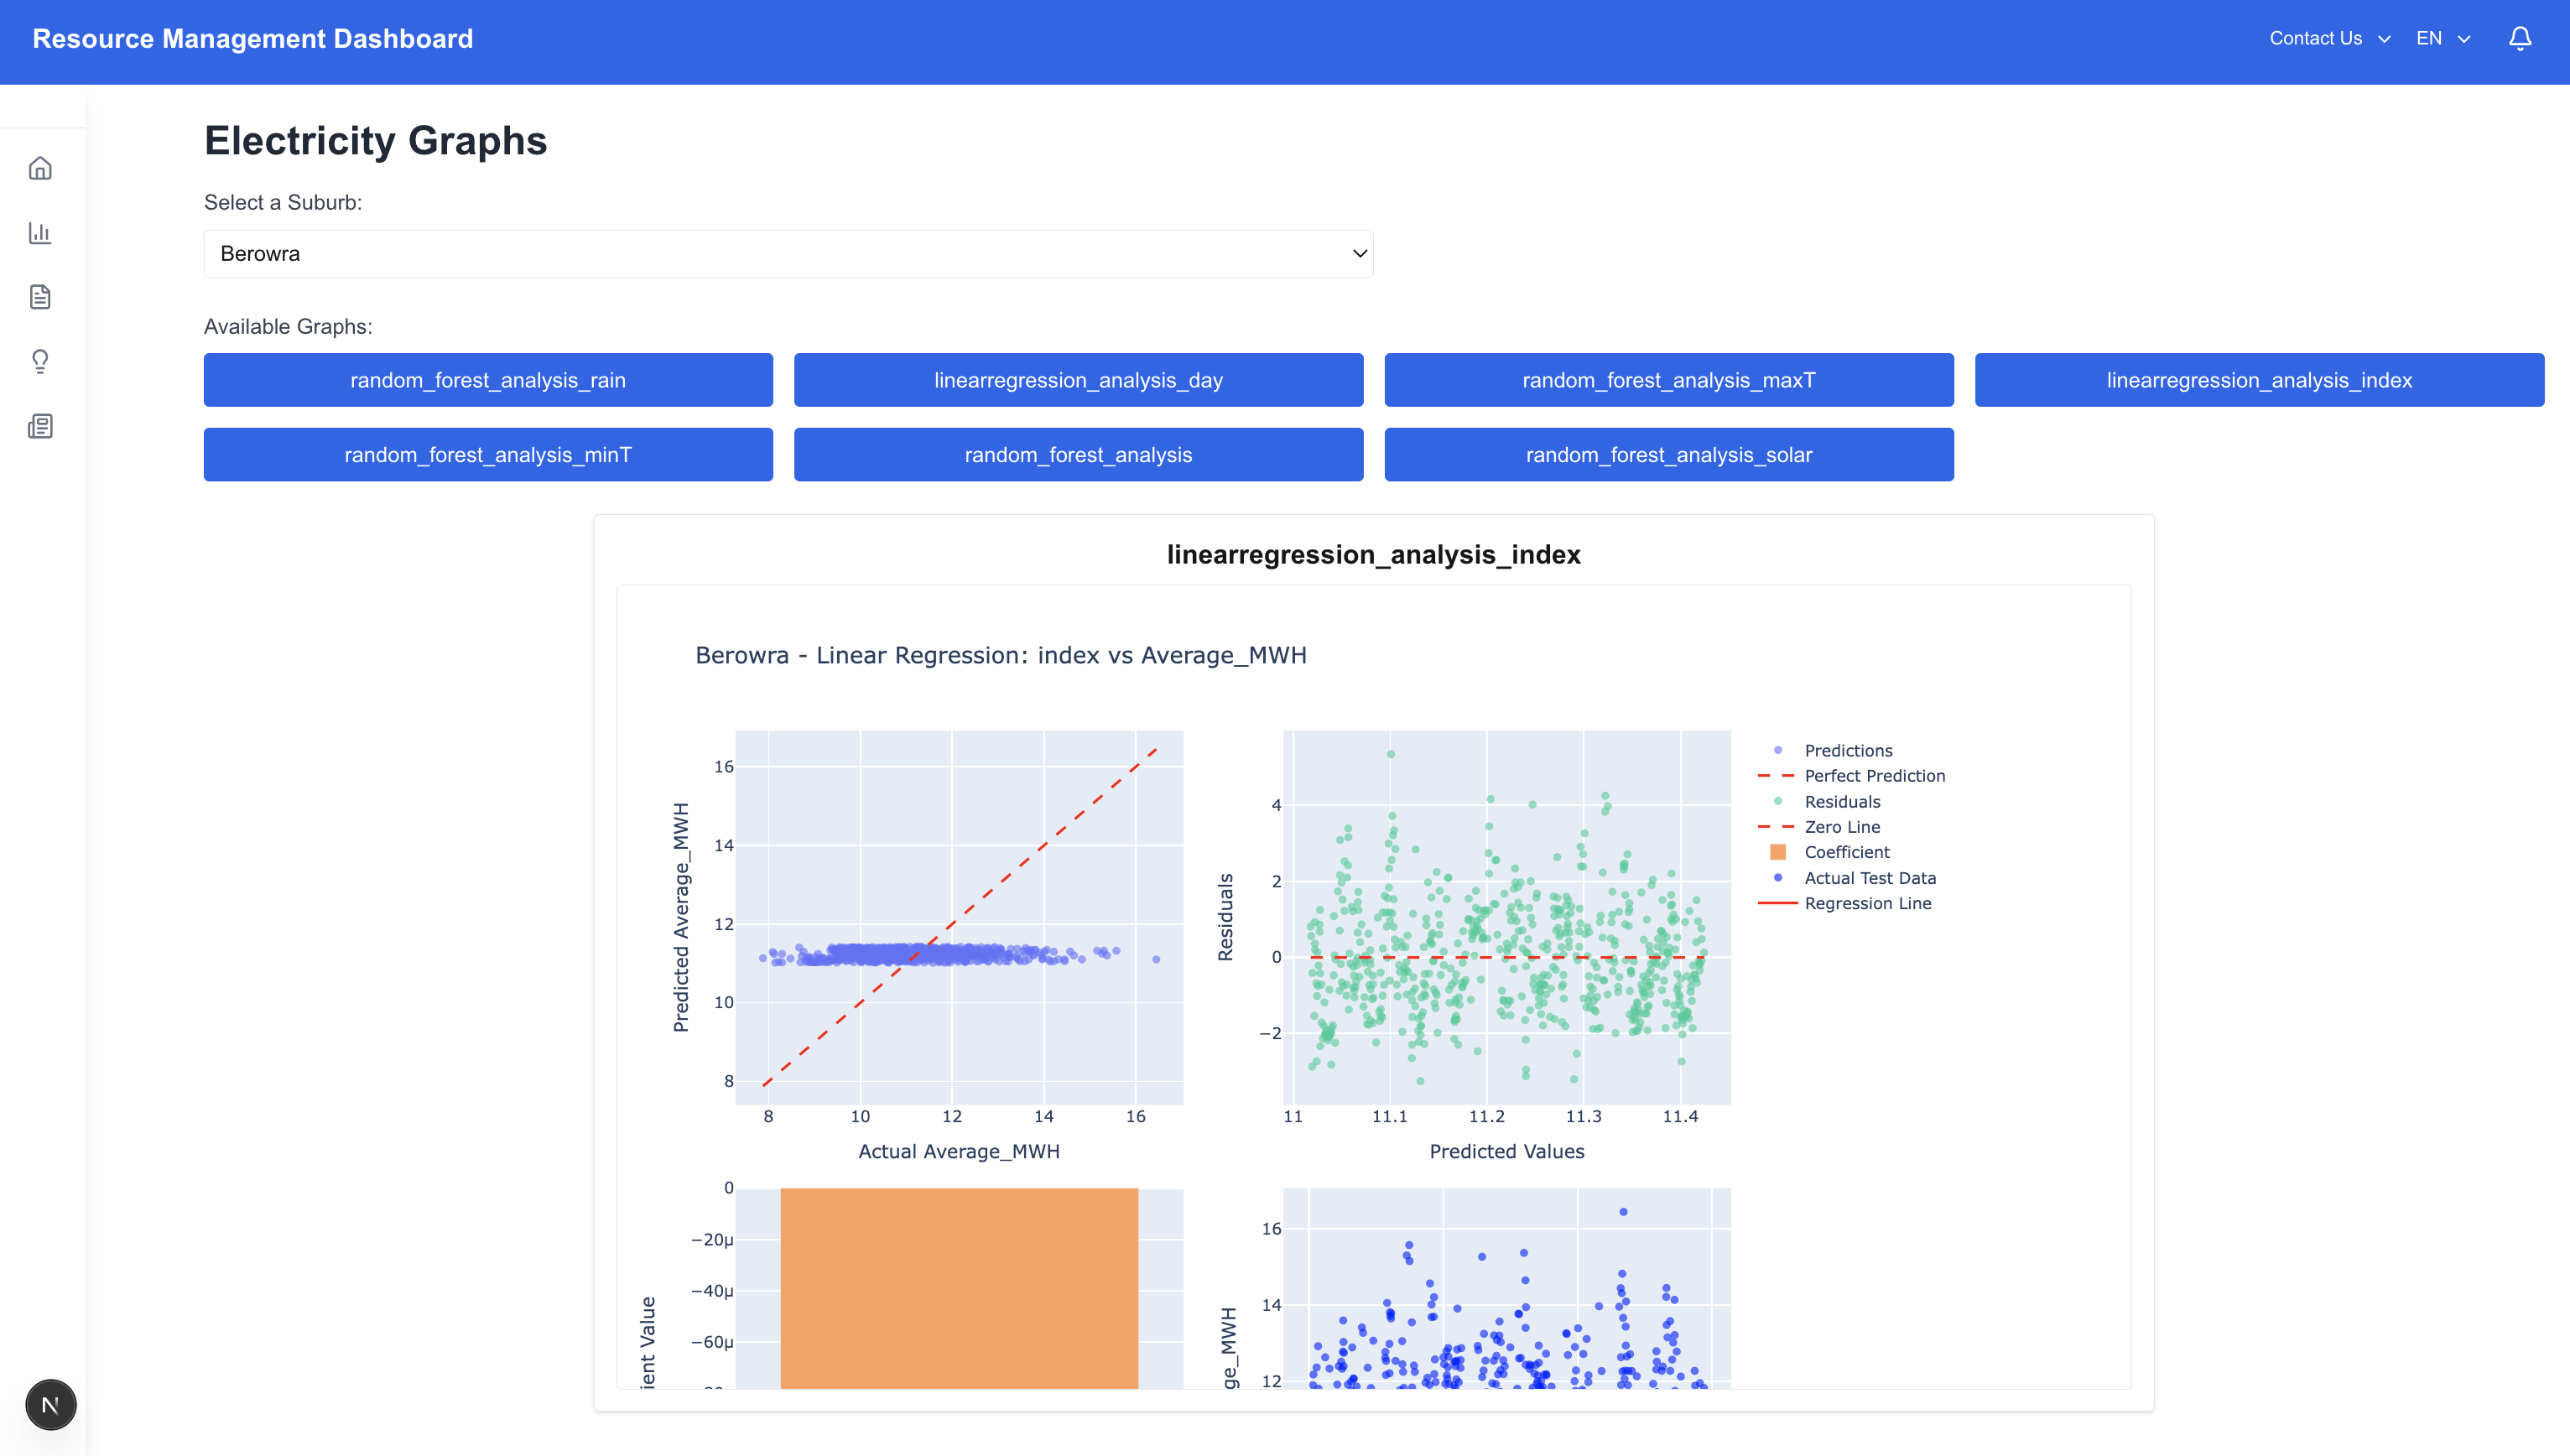
The current functional version analyzes real historical power consumption data for NSW, correlating it with weather conditions to generate forecasts. These predictions are visualized through an open-source webpage featuring interactive graphs. To demonstrate the platform's full potential, we have also built and connected models for water usage and pollution, currently running on simulated data.
This approach provides a transparent, accessible tool that allows planners to visualize future demand scenarios, optimize resource deployment, and make informed strategic decisions to enhance sustainability and operational efficiency.
What problem are you trying to solve
Cities operate on outdated, reactive models for managing critical resources like water and electricity. This leads to massive inefficiency: undetected leaks waste millions of gallons, energy grids are strained by unpredictable demand, and infrastructure planning is slow and manual. We are solving this inability to proactively predict and prevent resource waste, which drains municipal budgets and hampers sustainability efforts.
Who would use it
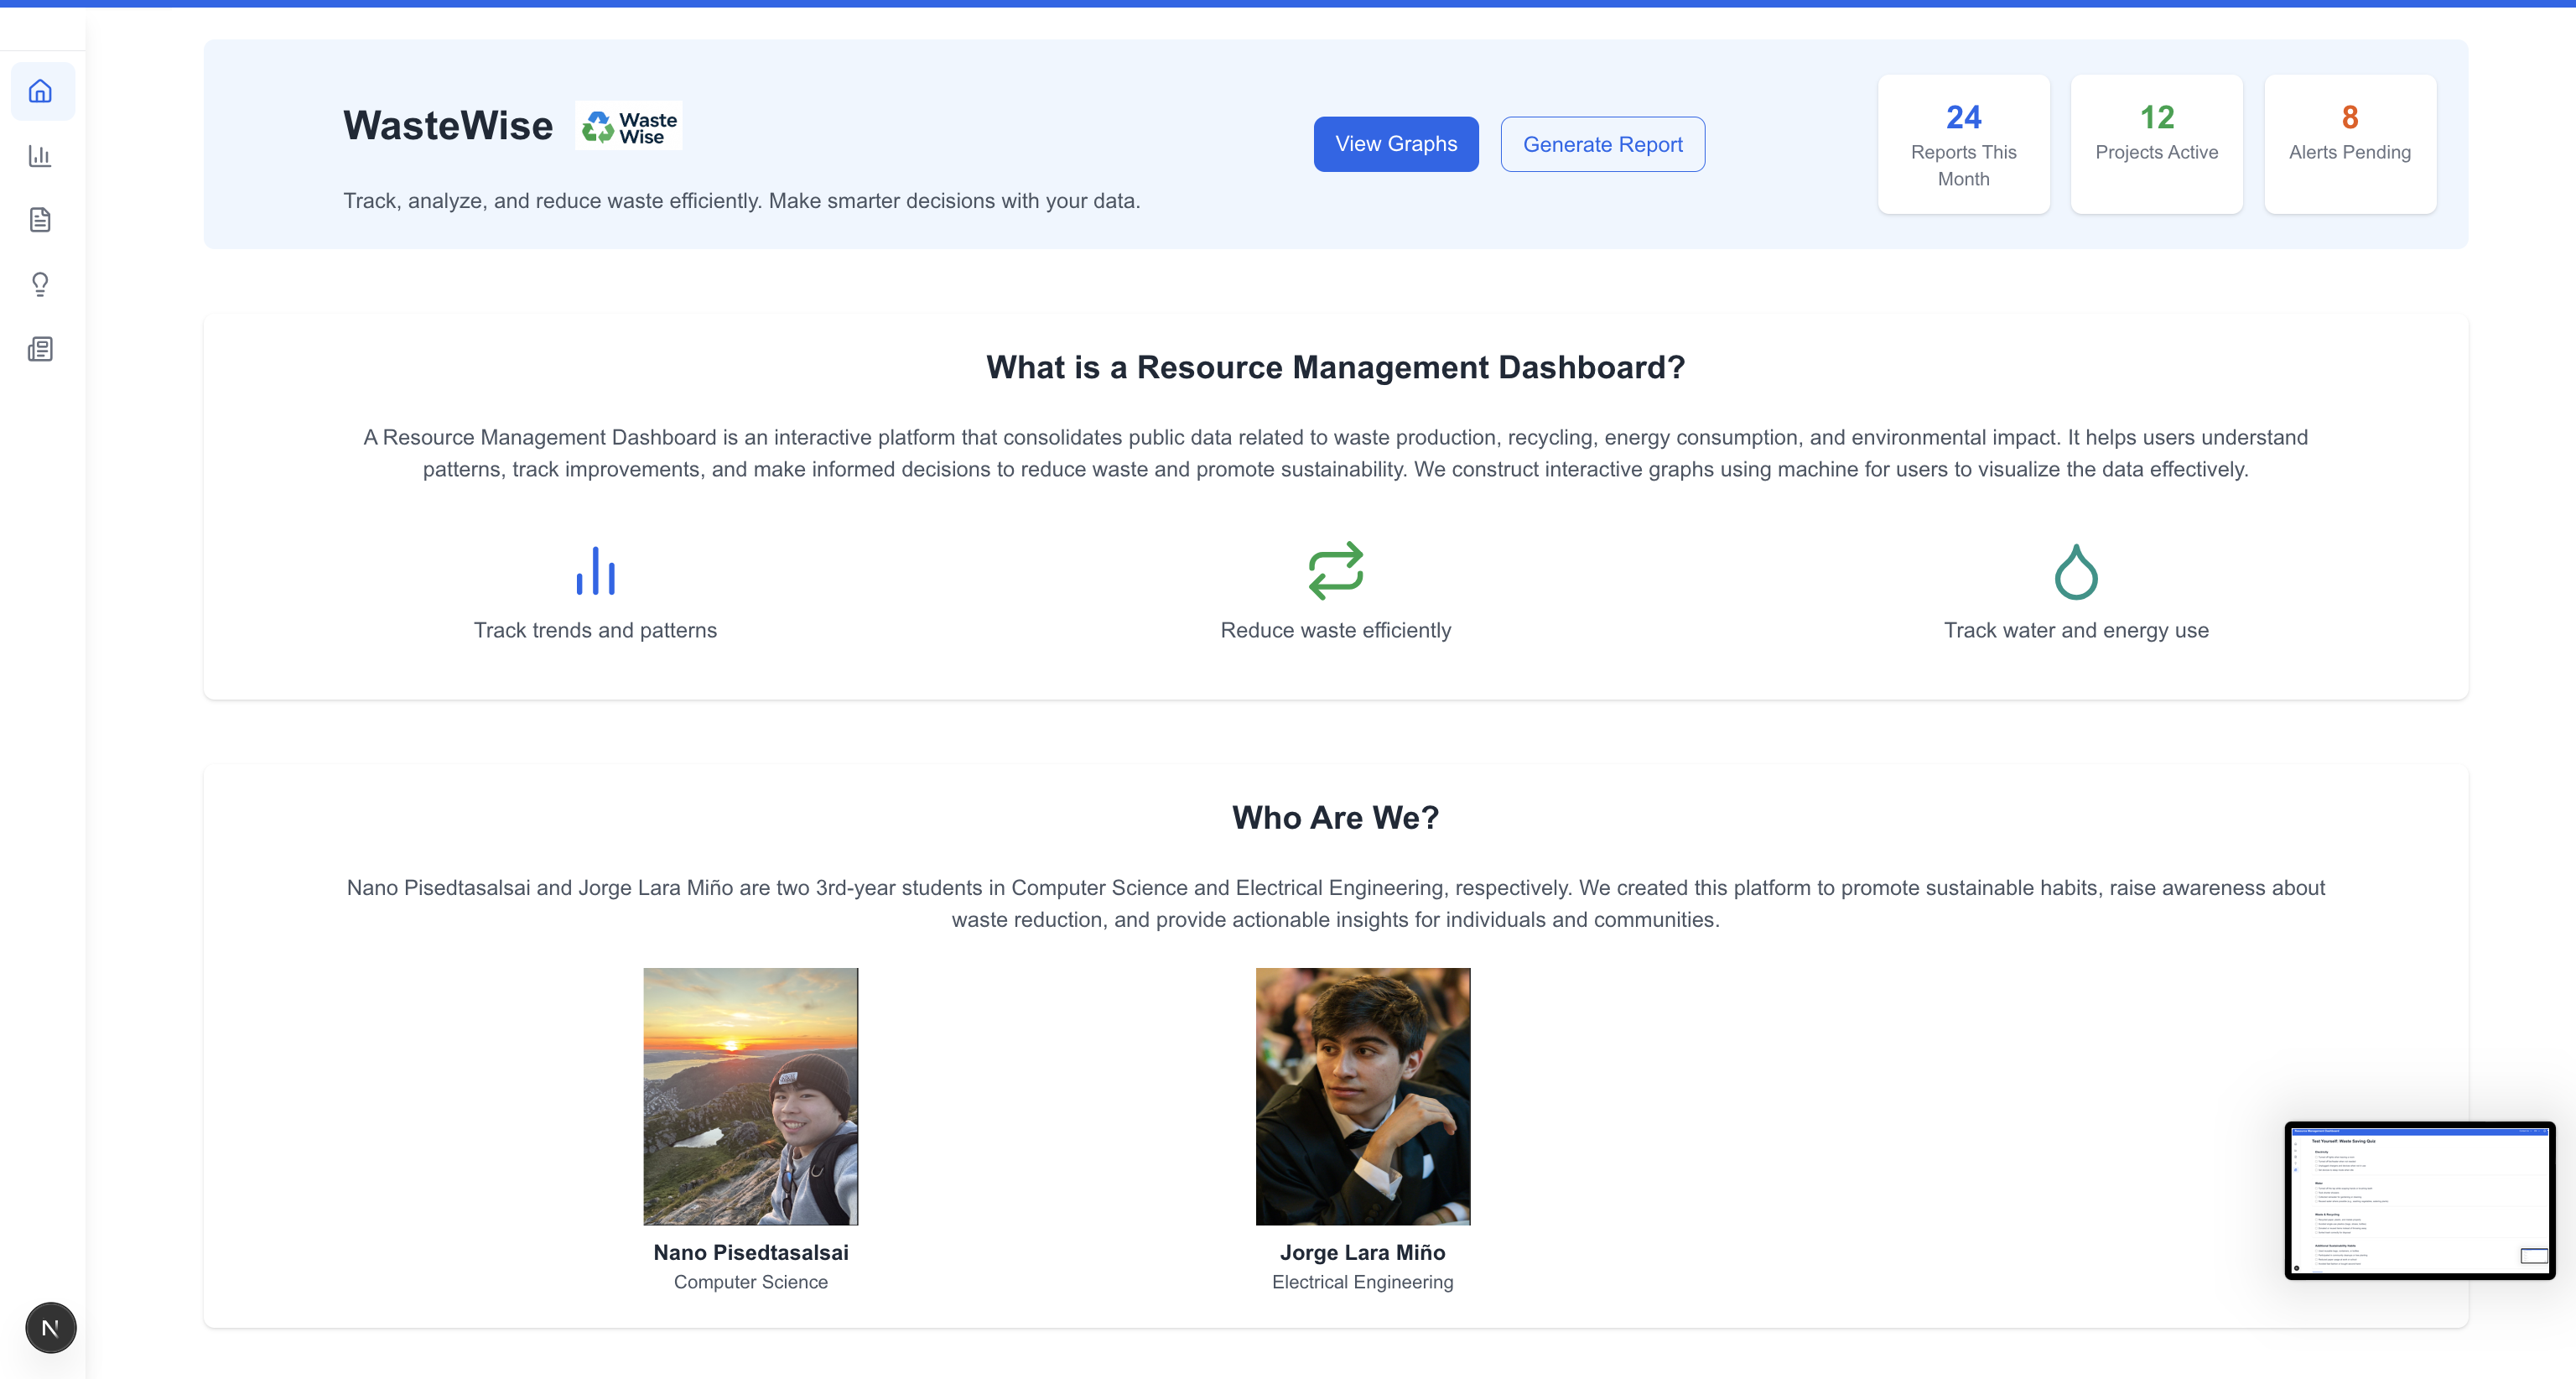
Our primary users are city planners and municipal operations managers who need to optimize infrastructure and prevent waste. It also serves utility companies for demand forecasting and corporate sustainability officers seeking to reduce energy costs and environmental impact across their facilities and remote work policies.
How we built it
This project consists of two main components: data processing with AI modeling, and a full-stack application for serving and visualizing results. First, an ETL pipeline was developed to download public datasets, including government datasets, and store them locally in CSV and Excel formats. Using Python with scikit-learn and pandas, an AI model was trained and tested across multiple years of data to generate insights and predictions. For the backend, FastAPI was used to build a REST API, with CORS middleware enabling secure communication with the frontend. The backend also automated the handling of HTML files to ensure the frontend could fetch and display data correctly. On the frontend, React and Next.js were used to create an interactive interface that seamlessly integrates with the FastAPI backend via REST API calls. The interface includes components such as a sidebar, navigation bar, and dynamic graphs, as well as pages that display AI model outputs, visual reports, and graph summaries. Styling was implemented using Tailwind CSS for responsiveness and consistency, while icons were integrated using the Lucide icon library.
Challenges we ran into
Time management was a big issue. We became hyper-focused on perfecting the electricity prediction model's accuracy, which consumed time meant for integrating other data sources and enhancing the website's features
Secondly, data acquisition was a significant hurdle. While we found excellent historical data for weather and power consumption, sourcing large, reliable, and public datasets for other resources like real-time water flow or detailed waste management was difficult and time-consuming, limiting the scope of our initial launch.
Finally we had to deal with a git problem were we deleted half of the documentation of the webpage at 4am :( .
Accomplishments that we're proud of
We are incredibly proud of transforming a complex idea into a working, end-to-end prototype within a constrained timeframe. Successfully integrating a machine learning backend with a functional and intuitive frontend dashboard was a major achievement. We created a foundation that not only works but also clearly demonstrates its potential value to users through interactive visualizations, proving our concept is viable.
What we learned
Technically, we advanced our skills in applied machine learning, learning to implement and fine-tune various Scikit-learn models and understand their practical trade-offs. We gained hands-on experience in full-stack development, connecting a Python backend to a web frontend and managing data flow between them.
What's next for WasteWise - Resource Management Dashboard
We are planning to finish all the predictive models by realizing better calculations considering the machine learning parameters. After that we would love to integrate real-time IoT sensor data for instant leak alerts and hyper-accurate predictions. We could expand into waste and traffic management, creating a holistic city dashboard. Finally we were thinking about developing an automated alert system that directly notifies maintenance crews of predicted anomalies, drastically reducing response times and preventing resource waste.
Report (This section is also in our fullstack web platform)
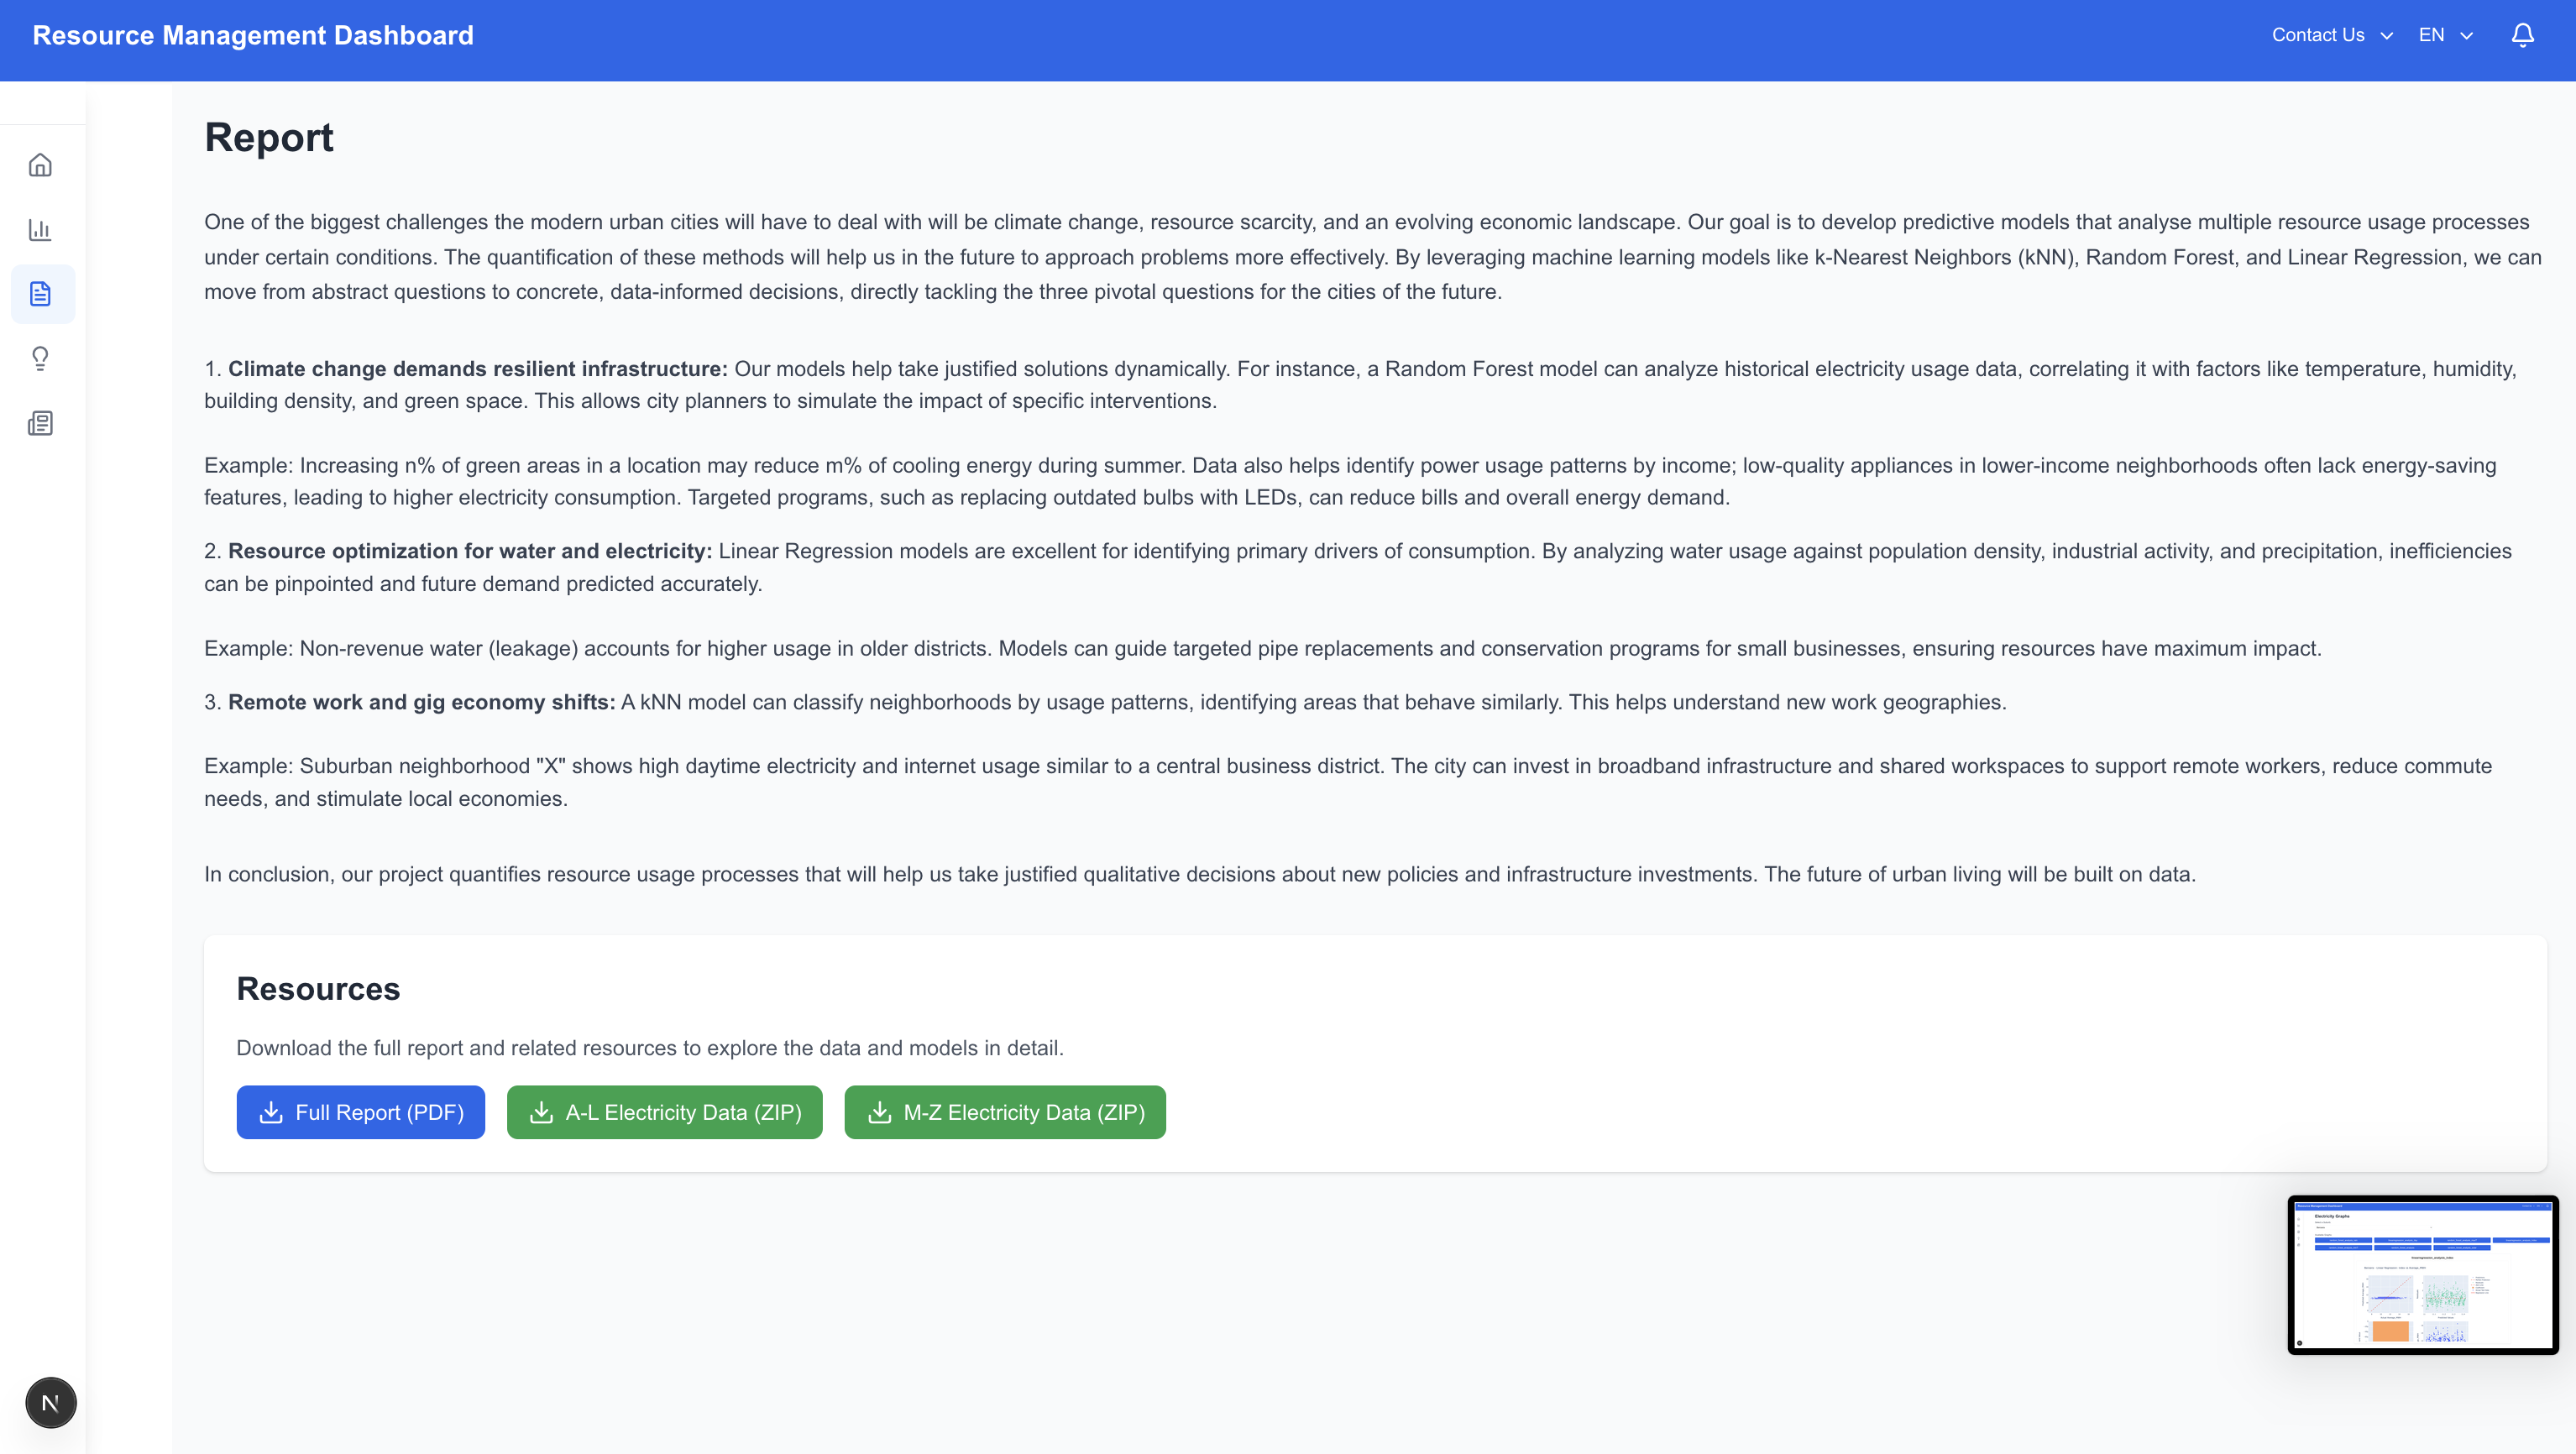
One of the biggest challenges the modern urban cities will have to deal with will be climate change, resource scarcity and an evolving economic landscape. Our goal is to develop predictive models that analyse multiple resource usage processes under certain conditions. The quantification of this methods will help us in the future to approach problems more effectively. By leveraging machine learning models like k-Nearest Neighbors (kNN), Random Forest, and Linear Regression, we can move from abstract questions to concrete, data-informed decisions, directly tackling the three pivotal questions for the cities of the future.
- Climate change demands infrastructure that is not only efficient but also resilient and adaptive. Our models could help us to take justified solutions dynamically. For instance, a Random Forest model can analyze historical data on electricity usage, correlating it with factors like temperature, humidity, building density, and green space. This allows city planners to simulate the impact of specific interventions. For example, a model might help us understand that the increase in n% of green areas in a certain location will lead us to a reduction of m% of cooling energy during summer. The data could also help us understand the power usage in certain locations according to income. It is widely recognized that household electronics in lower-income neighborhoods often suffer from substandard quality, which means that the power usage of such devices may be inefficient or inconsistent. Lower-quality appliances often lack energy-saving features, leading to higher electricity consumption despite limited usage. According to this data, we could identify high-consumption, low-income areas and implement targeted state-sponsored electronics programs. One practical initiative could involve replacing outdated, inefficient light bulbs with energy-saving LED alternatives. This not only reduces household electricity bills but also contributes to broader sustainability goals by lowering overall energy demand.
- For resources like water and electricity, optimization is key to managing growth without waste. Linear Regression models are excellent for identifying the primary drivers of consumption. By analyzing data on water usage against factors like population density, industrial activity, and precipitation levels, we can pinpoint inefficiencies and predict future demand with high accuracy. For example, a linear model can identify non-revenue water (leakage) accounts for a significantly larger portion of usage in older districts than previously estimated, and that demand is most sensitive to small industrial users. This means that according to the data given by the models we could prioritize a pipe replacement program in the identified districts and develop conservation programs targeted specifically at small businesses, ensuring resources are directed where they will have the greatest impact.
- The rise of remote work and the gig economy shifts energy and transit patterns away from traditional central business districts. A kNN model can classify neighborhoods based on usage patterns, identifying areas that behave similarly. This helps understand the new geography of work. For example, the analysis could show that suburban neighborhood "X" has electricity and internet usage patterns (high daytime consumption) that closely resemble those of a known central business district, indicating it has become a significant hub for remote workers. This means that the city can invest in bolstering broadband infrastructure in neighborhood "X" and consider deploying shared, flexible co-working spaces to support this new cluster of workers, fostering local economic activity and reducing the need for long commutes. In conclusion, our project quantifies resource usage processes that will help us to take justified qualitative decisions about new policies and infrastructure investments. The future of urban living will be built on data.
Built With
- css
- fastapi
- html
- next.js
- python
- reacts
- tailwind
- typescript


Log in or sign up for Devpost to join the conversation.