-
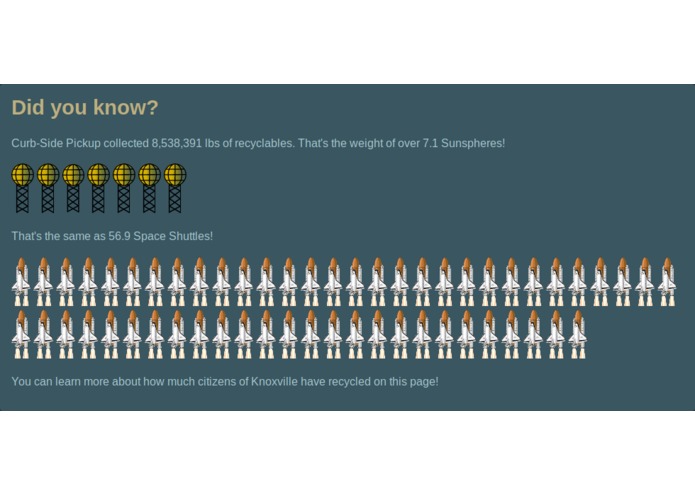
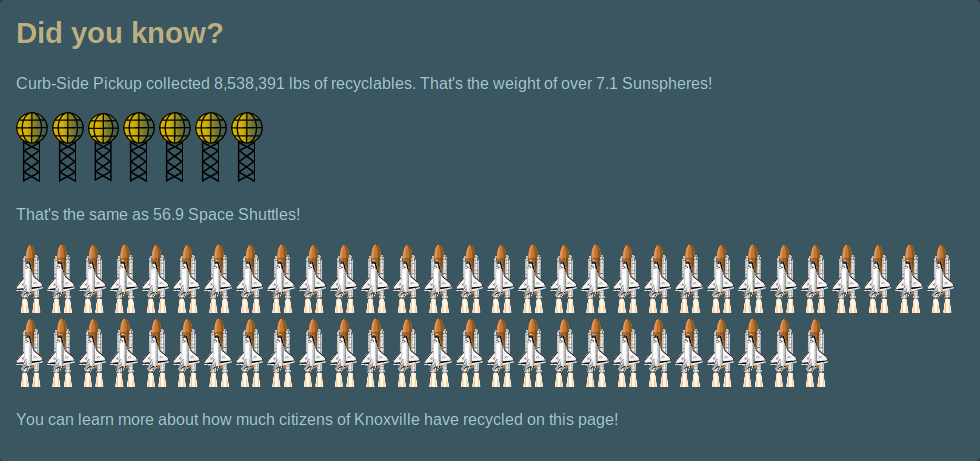
Fun facts about waste!
-
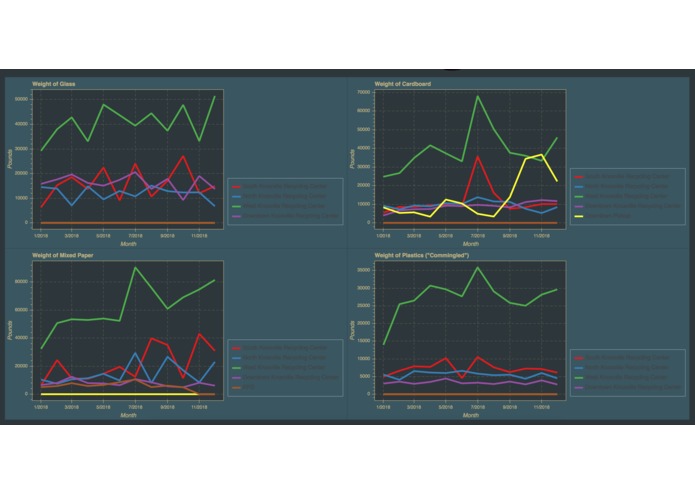
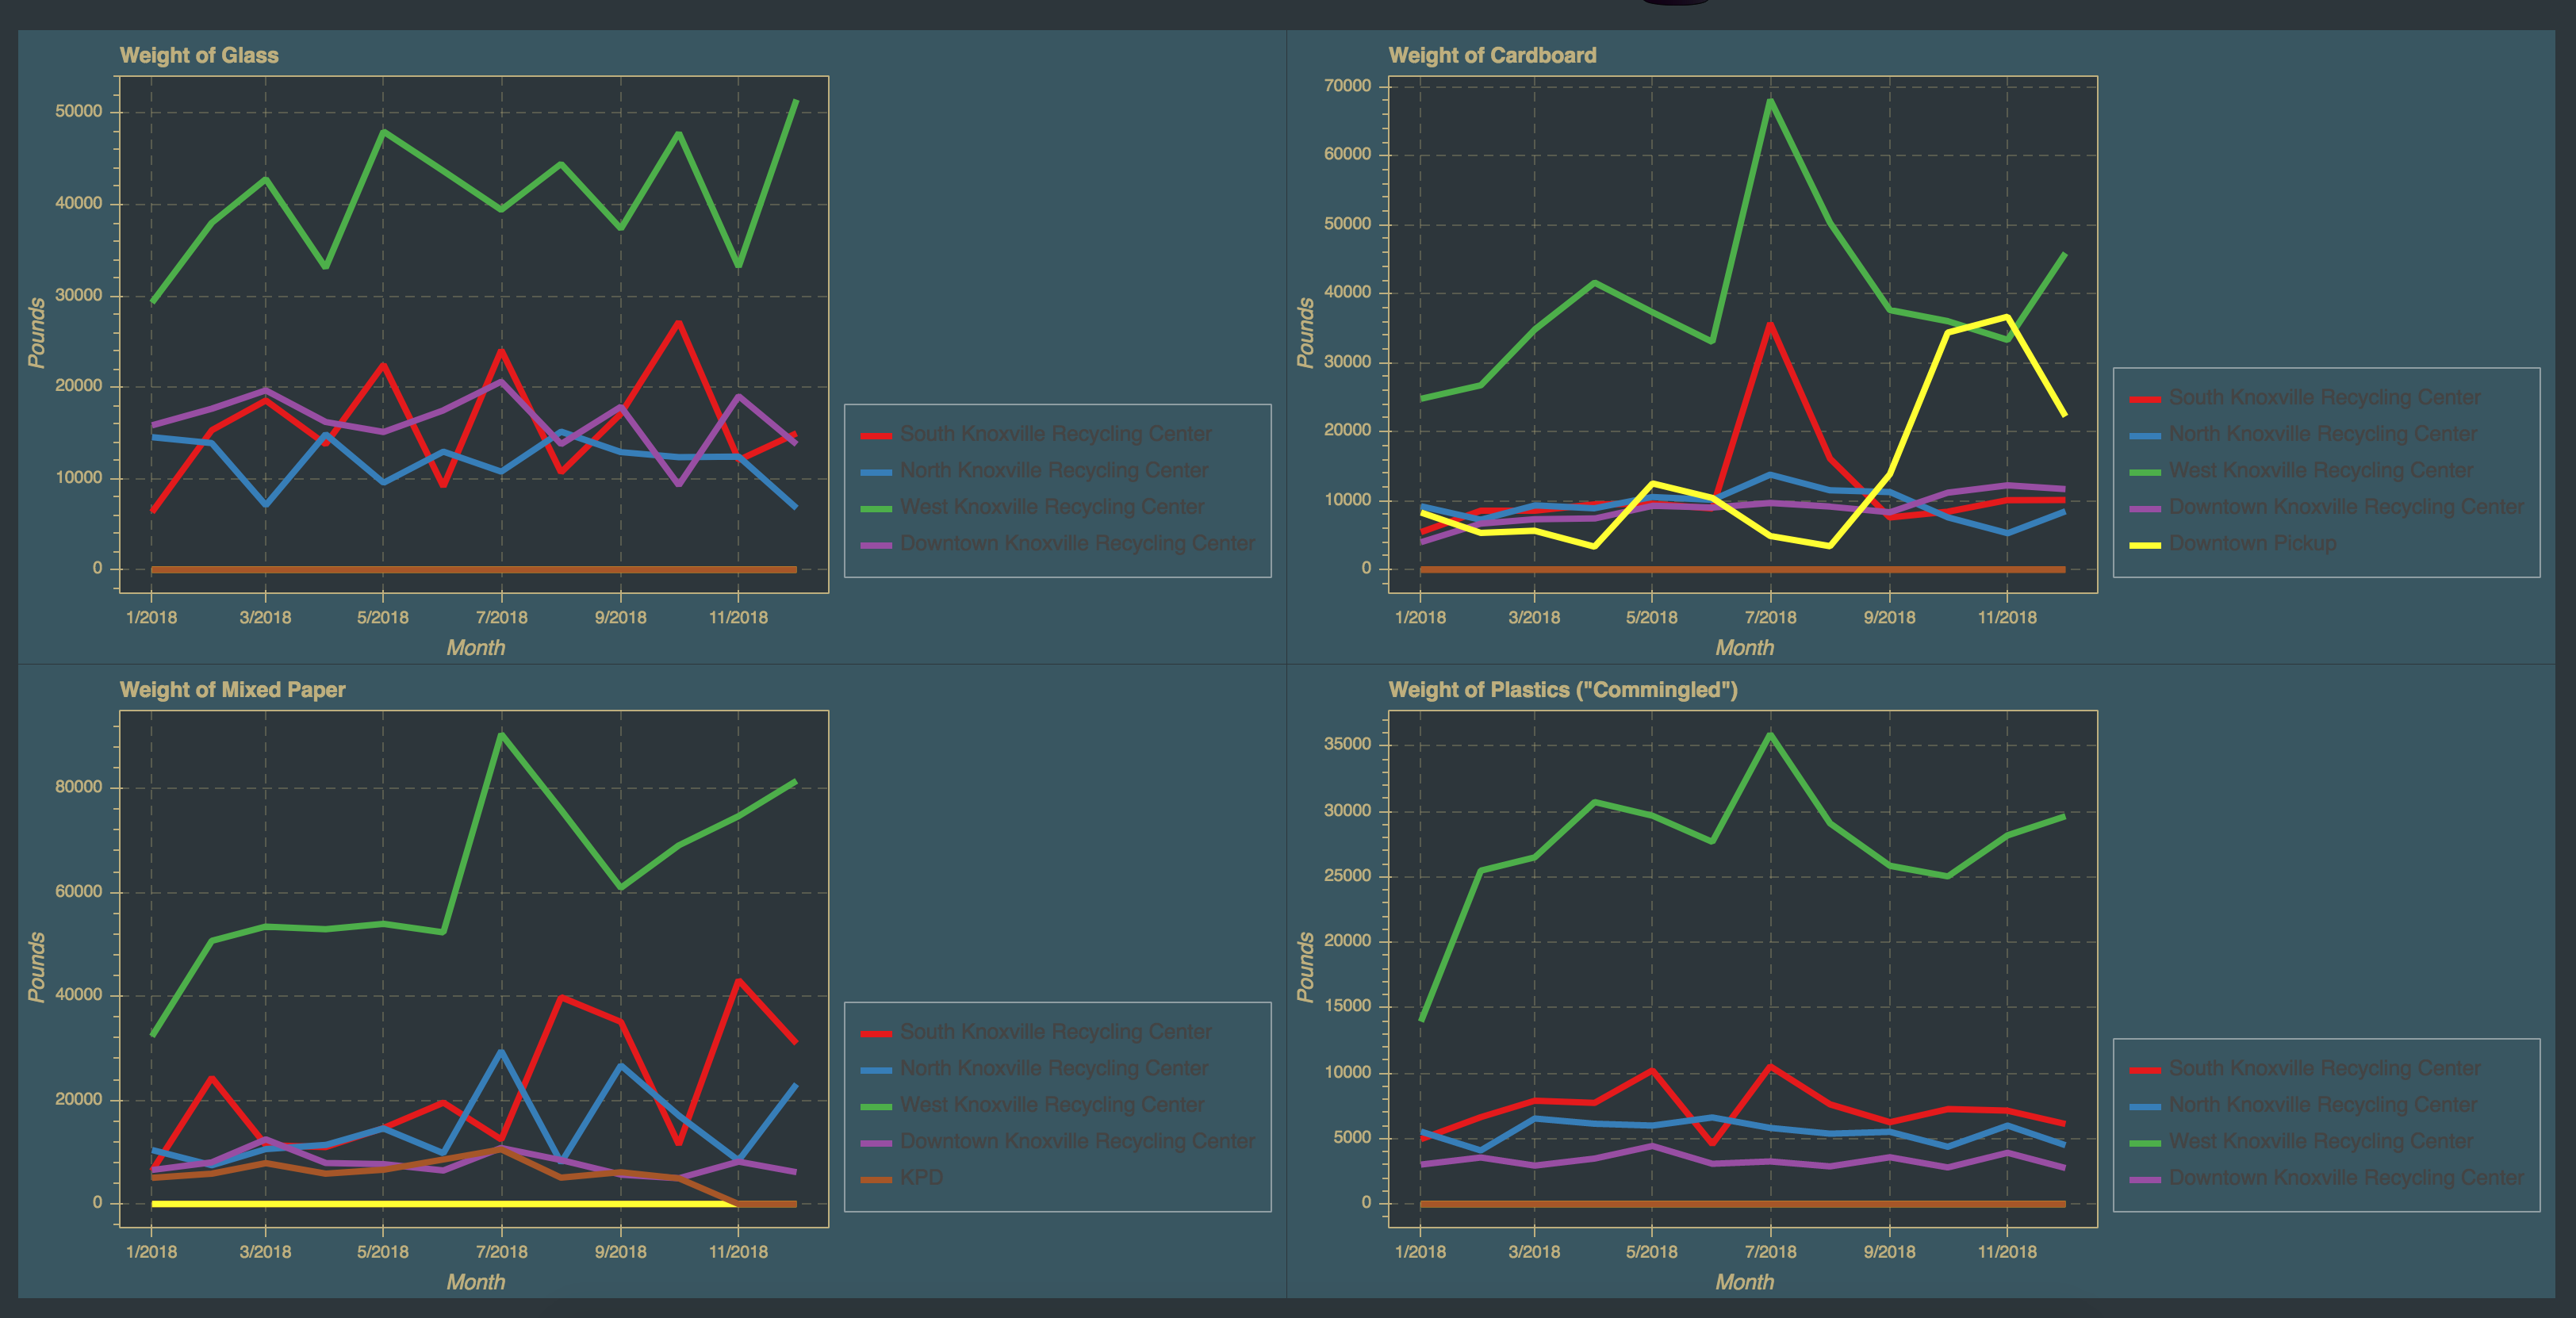
Informative charts! They can switch between units like pounds, tons, sunspheres, and space shuttles!
-
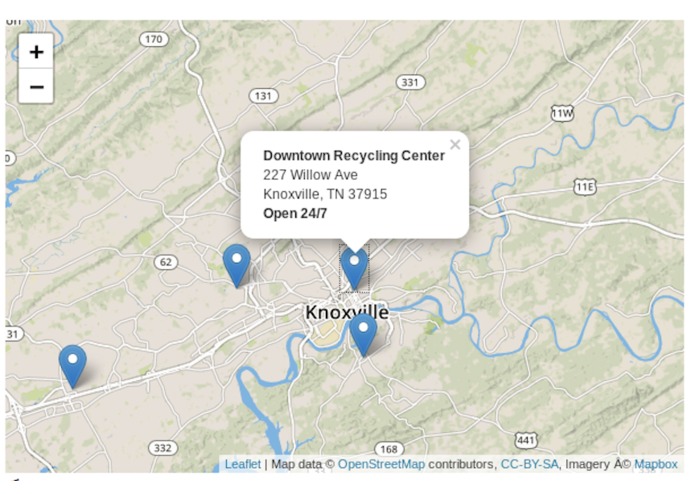
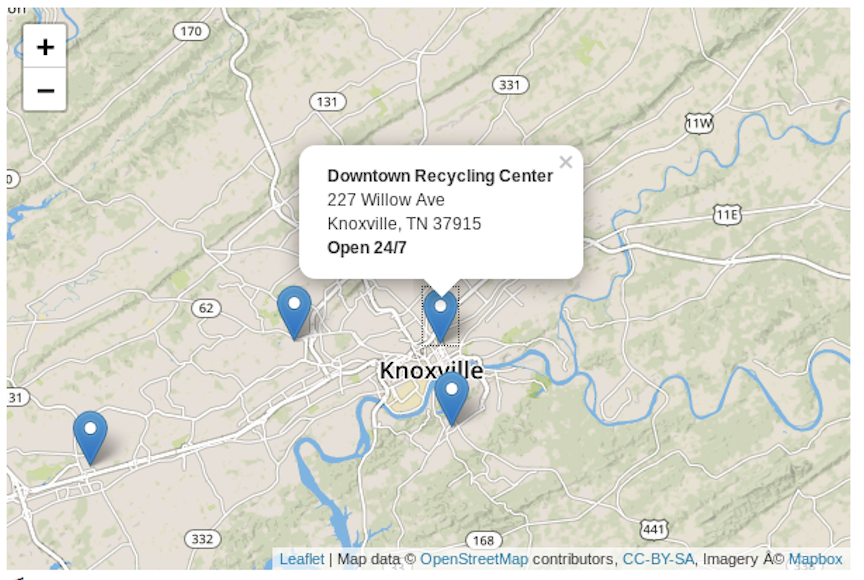
Our map with recycling centers and their hours!
-
Spiffy logo!

Inspiration
We want to inform citizens of Knoxville about the amount of waste and recycling in their home city, and educate them on how and where they can recycle. The goal of this project from a technology perspective was to show the power of the open source python ecosystem to address the data cataloging, calculation of key features, and interactive visualization needs of our client. This pythonic approach is equally applicable in other contexts such as banks where the data resources are located in seperate databases and complex bussiness logic is required to produce interactive visualizations.
What it does
The waste and resources department has their data in several locations (excel spreadsheets). A data catalog was used to unify the data as a single resource and expose the data as a dataframe. Allowing each datasource to be manipulated in the same way. Additionally it allow the data to update with each new month of data automatically.
Waste and Resources
Our client stated that the goal was to have report materials that can make for a more educated "garbage geek culture". She would like the visualizations to update
Technology
The goal of this project from a technology perspective was to show the power of the open source python ecosystem to address the data cataloging, calculation of key features, and interactive visualization needs of our client. This pythonic approach is equally applicable in other contexts such as banks where the data resources are located in seperate databases and complex bussiness logic is required to produce interactive visualizations.
Data Processing and Data Catalog (Intake)
The waste and resources department has their data in one large excel file containing multiple sheets with several matrices each for different types of waste. We processed this excel sheet using pandas, saving the data out into one csv file per matrix. A data catalog was used to unify the data as a single resource and expose the data as a dataframe. Allowing each datasource to be manipulated in the same way. Additionally it allow the data to update with each new month of data automatically.
import intake

catalog = intake.open_catalog('catalog.yml')
catalog.solid_waste_commodity_recycling

Dashboard Visualization (Bokeh + LeafletJS)
Our client wanted to have accessible infographics about the current waste month by month, plotting, and resources to create a more educated "garbage geek culture". We thought a dynamic single page dashboard application would address the needs of our customer. Uses a bokeh python server running in background to provide richer interactive experience.

Filters
visitors can apply filters which update all graphs:
- date range of data
- change units that all plots are being calculated with

Dynamic "Did you know questions?"
Did you know questions python generated, randomly selected, and update with current monthly data.

Dynamic Text Fields
Autoupdating text fields within dashboard that are calculated from data.
Challenges we ran into
We couldn't get our own map to work on all computers, so we had to use a google one :( We think the issue is a conflict between leaflet styling and bokeh styling.
Accomplishments that we're proud of
We have a working single-page website that is informative and fun!
What we learned
We learned lots about web development, map-making and bokeh! Each of us used tools and libraries that we were previously unfamiliar with.
What's next for WasteKnox
More cool facts, more useful charts, and hopefully people who use it!
Built With
- bokeh
- css
- html
- intake
- leaflet.js
- pandas
- python


Log in or sign up for Devpost to join the conversation.